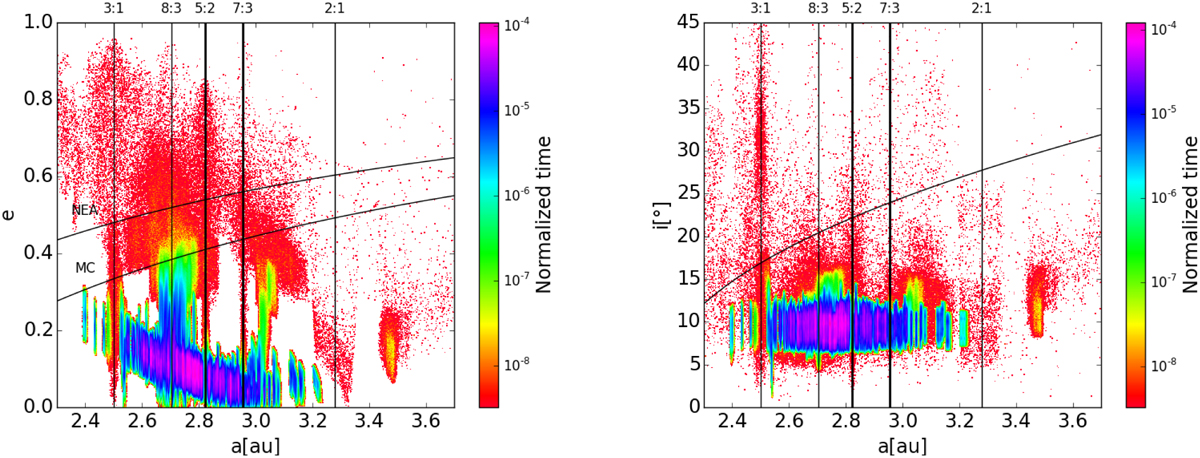
Fig. 3
Download original image
Maps of the dynamical evolution of the ejected Ceres fragments in the (a,e) plane (left panel) and (a,i) plane (right panel) in MaxS. The colourbar indicates the normalised time each cell was occupied by a fragment, relative to the maximum integration time of Τ ~ 700 Myr. The vertical lines indicate the position of the main MMR with Jupiter. The curves in the (a, e) plane indicate the regions with q < 1.665 au and q < 1.3 au, associated with the MC and NEAs, respectively. The curve in the (a,i) plane indicates the position of the v6 resonance.
Current usage metrics show cumulative count of Article Views (full-text article views including HTML views, PDF and ePub downloads, according to the available data) and Abstracts Views on Vision4Press platform.
Data correspond to usage on the plateform after 2015. The current usage metrics is available 48-96 hours after online publication and is updated daily on week days.
Initial download of the metrics may take a while.