Fig. 4
Download original image
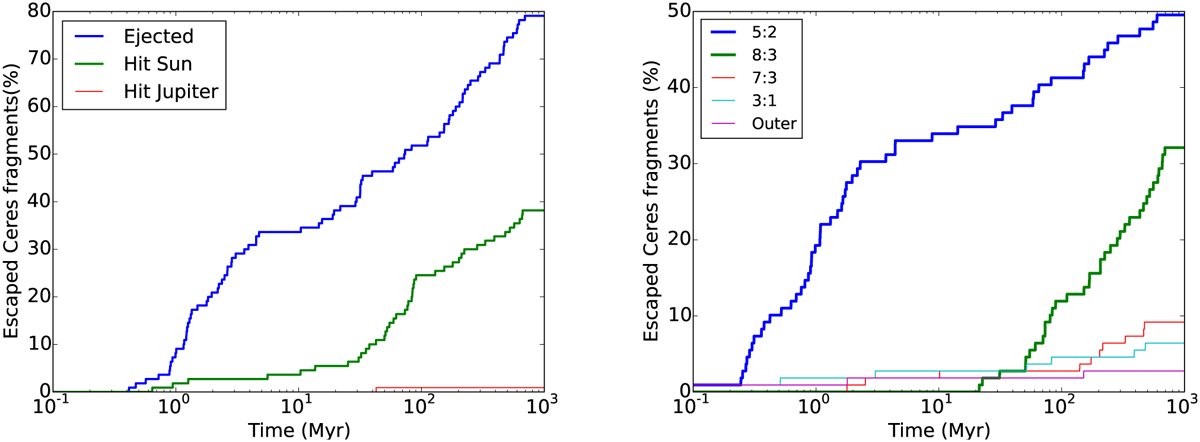
Left: end states of the escaped Ceres fragments represented as a percentage of the total number of ejected fragments as a function of time. The different curves indicate the final states reached by the fragments, including ejection from the Solar System, collision with the Sun, and collision with Jupiter. Right: escape routes of Ceres fragments represented as a percentage of the total number of escaped fragments as a function of time. The different curves indicate the main MMR by which the Ceres fragments escaped the MB.
Current usage metrics show cumulative count of Article Views (full-text article views including HTML views, PDF and ePub downloads, according to the available data) and Abstracts Views on Vision4Press platform.
Data correspond to usage on the plateform after 2015. The current usage metrics is available 48-96 hours after online publication and is updated daily on week days.
Initial download of the metrics may take a while.