Fig. 11
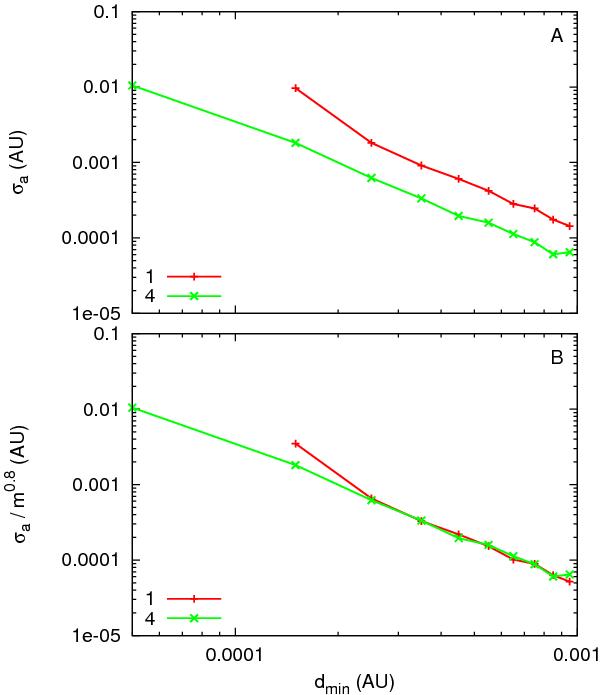
Semi-major axis jump size for a single encounter with Ceres (1) and Vesta (4) as a function of the minimum distance of approach. Close encounters with both asteroids are sorted into 0.001 AU wide strips of minimum distance of approach. For each band we plot A) the standard deviation (corrected from the noise) of the jump size distribution. This plot needs the effect of encounters to be much higher than the noise. It also needs a sufficient number of encounters in each band to attain a regular curve. This is why we only plotted the curves of Ceres and Vesta. We also plot B) the standard deviations with a renormalization for Ceres. We divided Ceres values by the mass ratio of Ceres and Vesta to the power 0.8. Vesta’s curve is left unchanged. This power law would be equivalent to a slope of 1.6 (instead of 1.2) in Fig. 8. However, the fit of the slope in Fig. 8 is made with 11 points and is therefore more reliable.
Current usage metrics show cumulative count of Article Views (full-text article views including HTML views, PDF and ePub downloads, according to the available data) and Abstracts Views on Vision4Press platform.
Data correspond to usage on the plateform after 2015. The current usage metrics is available 48-96 hours after online publication and is updated daily on week days.
Initial download of the metrics may take a while.