| Issue |
A&A
Volume 539, March 2012
|
|
|---|---|---|
| Article Number | A51 | |
| Number of page(s) | 16 | |
| Section | Galactic structure, stellar clusters and populations | |
| DOI | https://doi.org/10.1051/0004-6361/201117874 | |
| Published online | 23 February 2012 | |
Tracking down R Coronae Borealis stars from their mid-infrared WISE colours⋆,⋆⋆
Research School of Astronomy and Astrophysics, Australian National University, Cotter Rd, Weston Creek, ACT 2611, Australia
e-mail: This email address is being protected from spambots. You need JavaScript enabled to view it.
Received: 11 August 2011
Accepted: 24 November 2011
Abstract
Context. R Coronae Borealis stars (RCBs) are hydrogen-deficient and carbon-rich supergiant stars. They are very rare, with only ~50 actually known in our Galaxy. Interestingly, RCBs are strongly suspected of being the evolved merger product of two white dwarfs and could therefore be an important tool for understanding supernovae type Ia in the double degenerate scenario. Constraints on the spatial distribution and the formation rate of such stars are needed to picture their origin and test it in the context of actual population synthesis results.
Aims. It is crucial to increase the number of known RCBs significantly. With an absolute magnitude MV ~ −5 and a bright/hot circumstellar shell made of amorphous carbon grains, RCBs are so distinctive that we should nowadays be able to find them everywhere in our Galaxy using publicly available catalogues. In the optical, the search is difficult because RCBs are known to undergo unpredictable photometric declines; however, mono-epoch mid-infrared data can help us to discriminate RCBs among other dust-producing stars. The aim is to produce from the mid-infrared WISE and near-infrared 2MASS catalogues a new catalogue of reasonable size, enriched with RCB stars.
Methods. Colour–colour cuts used on all stars detected are the main selection criteria. The selection efficiency was monitored using the 52 known RCBs located in the sky area covered by the WISE first preliminary data release.
Results. It has been found that selection cuts in mid-infrared colour–colour diagrams are a very efficient method of distinguishing RCBs from other stars. An RCB enriched catalogue made of only 1602 stars was produced, with a high detection efficiency of about 77%. Spectral energy distributions of 49 known RCBs and 5 known HdCs are also presented with estimates of their photosphere and circumstellar shell temperatures.
Conclusions. The newly released WISE all sky catalogue has proven to be a valuable resource in finding RCB stars. Actual scenarios predict that between 100 and 500 RCBs exist in our Galaxy. The newly created RCB enriched catalogue is an important step towards significantly increasing the number of known RCB stars and therefore better understanding their origin.
Key words: stars: AGB and post-AGB / circumstellar matter / stars: carbon / infrared: stars / catalogs
Tables 3–5 ara available in electronic form at http://www.aanda.org
Full Table 5 is only available at the CDS via anonymous ftp to cdsarc.u-strasbg.fr (130.79.128.5) or via http://cdsarc.u-strasbg.fr/viz-bin/qcat?J/A+A/539/A51
© ESO, 2012
1. Introduction
Classes of stars exist that differ from the vast majority of the stars known in the sense that they are hydrogen deficient. They are called extreme helium stars (eHe), hydrogen-deficient carbon stars (HdC), and R Coronae Borealis (RCB) stars. The last two are supergiant carbon-rich stars so have strong spectroscopic similarity, but only RCBs are known to undergo unpredictable, fast, and large photometric declines (up to 9 mag over a few weeks) due to carbon clouds forming close to the line of sight that obscure the photosphere. Such particular events in such peculiar stars have made RCBs much-followed objects among many generations of astronomers. Nowadays, RCBs have become even more interesting because they are increasingly suspected of resulting from the merger of two white dwarfs (one CO- and one He-), called the double degenerate (DD) scenario. The DD model has been strongly supported by the observations of an 18O overabundance in HdC and cool RCB stars (Clayton et al. 2007; García-Hernández et al. 2010) and of surface abundance anomalies for a few elements, fluorine in particular (Pandey et al. 2008; Jeffery et al. 2011). RCBs are actually the candidates favoured to be the lower mass counterpart of supernovae type Ia objects in a DD scenario (Fryer & Diehl 2008; Diehl et al. 2008), therefore detailed studies of their peculiar and disparate atmosphere composition would help us constrain simulations of merging events (Jeffery et al. 2011).
RCB stars are rare. We currently know of about 50 of them in the Milky Way (see Tisserand et al. 2008, and references therein), which is only a factor of two higher than in the Magellanic Clouds, where 23 RCBs are known (Alcock et al. 2001; Tisserand et al. 2004, 2009). The small number of known RCB stars and the bias due to their discovery from different surveys prevent us from having a clear picture of their true spatial distribution. Different views are found in the literature. Iben & Tutukov (1985) reported a scale height of h ~ 400 pc assuming Mbol = −5 and concluded that RCBs are part of an old disk-like distribution. However, Cottrell & Lawson (1998) noted that the Hipparcos velocity dispersion of RCB stars is similar to those of other cool hydrogen-deficient carbon stars and extreme helium stars, suggesting that RCB stars might have a bulge-like distribution. Recently, adding to the confusion, Tisserand et al. (2008) have found that the majority of Galactic RCB stars seem to be concentrated in the bulge with the surprising peculiarity of being distributed in a thin disk structure ( pc, 95% c.l.). It is therefore necessary to increase the number of known RCB stars to constrain their spatial distribution and their age, but also understand their past evolution. I note that, with an RCB phase lifetime of about 105 years, as predicted by theoretical evolution models (Saio & Jeffery 2002), and an estimated He-CO white dwarfs merger birthrate between ~ 10-3 and ~5 × 10⁻³ per year (Nelemans et al. 2001; Ruiter et al. 2009), we can expect between 100 and 500 RCB stars to exist in our Galaxy.
RCB stars are very bright,  (Tisserand et al. 2009, Fig. 3), and can therefore easily be found anywhere in our Galaxy. However, numerous observations are needed to look for their main signature, the large declines in luminosity. Well-sampled light curves, with a limiting magnitude of ~18 for a large portion of the sky, will not be available until the arrival of the LSST telescope1. Fortunately, RCBs are also known to possess relatively warm and bright circumstellar shells which are easily detected in the mid-infrared. These shells are made of amorphous carbon dust that translates into an almost featureless mid-infrared spectrum (Aníbal García-Hernández et al. 2011), unlike the spectra of classical old stars that have silicate and hydrogen-rich dust shells. Therefore, one can imagine finding RCBs with only the publicly available infrared catalogues. Such attempts have been made: Tisserand et al. (2011) found two new RCBs in the Galactic bulge using mainly mid-infrared Spitzer2 GLIMPSE3 data and OGLE-III4 light curves, and Kraemer et al. (2005) found cool objects in the Small Magellanic Cloud (SMC) with featureless spectra using the Spitzer spectrograph. Therefore it is interesting to look at how the first data release of the all-sky mid-infrared survey WISE (Wide-Field Infrared Survey Explorer) (Wright et al. 2010) can improve our search for RCBs. This is the goal of the research described in this article.
In Sect. 2, I describe briefly the WISE survey and catalogue and explain the impact of the [4.6] band bias observed on bright objects using the spectral energy distribution of known RCB stars. I describe in Sect. 3 all the criteria used in the analysis to select a small subsample of the WISE catalogue, which is enriched in RCB stars. Section 4 is a discussion of the outcome of the analysis and of the characteristics of the newly formed catalogue.
2. WISE catalogue and the known RCB stars
The Wide-field Infrared Survey Explorer (WISE) mapped the entire sky during 2010 in 3.4, 4.6, 12 and 22 μm with, respectively, 6.1, 6.4, 6.5 and 12.0 arcsec in angular resolution and 0.08, 0.11, 1.0 and 6.0 mJy in point source sensitivities at 5 sigma (Wright et al. 2010). A few months later, a preliminary data release (WISE-PDR1) was delivered from the first 105 days of observation. The catalogue contains 257 million sources spread over 57% of the sky. Fortunately for an RCB star search, the released sky area covers the entire Galactic bulge (see Fig. 1), where most of the known RCBs are located.
Indeed, 46 of 52 Galactic and four of 23 Magellanic RCBs are catalogued in WISE-PDR1, but also all five known HdCs and four DY Per type stars. All WISE magnitudes and the 1-sigma error associated are listed in Table 3 for each object. In Table 4, I also list fluxes and 1-sigma errors of all bright Galactic RCBs observed by the AKARI satellite, which did a mid-infrared all-sky survey in 2006 in six bands (centred at 9 and 18 μm with the IRC camera, and 65, 90, 140 and 160 μm with the FIS camera) (Murakami et al. 2007).
Photometry of bright unsaturated sources in WISE-PDR1 has an accuracy of about 2% in [3.4], [4.6], and [12], and about 3% for [22] (see for more details Cutri et al. 2011, the WISE preliminary release explanatory supplement document). The sensitivity varies significantly due to the different depth of coverage (~10 epochs on average), the background emission, and the source confusion. Saturation begins to affect sources brighter than approximately 8.0, 6.7, 3.8, and –0.4 mag, respectively, in all four bands. Most of the known RCBs are brighter than these limits, therefore only the PSF-fitting magnitudes will be used in the study. Measurements of saturated sources were done with the unsaturated pixels in the objects’ wings. Profile-fit photometry begins to fail for sources brighter than 1.0, 0.0, –2.0, and − 6.0 mag, which are fortunately brighter than the brightest known RCB star. Photometric bias due to saturation remains small (<0.1 mag) for the [3.4], [12] and [22] WISE bands; however, an overestimate in brightness is observed in the [4.6] band, up to nearly 1 mag for objects brighter than 3 mag above the saturation limit (which corresponds to [4.6] ~ 3.5 mag). The impact of this bias on bright [4.6] objects will be discussed several times in this article, especially in Sect. 2.2.1.
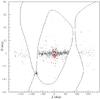 |
Fig. 1 Representation of the Galactic map, b vs. l, with all objects selected by the analysis (black dots) and the known Galactic RCB stars (larger red dots). The black lines represent the approximate limits of the sky area released in the WISE-PDR1 catalogue. |
2.1. WISE variability and classification flags
RCB shell brightness varies. Feast et al. (1997) have shown that one can also observe in the L band (3.5 μm) the short-term oscillations that are observed in the optical ( ± 0.5 mag), as the shell reflects light from the photosphere. However, the typical RCB large photometric declines are not observed in the mid-infrared as only the photosphere gets obscured by clouds. The effect of these clouds on the shell luminosity is different. Clouds produced in any direction, not just in the line of sight, will obscure the light coming from the star and therefore make the shell luminosity gradually fainter. Mid-infrared monitoring could therefore be used as a good indicator of change in the dust formation rate around the photosphere of an RCB star. A clear example is presented by Feast et al. (1997) with UW Cen, where a variation of up to 3 mag in ~1000 days was observed. This phenomenon is also described well by Clayton et al. (1999).
WISE-PDR1 gives a variability flag for each band. Therefore one can expect to get a positive variability flag for some of the RCBs catalogued. However, none of them was flagged to be variable, which is surprising because pulsations with periods between 30 to 60 days and amplitudes of ~0.5 mag should have been noticed. The variability flag was calculated if an object was observed at least 11 times, but only 45% of the RCBs have passed this threshold. (Z Umi has the record with 34 measurements, followed by R CrB and Y Mus with 20 measurements.) Furthermore, successive observations of a WISE field were made on a short time scale. They span a maximum a time range of a few days, which could be too short to observe variability in RCBs.
A classification (star/galaxy) flag is also available in WISE-PDR1, but it will not be used in subsequent analysis as most of the catalogued RCBs were found to be inconsistent with a point source.
The optical and near-infrared maximum apparent magnitudes determined from the AAVSO, ASAS, DENIS and 2MASS datasets.
2.2. Spectral energy distributions
The spectral energy distributions (SEDs) of all bright Galactic RCB and HdC stars were reconstructed using catalogues from six different surveys done in the past ten years (see Figs. 9 to 12). In the optical, it is important to measure the maximum brightness of an RCB, and only well-sampled monitoring on a long time scale can give us a confident result. Therefore, light curves published by AAVSO5 (4 bands: B, V, R, and I) and ASAS-36 (V band) surveys were analysed. The DENIS7 I magnitude was also used if the epoch corresponded to a maximum brightness phase, as shown by AAVSO or ASAS-3 lightcurves. Overall, the maximum brightness measured in each optical band is accurate to ~0.05 mag (1-sigma standard error). In the near-infrared, the 2MASS8J, H, and K magnitudes were used. Due to the pulsating variability of RCB stars brightness, the accuracy of the maximum brightness measurement in these three bands is low, and estimated to be ~0.3 mag. A carbon extinction correction was applied if the 2MASS epoch corresponded to a fading phase of an RCB. This was the case for only seven stars: SU Tau, UW Cen, RZ Nor, V517 Oph, WX CrA, V348 Sgr and DY Per. We used the ΔV magnitude variation observed at that particular epoch for these corrections and the absorption coefficients of pure amorphous carbon dust presented by Groenewegen (1995, Fig. 2). All magnitudes used in the study are listed in Table 1, along with the interstellar reddening and extinction factors, E(B − V) and AV, obtained from the COBE/DIRBE9 map (Schlegel et al. 1998) with a 4-pixel interpolation. The 1-sigma error on E(B − V) is about 0.1 mag and becomes higher at higher extinction, up to 0.3 mag at E(B − V) ~ 1.2 mag (Tisserand et al. 2008). These extinction coefficients were applied to all optical and near-infrared magnitudes using Pei (1992) extinction curves, except for seven stars located at low Galactic latitude ( deg) where Schlegel et al. (1998) note that the calculated reddening is uncertain and untrustworthy as no contaminating sources were removed10. For these stars, the reddening was calculated from the Asplund et al. (2000) photosphere effective temperature determined using high-resolution spectra and the V − I colour index of the stars before reddening correction.
The SEDs were fitted using the program DUSTY (Nenkova et al. 2000) with two (or three if necessary) black bodies, a shell made entirely of amorphous carbon grains and an MRN (Mathis et al. 1977) size distribution from 0.005 to 0.25 μm. The DUSTY models used have a photosphere temperature ranging from 2800 and 20 000 K in steps of 100 K and a shell temperature ranging from 300 to 1200 K in steps of 50 K. The shell visual optical depth, τV, varied also between 10-3 and 10 on a logarithmic scale with 40 increments. The results are presented in Figs. 9 to 12, together with the fitted effective temperatures. (As mentioned earlier, for 7 RCBs located at low Galactic latitude, the photosphere effective temperature was fixed to the temperature determined by Asplund et al. 2000). In the mid-infrared, only three WISE magnitudes were used: the [4.6] band was not considered. AKARI magnitudes were fitted if no WISE magnitudes were available – this is the case with UV Cas, U Aqr and V482 Cyg – or if a clear third cold black body was observed (as with DY Cen, MV Sgr, UW Cen, and WX CrA).
As described in Sect. 2.1, RCB’s shell brightness varies. It is therefore not surprising to observe differences in luminosity between the WISE and AKARI data, which were taken four years apart. Such differences are visible on the SEDs presented, particularly with RT Nor, where a ~2 mag variation is observed, but also with V1783 Sgr and V3795 Sgr. I note that the 2MASS K band can also be affected by shell brightness variation in the case of a hot shell (see WX CrA SED for example). The K flux was not used in the SED fit if it clearly contradicted the mid-infrared fluxes.
On average, the accuracy on the temperature and optical depth estimates is not better than ~10%, because of the combined effect of the interstellar dust extinction uncertainty (main effect), the missing U band magnitude and because I did not use a model of a carbon-rich photosphere11 (see Lobel et al. 1998). I compared the photosphere effective temperature found to the more reliable one estimated by Asplund et al. (2000) for 17 RCBs using high-resolution spectra (temperatures from Asplund et al. 2000, are also indicated in the SED figures). Clearly, the SED method overestimates the photosphere effective temperature by about 600 K on average. On the other hand, for four of the seven RCB stars (RZ Nor, Y MUs, UV Cas and V3795 Sgr) located at low Galactic latitude, the best SED model found with a photosphere temperature fixed to the one estimated by Asplund et al. (2000) and with an interstellar reddening deduced from this temperature, does not fit the near-infrared magnitudes well, indicating that the photosphere temperatures could be underestimated.
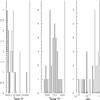 |
Fig. 2 From left to right, distribution of the fitted effective temperature of the RCBs’ photosphere and shell, and the shell optical depth. |
Nevertheless, with this simple exercise, I can confirm that RCB stars cover a wide range of photosphere temperatures, with the vast majority having a temperature between ~4000 K and 8000 K (spectral type K to F), with a few exceptions being hotter than 10 000 K (DY Cen, MV Sgr, and V348 Sgr) (De Marco et al. 2002). RCBs also have a wide range of shell temperatures ranging from ~400 to ~1000 K. The typical RCB shell temperature is about 700 K with a visual optical depth of τV ~ 0.4. The distributions of these three parameters are presented in Fig. 2.
The SEDs of HdC stars, presented in Fig. 12, confirm that their spectral types are F-G, with an effective temperature ranging from 5500 to 7000 K. As no brightness declines have ever been recorded with HdC stars, it is unsurprising to not detect a mid-infrared excess in their SEDs, but interestingly in the case of one HdC, HD 175893, one can fit a second blackbody that corresponds to a shell with an effective temperature of ~500 K. HD 175893 could therefore be an RCB star going through a long period of low activity, corresponding to a low, if any, dust production rate. Furthermore, I note that HD 175893 has passed all the RCB selection criteria described below in Sect. 3.
2.2.1. WISE [4.6] band bias on bright objects
An interesting result of this work comes from the difference in the [4.6] magnitude published by WISE and the one expected from the best SED model found. Figure 3 summarises the situation. As mentioned earlier, the WISE team reported a bias for bright objects in the [4.6] band, whose brightness could be overestimated by almost 1 mag. I confirm this effect. One can see that for RCBs brighter than [4.6] ~ 5.0 mag, there is a gradual increase in an overestimation of the [4.6] brightness, up to ~0.9 mag, and a decrease after [4.6] ~ 3.0 mag down to the nominal brightness. RCBs whose [4.6] magnitude is certainly affected (with ![Mathematical equation: \hbox{$5.0\leqslant [4.6] \leqslant 1.5$}](/articles/aa/full_html/2012/03/aa17874-11/aa17874-11-eq37.png) mag) are indicated in Table 3. The WISE team has not yet found the source of this bias. This significant effect will be taken into account in the analysis described below.
mag) are indicated in Table 3. The WISE team has not yet found the source of this bias. This significant effect will be taken into account in the analysis described below.
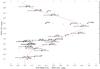 |
Fig. 3 Diagram representing the measured WISE [4.6] magnitudes of known RCB stars versus the difference in magnitude between the WISE measurement and the best SED model found. For objects brighter than [4.6] ~ 5.0, the [4.6] WISE brightness is overestimated, reaching ~0.9 mag at [4.6] ~ 3.0 mag. The red line is a representation of this bias. |
3. Analysis
Using the WISE and 2MASS catalogues, a series of pragmatic selection criteria was developed and optimised to create a reasonably size catalogue enriched in RCB stars located within 50 kpc. The criteria are described below. The detection efficiency of each cut was controlled using 52 known RCBs (see Table 2).
Colour–colour cuts on all stars detected in every four WISE and three 2MASS broadbands are the main selection criteria used, since they do not affect the distance of the RCB. These selection criteria are as follows.
-
1.
The first selection criterion is simply to keep all objects detectedand listed in the WISE catalogue. This process is made difficult bythe brightness of RCB stars (often saturated) but also by theblending effect at low Galactic latitude where many RCB stars areexpected to be. Fifty-two known RCBs are expected to have beencatalogued in WISE-PDR1 from the sky area released (seeFig. 1). However, two are missing, OGLE-GC-RCB-1 & -2, which had been discovered already from their shellbrightness and colours using the Spitzer-GLIMPSE catalogue (Tisserand et al. 2011). These twoRCBs are located at very low Galactic latitude (b ~ 3.0 and ~−1.8 deg) in a very crowded field. They are clearly bright and distinguishable on WISE reference images, in all bands, but the WISE source finder did not succeed in retrieving them. This first criterion therefore has an important effect on the overall analysis and final outcome completeness. However, this issue may be corrected in later WISE data releases.
-
2.
The selected objects have to have an entry in all of the four WISE bands. The main WISE criterion to accept an object in the catalogue is that this object should have been detected with a signal-to-noise higher than 7 in at least one band and detected in four frames minimum. At high Galactic latitude, the detected source distribution remains relatively uniform up to [3.0] < 16.5, [4.6] < 16.0, [12] < 12.5, and [22] < 9.0 mag. The fact that the faintest Magellanic RCB, EROS2-LMC-RCB-5, detected in WISE-PDR1 has magnitudes of ~11.9, ~ 11.4, ~8.6 and ~7.4 mag, respectively, in all four WISE bands, gives us confidence that all RCBs located within ~50 kpc could be detected. RY Sgr is the only RCB star that did not meet this criterion. The problem is related to the other end of the brightness source distribution, as RY Sgr is the second brightest RCB star known in the optical after R CrB, but the brightest in the mid-infrared. RY Sgr failed to have an entry in the [12] band. The impact on the overall detection efficiency is minimal, as the vast majority of the RCBs we are looking for are fainter.
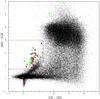
Fig. 4 Diagram of [4.6] − [12] vs. [12] − [22] . The black dots represent 3% of all objects that have been catalogued in all the WISE and 2MASS bands. Larger green dots represent bright known Galactic RCB stars (the two outliers are discussed in the text); red dots correspond to the Galactic RCBs found toward the bulge (with a majority located inside the bulge) (Tisserand et al. 2008; Zaniewski et al. 2005); blue dots are 4 RCB stars located in the south-eastern area of the Large Magellanic Cloud. The purple stars correspond to the 5 known HdC stars and the circles to DYPer type stars with a colour coding identical to RCB stars. The red lines represent the selection cuts used in the analysis.
-
3.
All selected objects have to have an entry in all J, H and K bands of the 2MASS catalogue. All 49 remaining known RCBs have passed this selection. The 2MASS point source magnitude limits are ~15.8, ~15.1, and ~14.3 mag, respectively, in J, H, and K. With MK ~ −6, an RCB star located within ~50 kpc should have an entry in the 2MASS catalogue if there is not very strong interstellar extinction on the line of sight (
 mag). Also, the maximum extinction due to a cloud of carbon soot is known to be Δ ~ 9 mag in V (Clayton 1996), which corresponds to ~3 mag in J and ~1.6 mag in K. Even in that extreme scenario, an RCB star located within ~50 kpc should have been detected by the 2MASS survey under reasonable interstellar extinction conditions (
 mag).
mag). -
4.
The first colour–colour selection cut was applied to the WISE catalogue to select a reasonable number of objects to work with:
![Mathematical equation: \begin{equation} 0.75<[4.6]-[12]<3.0 \hspace{3 mm}\&\hspace{3 mm} [12]-[22]<1.3 . \label{eq.cut1} \end{equation}](/articles/aa/full_html/2012/03/aa17874-11/aa17874-11-eq51.png) (1)This selection is illustrated in Fig. 4. One can see that it is very effective because it selects all objects with a clear shell signal and eliminates most of the galaxies located in the top right-hand corner of the diagram. It keeps only 5% of all objects catalogued, but rejects only two of the RCB stars used as references. These two RCBs are DY Cen and MV Sgr. They do not resemble the majority of RCB stars known, since they are hot (Teff ~ 12 000 K, see Fig. 9) and surrounded with multiple shells. Furthermore and more interestingly, RCB stars are located in an underpopulated area of the diagram. They lie in an area that is well separated from the vast majority of the cooler AGB stars. This selection is refined in selection 6, and a discussion of the impact of the bias that affects bright objects in [4.6] is also presented.
(1)This selection is illustrated in Fig. 4. One can see that it is very effective because it selects all objects with a clear shell signal and eliminates most of the galaxies located in the top right-hand corner of the diagram. It keeps only 5% of all objects catalogued, but rejects only two of the RCB stars used as references. These two RCBs are DY Cen and MV Sgr. They do not resemble the majority of RCB stars known, since they are hot (Teff ~ 12 000 K, see Fig. 9) and surrounded with multiple shells. Furthermore and more interestingly, RCB stars are located in an underpopulated area of the diagram. They lie in an area that is well separated from the vast majority of the cooler AGB stars. This selection is refined in selection 6, and a discussion of the impact of the bias that affects bright objects in [4.6] is also presented. -
5.
RCB stars are known to present an excess in the near-infrared compared to classical supergiant stars (see Tisserand et al. 2009, Fig. 4) due to the warm circumstellar shell that contributes significantly to the near-infrared fluxes. A selection has therefore been applied in the J − H vs. H − K diagram. Because the interstellar extinction affects these magnitudes significantly, cuts were developed for the three following Galactic latitude ranges, A, B and C: A: b > 2 deg, B:
 deg (which corresponds to ⟨AV⟩ ~ 2 mag) and C:
  deg (with ⟨AV⟩ ~ 5 mag). Three selection cuts were applied and are described below. The parameters for each Galactic latitude range are given in square brackets as follows [A, B, C]:
 ![Mathematical equation: \begin{eqnarray} && \hspace{5 mm}(H-K)>[0.2,0.32,0.5] \nonumber \\ &&\!\! \!\!\mathrm{if}\hspace{1 mm}(H-K)\leqslant[0.8,0.92,1.1]: \nonumber \\ && \hspace{5 mm}(J-H)<(H-K)+[0.2,0.28,0.4] \nonumber \\ &&\!\!\!\! \mathrm{if}\hspace{1 mm}(H-K)>[0.8,0.92,1.1]: \nonumber \\ && \hspace{5 mm}(J-H)<(5/3)(H-K)-1/3 . \label{eq.cut2} \end{eqnarray}](/articles/aa/full_html/2012/03/aa17874-11/aa17874-11-eq60.png) (2)The interstellar extinction vector corresponds to (J − H)/(H − K) ~ 5/3, therefore the last selection cut is identical for each Galactic latitude range. These three selection cuts are represented in Fig. 6. Only 2% of the remaining objects passed this criterion, and only two RCB stars, Y Mus and XX Cam, were eliminated.
(2)The interstellar extinction vector corresponds to (J − H)/(H − K) ~ 5/3, therefore the last selection cut is identical for each Galactic latitude range. These three selection cuts are represented in Fig. 6. Only 2% of the remaining objects passed this criterion, and only two RCB stars, Y Mus and XX Cam, were eliminated. 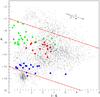
Fig. 5 Colour–magnitude diagram K vs. J − K. Black points represent the remaining objects after applying selection criterion 6. The large dots correspond to RCB or HdC stars with the same colour coding as in Fig. 4. Extinction due to amorphous carbon grains (C) and interstellar dust (I) is represented with two vectors. The red lines represent selection cut number 7.
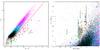
Fig. 6 In both figures, all points represent objects that have passed the first 4 selection criteria. They are colour coded to represent their Galactic latitude b and therefore the interstellar reddening that affects their near-infrared J, H, and K magnitudes: black points correspond to objects with b > 2 deg, light blue ones are objects with
 deg (corresponding to average extinction of ⟨AV⟩ ~ 2 mag), and purple ones are objects located close to the Galactic plane, with b < 1 deg (with ⟨AV⟩ ~ 5 mag). The larger dots and stars represent known RCB and HdC stars with identical colour coding to Fig. 4. The dashed and solid red lines represent the selection cuts 5 (left) and 6 (right) used in the analysis. Left: J − H vs. H − K diagram. Right: [4.6] − [12] vs. [12] − [22] diagram. The black vertical lines correspond to the brightness correction that needs to be applied to bright RCBs in the [4.6] band due to the photometric bias (see Sect. 2.2.1).
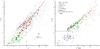
Fig. 7 Both diagrams represent J − K versus J − [12]. Left: the black dots represent the remaining objects after application of selection criterion 7. The red line represents the selection cut number 8. The larger dots correspond to RCB or HdC stars that have also passed the first 7 criteria, with the same colour coding as in Fig. 4. The vector represents the interstellar reddening. The black curve corresponds to the combination of blackbodies consisting of a 6000 K star and a 700 K shell made of amorphous dust grains, in various proportions ranging from all “star” to all “shell”. Right: the symbols represent the classification found in SIMBAD. About 15% of the objects selected with the first seven criteria have an entry in the SIMBAD database with a matching radius of 5 arcsec. The dashed line represents the selection cut number 8.
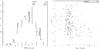
Fig. 8 Left: distribution of the I magnitude for 711 of 1602 objects selected by the analysis. Only 711 objects have a valid I band magnitude in the DENIS and/or USNO-B1 catalogues. The dotted lines represent the same distribution for known RCB stars. Right: IDENIS vs. IDENIS − IUSNO − B1 for the 285 of 1602 objects that have a valid I magnitude in both catalogues.
-
6.
The selection criterion 4 is readjusted to reject most of the AGB stars, and the applied cut is illustrated in Fig. 6:
![Mathematical equation: \begin{equation} [4.6]-[12] > 1.8([12]-[22]) + 0.03. \label{eq.cut3} \end{equation}](/articles/aa/full_html/2012/03/aa17874-11/aa17874-11-eq69.png) (3)As discussed in Sect. 2.2.1, the brightness of bright objects in [4.6] is overestimated. RCBs affected by this bias are indicated in Table 3, and the estimated corrections are represented in Fig. 6. After correction, one can see that none of the RCBs reached the upper limit set at 3.0 mag on [4.6] − [12] . The impact of the [4.6] bias on this selection criteria is therefore very limited. On the other hand, two out of the three RCBs that are eliminated by the present selection would have been selected if the bias did not exist. Because we can expect that many of the RCBs we are looking for are relatively bright in the [4.6] band, all three known RCBs rejected will nevertheless be counted in the detection efficiency estimation.
(3)As discussed in Sect. 2.2.1, the brightness of bright objects in [4.6] is overestimated. RCBs affected by this bias are indicated in Table 3, and the estimated corrections are represented in Fig. 6. After correction, one can see that none of the RCBs reached the upper limit set at 3.0 mag on [4.6] − [12] . The impact of the [4.6] bias on this selection criteria is therefore very limited. On the other hand, two out of the three RCBs that are eliminated by the present selection would have been selected if the bias did not exist. Because we can expect that many of the RCBs we are looking for are relatively bright in the [4.6] band, all three known RCBs rejected will nevertheless be counted in the detection efficiency estimation. -
7.
The present criterion target RCB brightness and therefore their distance modulus. A selection was applied to the colour–magnitude diagram K vs. J − K. The colour J − K of RCBs is due to three effects: the interstellar reddening, the warm circumstellar shell contribution to near-infrared fluxes and for some RCBs the reddening due to clouds made of carbon soot during an extinction event (at maximum Δ(J − K)cloud ~ 1.4 mag). The RCBs’ J − K colour is therefore not simple and the selection limits slope were chosen with care. They are illustrated in Fig. 5. The goal of this analysis is to create a catalogue enriched with RCB stars located within 50 kpc, therefore all RCBs discovered in the Large Magellanic Cloud (LMC) were represented in this diagram. (They all have an entry in the 2MASS catalogue.) They were used to estimate the lower end of the brightness cut. Only two, EROS2-LMC-RCB-2 & -3, out of 19 LMC RCBs were not selected.
 (4)On the bright end of the selection, two of the brightest known RCBs, R CrB and V854 Cen, are located close to the upper limit. Very bright RCBs are not the primary target of this analysis as very few are expected, therefore only a small margin was used in this choice.
 -
8.
As mentioned earlier, the RCB’s warm circumstellar shell can contribute significantly to the near-infrared fluxes. This effect can be understood in a J − K vs. J − [12] colour–colour diagram. Effectively, a correlation between both colours is observed for RCBs (see Fig. 7). When the RCB shell becomes brighter, its flux contribution to the K band increases and as a consequence J − K becomes redder. This effect is in combination with the interstellar reddening effect. Interestingly, it is also relatively simple in that diagram to reject the remaining main contaminants, the Mira type stars. Indeed, they are located in an isolated area of the diagram. The applied cuts were designed to optimise the rejection of Miras without affecting too much the RCB detection efficiency. The second selection follows the interstellar reddening vector:
![Mathematical equation: \begin{eqnarray} &&J-K\leqslant2.25 \hspace{2 mm} \mathrm{if}\hspace{2 mm} (J-[12])<6 \\[2mm] &&J-K\leqslant0.61 (J-[12])-1.43 \hspace{2 mm}\mathrm{if}\hspace{2 mm} (J-[12])\geqslant6. \label{eq.cut5} \end{eqnarray}](/articles/aa/full_html/2012/03/aa17874-11/aa17874-11-eq72.png) \arraycolsep1.75ptOnly two known RCB stars, out of the 42 that passed all the precedent criteria, were rejected by the present selection. They are EROS2-RCB-CG-12 and MACHO-308-38099.66. It is interesting to note that the former one has a light curve that presents large oscillations and may therefore be a Mira type star, instead of an RCB (see Tisserand et al. 2008, Fig. 9).
\arraycolsep1.75ptOnly two known RCB stars, out of the 42 that passed all the precedent criteria, were rejected by the present selection. They are EROS2-RCB-CG-12 and MACHO-308-38099.66. It is interesting to note that the former one has a light curve that presents large oscillations and may therefore be a Mira type star, instead of an RCB (see Tisserand et al. 2008, Fig. 9).
Number of selected objects after each selection criterion.
4. Discussion
1602 objects have passed the pragmatic selection criteria just listed. Of the 52 already known RCBs that are located inside the sky area covered by the WISE survey preliminary data release and used as reference, 41 have passed all eight criteria, which corresponds to a detection efficiency of about 77%. For the detection efficiency calculation, it would have been preferable to use a Monte-Carlo simulation of RCBs with a range of photosphere and shell temperatures, but our knowledge of the distribution of these last parameters is very limited. It is worth noting that the RCB sample used as reference is biased toward bright RCBs so has a negative impact on the detection efficiency (see criteria 2 and 6). Bright RCBs are not the primary target of this analysis because very few of them, if any, are expected not to have been discovered yet. At the other end, the selection is biased against RCB stars with faint shells and RCB stars in a crowded environment (see criteria 1 and 5). In the last case, a detection algorithm correction in a future WISE data release may resolve the issue.
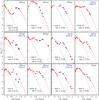 |
Fig. 9 Spectral energy distributions of known bright Galactic RCB stars, normalised to flux in V. Red dots represent fluxes in the optical (B, V, R, and I) and the near-infrared (J, H, and K) obtained from AAVSO and the ASAS, DENIS, and 2MASS surveys. The blue and black dots represent mid-infrared fluxes from the WISE and AKARI surveys, respectively. The red line is the best fit found with DUSTY models (see text for more details); the related effective temperatures found (~10% level accuracy) are listed in the bottom left corner in the following order, from top to bottom: photosphere, first and second circumstellar shells. If the photosphere’s effective temperature is between square brackets, its value was fixed during the fit and corresponds to the photosphere effective temperature determined by Asplund et al. (2000), indicated below the name for 17 RCB stars. The values in brackets on the right side of the shell temperatures correspond to the visual optical depth found. The broken black line represents a simple blackbody function with the photosphere temperature. |
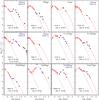 |
Fig. 10 Spectral energy distributions of known bright Galactic RCB stars, normalised to flux in V. Same caption as Fig. 9. |
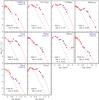 |
Fig. 11 Spectral energy distributions of known bright Galactic RCB stars, normalised to flux in V. Same caption as Fig. 9. |
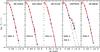 |
Fig. 12 Spectral energy distributions of the 5 HdC stars known, normalised to flux in V. Red dots represent fluxes in the optical and the near-infrared obtained from AAVSO and the ASAS, DENIS and 2MASS surveys. The blue and black dots represent the mid-infrared fluxes from the WISE and AKARI surveys respectively. The red line is simply a spline function that connects the different fluxes. The broken black line represents a simple blackbody function with the temperature of the photosphere. In the case of HD175893, the dotted line represents the sum of two blackbodies, the photosphere and the shell. The black bodies’ effective temperatures for the photosphere (top) and the circumstellar shell (bottom) are listed in the bottom left corner. |
About 70% of the objects selected are located towards the Galactic bulge (see Fig. 1), at ±5 deg from the Galactic plane, and 85 (~5%) are located in the Large Magellanic Cloud, whose sky area has been only partially covered in WISE-PDR1.
The final catalogue was cross-matched with the DENIS and USNO-B112 catalogues, using a strict matching radius of 1 arcsec. Only 895 objects have an entry in the DENIS catalogue and 538 in the USNO-B1 one. DENIS did a survey of all the southern sky in I, J, and K bands, while USNO-B1 covers the entire sky in B, R, and I (2 epochs in B and R). Overall, using both catalogues, 711 objects have a valid I band magnitude, but surprisingly, only 285 have a valid entry in both catalogues. The I band magnitude distribution is presented in Fig. 8, as is the difference in magnitude between IDENIS and IUSNO − B1. With an absolute magnitude MI ~ −5 mag (Tisserand et al. 2009), an RCB star located at 50 kpc would have an apparent magnitude of I ~ 13.5 mag during a maximum brightness phase, which is brighter than the median (~14) of the distribution presented. The IDENIS and IUSNO − B1 magnitudes should be used to prioritise follow-ups. During some large photometric decline phases, some RCB stars could have been observed at fainter magnitude up to the magnitude limit (IDENIS,lim ~ 18.5 mag, or ~17 mag in crowded area): Fig. 8, on the right, shows that some of the selected objects have known large photometric variation up to 6 mags between both survey epochs.
The fact that only ~33% of the 1602 selected objects have an entry in the USNO-B1 catalogue indicates that most of those 1602 objects are faint, with a visual magnitude lower than 20. The interstellar extinction certainly has an influence on this low percentage, but it is not the absolute answer as half of these faint objects are located at two degrees or more from the galactic plane (|b| > 2 deg) where extinction AV is lower than ~2 mag. Under such extinction, an RCB star at maximum brightness and located within 50 kpc is still detectable, therefore these objects could intrinsically be optically faint and a contaminant in our research. However, they may also be (or a fraction of them) RCB stars that are heavily enshrouded in dust. If one does not expect that during the lifetime of an RCB star, a long phase of high dust production rate exists, then these objects should be considered as weak candidates. However, it is worth noting that the RCB star V854 Cen remained 7 mag below its maximum brightness for about 50 years (Grasdalen et al. 1986). I note also that a third of the 1602 selected objects have a WISE [4.6] magnitude brighter than 5 mag. The [4.6] brightness of these objects is therefore overestimated (see Sect. 2.2.1).
The selected list of objects was also cross-matched with the SIMBAD database with a matching radius of 5 arcsec. The right-hand side of Fig. 7 summarises the situation. 569 of the 1602 objects were found to have a classification, but 307 of those are classified only as IRAS sources and 30 others only as stars, without further information. However, of the 232 remaining, 62 stars are classified interestingly as carbon stars. They are stars that will need to be looked at closely in future photometric and spectroscopic follow-ups. Also, 46 objects are classified as variable, pulsating, semi-regular or RV Tauri stars. RCB stars are known to present periodic pulsating variability with an amplitude of ~0.5 mag; therefore, these stars will be interesting to monitor and study more closely. Even though many of the objects classified as Mira or OH/IR stars were rejected using selection criterion 8, 49 remained in the final sample. Most of them are certainly genuine, particularly at J − [12] > 9 mag, but it is also worth indicating that a few Miras are located in the J − K vs. J − [12] diagram at a position not expected for these type of object and can therefore be suspected of misclassification. There are 14 such objects with J − K < 3 mag. A visual inspection of the ASAS-3 lightcurves of these objects have shown that two of them present Mira-type photometric variation (Id 45 and 1197), two remain stable (Id 623 and 1409), but more interestingly three present clear photometric variations typical of RCB stars: Id 683, 793, and 917, which are named V653 Sco, IO Nor, and V581 CrA, respectively. The remaining seven objects have not been catalogued and followed-up by the ASAS-3 survey. I note that 26 objects are classified as galaxies or clusters of galaxies. These objects are faint, with K > 12 mag, indicating that galaxies could therefore be a major contaminant below this limit (270 on the 1602 selected objects are fainter than K > 12). Finally, 17 objects are classified as emission stars. These objects could be contaminants in our search for RCB stars, but it is interesting to note that hot RCBs, such as DY Cen, MV Sgr and V348 Sgr, also present an emission type spectrum (De Marco et al. 2002). Furthermore, during faint phases, RCBs spectrum generally presents many emission lines (Clayton 1996).
No reference sample of stars exists to estimate the fraction of RCB stars that are potentially in the catalogue. Furthermore, little is known about the different phases during the lifetime of an RCB star, and as mentioned earlier, a significant fraction of RCB stars could be heavily dust-enshrouded and therefore faint. However, one can use the objects that have been classified in the SIMBAD database to obtain a crude estimate of this fraction: ~15% of these objects are RCBs, which would then corresponds to about 240 new RCBs.
The RCB enriched catalogue is available from: http://www.mso.anu.edu.au/~tisseran/RCB/ and will also be available through the VizieR13 catalogue service. A short version of it is given as an example in Table 5. The equatorial and Galactic coordinates, as well as all four WISE, three 2MASS, three DENIS magnitudes, and their 1-sigma errors are listed for all 1602 objects selected. The five USNO-B1 magnitudes are also listed, but not the individual measurement error since they were not delivered in the original catalogue (see Monet et al. 2003, for an estimate of the photometric accuracy). If one magnitude was not available, its value was replaced by the number –99. Also, if more than one epoch were available in the DENIS or USNO-B1 catalogues for one particular object, only the epoch related to the brightest magnitudes was kept. The last column of the catalogue gives the SIMBAD classification14, as of July 2011, found using a 5 arcsec matching radius. An underscore character was given to the objects that had no classification in SIMBAD.
5. Conclusion
Using both the 2MASS and WISE preliminary data release catalogues, I have created a catalogue enriched with Galactic RCB stars that lie within a distance ~50 kpc. The selection criteria for selecting a subsample of objects with mid- and near- infrared properties similar to RCBs were mostly based on colour–colour diagrams. This catalogue contains only 1602 entries, with ~70% of the selected objects being located toward the Galactic bulge. A reference sample of 52 known RCB stars was used to monitor the detection efficiency of the selection. About 77% of them were recovered. Such high detection efficiency gives strong support to the RCB content of this catalogue. Each selected object will now need to be followed-up spectroscopically to discover its true nature. It is encouraging to observe that three of these 1602 selected objects, Id 683, 793, and 917 (resp. V653 Sco, IO Nor, and V581 CrA) were found to present ASAS-3 lightcurves with the brightness variations typical of RCB stars, but are misclassified in the SIMBAD database as Miras. Also, Kijbunchoo et al. (2011) has recently discovered that NSV 11154 is a new RCB stars. This star is listed in the catalogue under the Id 1240.
An analysis of the spectral energy distribution of known RCB stars confirms that RCBs effective temperatures range mostly between 4000 and 8000 K (spectral type K to F), with a few exceptions being hotter than 10 000 K. The RCB shell effective temperatures range between 400 and 1000 K with a typical temperature of ~700 K and a visual optical depth of τV ~ 0.4. HD 175893 is the only HdC star (spectral type G to F) that presents an infrared excess indicating the existence of a warm circumstellar shell. Furthermore, HD 175893 has passed all the selection criteria to create the RCB enriched catalogue, therefore HD 175893 should be considered to be an RCB star in a phase of low activity in terms of dust production.
Online material
WISE magnitudes of catalogued RCB, HdC and DY Per stars.
AKARI fluxes (mJy) of catalogued bright Galactic RCB stars and DY Persei.
First 10 rows of the published catalogue.
LSST: Large Synoptic Survey Telescope (Ivezic et al. 2008).
Spitzer is a space telescope launched in 2003 to do infrared imaging and spectroscopy (Werner et al. 2004).
GLIMPSE: Galactic Legacy Infrared Mid-Plane Survey Extraordinaire (Churchwell et al. 2009).
OGLE-III: Optical Gravitational Lensing Experiment (Udalski 2003).
American Association of Variable Star Observers, URL: http://www.aavso.org/vstar/vsots/0100.shtml
All Sky Automated Survey (Pojmanski 1997), URL: http://www.astrouw.edu.pl/asas/?page=main
DENIS: The Deep Near-Infrared Southern Sky Survey (Epchtein et al. 1994).
2MASS: Two Micron All Sky Survey (Skrutskie et al. 2006).
COBE: COsmic Background Explorer; DIRBE: Diffuse Infrared Background Experiment.
Effectively, for 5 of the 7 RCBs, the fitted photosphere’s effective temperatures were higher than 12 000 K, when the Schlegel et al. (1998) map was used to correct for interstellar reddening. This is about 5000 K higher than expected.
Carbon molecules CN and C2 create strong absorption features in the optical and the near-infrared continuum.
USNO: United States Naval Observatory (Monet et al. 2003).
URL of the object types in SIMBAD (classification version: 12-Jul.2011): http://simbad.u-strasbg.fr/simbad/sim-display?data=otypes
Acknowledgments
I personally thank Tony Martin-Jones, Julia Jane Karrer, and Mike Bessell for their careful readings and comments. This publication makes use of data products from the Wide-field Infrared Survey Explorer, which is a joint project of the University of California, Los Angeles, and the Jet Propulsion Laboratory/California Institute of Technology, funded by the National Aeronautics and Space Administration. This publication also makes use of data products from the Two Micron All Sky Survey, which is a joint project of the University of Massachusetts and the Infrared Processing and Analysis Centre, California Institute of Technology, funded by the National Aeronautics and Space Administration and the National Science Foundation. The DENIS data have also been used. DENIS is the result of a joint effort involving human and financial contributions of several Institutes mostly located in Europe. It has been supported financially mainly by the French Institut National des Sciences de l’Univers, CNRS, and French Education Ministry, the European Southern Observatory, the State of Baden-Wuerttemberg, and the European Commission under networks of the SCIENCE and Human Capital and Mobility programs, the Landessternwarte, Heidelberg, and the Institut d’Astrophysique de Paris. This article is also based on observations with AKARI, a JAXA project with the participation of ESA. Finally, I thank the AAVSO association, which provides variable star light curves with observations contributed by observers worldwide, and to the ASAS south survey that provides light curves of bright stars from the entire southern sky.
References
- Alcock, C., Allsman, R. A., Alves, D. R., et al. 2001, ApJ, 554, 298 [NASA ADS] [CrossRef] [Google Scholar]
- Aníbal García-Hernández, D., Kameswara Rao, N., & Lambert, D. L. 2011, ApJ, 739, 37 [NASA ADS] [CrossRef] [Google Scholar]
- Asplund, M., Gustafsson, B., Lambert, D. L., & Rao, N. K. 2000, A&A, 353, 287 [NASA ADS] [Google Scholar]
- Churchwell, E., Babler, B. L., Meade, M. R., et al. 2009, PASP, 121, 213 [NASA ADS] [CrossRef] [Google Scholar]
- Clayton, G. C. 1996, PASP, 108, 225 [NASA ADS] [CrossRef] [Google Scholar]
- Clayton, G. C., Kerber, F., Gordon, K. D., et al. 1999, ApJ, 517, L143 [NASA ADS] [CrossRef] [Google Scholar]
- Clayton, G. C., Geballe, T. R., Herwig, F., Fryer, C., & Asplund, M. 2007, ApJ, 662, 1220 [NASA ADS] [CrossRef] [Google Scholar]
- Cottrell, P. L., & Lawson, W. A. 1998, PASA, 15, 179 [Google Scholar]
- Cutri, R. M., Wright, E. L., Conrow, T., et al. 2011, Explanatory Supplement to the WISE Preliminary Data Release Products, Tech. Rep., http://wise2.ipac.caltech.edu/docs/release/prelim/expsup/wise_prelrel_toc.html [Google Scholar]
- De Marco, O., Clayton, G. C., Herwig, F., et al. 2002, AJ, 123, 3387 [NASA ADS] [CrossRef] [Google Scholar]
- Diehl, S., Fryer, C. L., Hungerford, A., et al. 2008, in 10th Symposium on Nuclei in the Cosmos (NIC X), 155 [Google Scholar]
- Epchtein, N., de Batz, B., Copet, E., et al. 1994, Ap&SS, 217, 3 [NASA ADS] [CrossRef] [Google Scholar]
- Feast, M. W., Carter, B. S., Roberts, G., Marang, F., & Catchpole, R. M. 1997, MNRAS, 285, 317 [NASA ADS] [CrossRef] [Google Scholar]
- Fryer, C. L., & Diehl, S. 2008, in Hydrogen-Deficient Stars, ed. A. Werner, & T. Rauch (San Francisco: ASP), ASP Conf. Ser., 391, 335 [Google Scholar]
- García-Hernández, D. A., Lambert, D. L., Kameswara Rao, N., Hinkle, K. H., & Eriksson, K. 2010, ApJ, 714, 144 [NASA ADS] [CrossRef] [Google Scholar]
- Grasdalen, G. L., Gehrz, R. D., Greenhouse, M., et al. 1986, IAU Circ., 4245, 1 [NASA ADS] [Google Scholar]
- Groenewegen, M. A. T. 1995, A&A, 293, 463 [NASA ADS] [Google Scholar]
- Iben, Jr., I., & Tutukov, A. V. 1985, ApJS, 58, 661 [NASA ADS] [CrossRef] [Google Scholar]
- Ivezic, Z., Axelrod, T., Brandt, W. N., et al. 2008, Serbian Astron. J., 176, 1 [NASA ADS] [CrossRef] [Google Scholar]
- Jeffery, C. S., Karakas, A. I., & Saio, H. 2011, MNRAS, 414, 3599 [NASA ADS] [CrossRef] [Google Scholar]
- Kijbunchoo, N., Clayton, G. C., Vieux, T. C., et al. 2011, PASP, 123, 1149 [NASA ADS] [CrossRef] [Google Scholar]
- Kraemer, K. E., Sloan, G. C., Wood, P. R., Price, S. D., & Egan, M. P. 2005, ApJ, 631, L147 [NASA ADS] [CrossRef] [Google Scholar]
- Lobel, A., Israelian, G., de Jager, C., et al. 1998, A&A, 330, 659 [NASA ADS] [Google Scholar]
- Mathis, J. S., Rumpl, W., & Nordsieck, K. H. 1977, ApJ, 217, 425 [NASA ADS] [CrossRef] [Google Scholar]
- Monet, D. G., Levine, S. E., Canzian, B., et al. 2003, AJ, 125, 984 [NASA ADS] [CrossRef] [Google Scholar]
- Murakami, H., Baba, H., Barthel, P., et al. 2007, PASJ, 59, 369 [Google Scholar]
- Nelemans, G., Yungelson, L. R., Portegies Zwart, S. F., & Verbunt, F. 2001, A&A, 365, 491 [NASA ADS] [CrossRef] [EDP Sciences] [Google Scholar]
- Nenkova, M., Ivezić, Ž., & Elitzur, M. 2000, in Thermal Emission Spectroscopy and Analysis of Dust, Disks, and Regoliths, ed. M. L. Sitko, A. L. Sprague, & D. K. Lynch (San Francisco: ASP), ASP Conf. Ser., 196, 77 [Google Scholar]
- Pandey, G., Lambert, D. L., & Rao, N. K. 2008, ApJ, 674, 1068 [NASA ADS] [CrossRef] [Google Scholar]
- Pei, Y. C. 1992, ApJ, 395, 130 [NASA ADS] [CrossRef] [Google Scholar]
- Pojmanski, G. 1997, Acta Astron., 47, 467 [NASA ADS] [Google Scholar]
- Ruiter, A. J., Belczynski, K., & Fryer, C. 2009, ApJ, 699, 2026 [NASA ADS] [CrossRef] [Google Scholar]
- Saio, H., & Jeffery, C. S. 2002, MNRAS, 333, 121 [NASA ADS] [CrossRef] [Google Scholar]
- Schlegel, D. J., Finkbeiner, D. P., & Davis, M. 1998, ApJ, 500, 525 [NASA ADS] [CrossRef] [Google Scholar]
- Skrutskie, M. F., Cutri, R. M., Stiening, R., et al. 2006, AJ, 131, 1163 [NASA ADS] [CrossRef] [Google Scholar]
- Tisserand, P., Marquette, J. B., Beaulieu, J. P., et al. 2004, A&A, 424, 245 [NASA ADS] [CrossRef] [EDP Sciences] [Google Scholar]
- Tisserand, P., Marquette, J. B., Wood, P. R., et al. 2008, A&A, 481, 673 [NASA ADS] [CrossRef] [EDP Sciences] [Google Scholar]
- Tisserand, P., Wood, P. R., Marquette, J. B., et al. 2009, A&A, 501, 985 [NASA ADS] [CrossRef] [EDP Sciences] [Google Scholar]
- Tisserand, P., Wyrzykowski, L., Wood, P. R., et al. 2011, A&A, 529, A118 [NASA ADS] [CrossRef] [EDP Sciences] [Google Scholar]
- Udalski, A. 2003, Acta Astron., 53, 291 [NASA ADS] [Google Scholar]
- Werner, M. W., Roellig, T. L., Low, F. J., et al. 2004, ApJS, 154, 1 [Google Scholar]
- Wright, E. L., Eisenhardt, P. R. M., Mainzer, A. K., et al. 2010, AJ, 140, 1868 [NASA ADS] [CrossRef] [Google Scholar]
- Zaniewski, A., Clayton, G. C., Welch, D. L., et al. 2005, AJ, 130, 2293 [NASA ADS] [CrossRef] [Google Scholar]
All Tables
The optical and near-infrared maximum apparent magnitudes determined from the AAVSO, ASAS, DENIS and 2MASS datasets.
All Figures
|
Fig. 1 Representation of the Galactic map, b vs. l, with all objects selected by the analysis (black dots) and the known Galactic RCB stars (larger red dots). The black lines represent the approximate limits of the sky area released in the WISE-PDR1 catalogue. |
| In the text | |
|
Fig. 2 From left to right, distribution of the fitted effective temperature of the RCBs’ photosphere and shell, and the shell optical depth. |
| In the text | |
|
Fig. 3 Diagram representing the measured WISE [4.6] magnitudes of known RCB stars versus the difference in magnitude between the WISE measurement and the best SED model found. For objects brighter than [4.6] ~ 5.0, the [4.6] WISE brightness is overestimated, reaching ~0.9 mag at [4.6] ~ 3.0 mag. The red line is a representation of this bias. |
| In the text | |
|
Fig. 4 Diagram of [4.6] − [12] vs. [12] − [22] . The black dots represent 3% of all objects that have been catalogued in all the WISE and 2MASS bands. Larger green dots represent bright known Galactic RCB stars (the two outliers are discussed in the text); red dots correspond to the Galactic RCBs found toward the bulge (with a majority located inside the bulge) (Tisserand et al. 2008; Zaniewski et al. 2005); blue dots are 4 RCB stars located in the south-eastern area of the Large Magellanic Cloud. The purple stars correspond to the 5 known HdC stars and the circles to DYPer type stars with a colour coding identical to RCB stars. The red lines represent the selection cuts used in the analysis. |
| In the text | |
|
Fig. 5 Colour–magnitude diagram K vs. J − K. Black points represent the remaining objects after applying selection criterion 6. The large dots correspond to RCB or HdC stars with the same colour coding as in Fig. 4. Extinction due to amorphous carbon grains (C) and interstellar dust (I) is represented with two vectors. The red lines represent selection cut number 7. |
| In the text | |
|
Fig. 6 In both figures, all points represent objects that have passed the first 4 selection criteria. They are colour coded to represent their Galactic latitude b and therefore the interstellar reddening that affects their near-infrared J, H, and K magnitudes: black points correspond to objects with b > 2 deg, light blue ones are objects with |
| In the text | |
|
Fig. 7 Both diagrams represent J − K versus J − [12]. Left: the black dots represent the remaining objects after application of selection criterion 7. The red line represents the selection cut number 8. The larger dots correspond to RCB or HdC stars that have also passed the first 7 criteria, with the same colour coding as in Fig. 4. The vector represents the interstellar reddening. The black curve corresponds to the combination of blackbodies consisting of a 6000 K star and a 700 K shell made of amorphous dust grains, in various proportions ranging from all “star” to all “shell”. Right: the symbols represent the classification found in SIMBAD. About 15% of the objects selected with the first seven criteria have an entry in the SIMBAD database with a matching radius of 5 arcsec. The dashed line represents the selection cut number 8. |
| In the text | |
|
Fig. 8 Left: distribution of the I magnitude for 711 of 1602 objects selected by the analysis. Only 711 objects have a valid I band magnitude in the DENIS and/or USNO-B1 catalogues. The dotted lines represent the same distribution for known RCB stars. Right: IDENIS vs. IDENIS − IUSNO − B1 for the 285 of 1602 objects that have a valid I magnitude in both catalogues. |
| In the text | |
|
Fig. 9 Spectral energy distributions of known bright Galactic RCB stars, normalised to flux in V. Red dots represent fluxes in the optical (B, V, R, and I) and the near-infrared (J, H, and K) obtained from AAVSO and the ASAS, DENIS, and 2MASS surveys. The blue and black dots represent mid-infrared fluxes from the WISE and AKARI surveys, respectively. The red line is the best fit found with DUSTY models (see text for more details); the related effective temperatures found (~10% level accuracy) are listed in the bottom left corner in the following order, from top to bottom: photosphere, first and second circumstellar shells. If the photosphere’s effective temperature is between square brackets, its value was fixed during the fit and corresponds to the photosphere effective temperature determined by Asplund et al. (2000), indicated below the name for 17 RCB stars. The values in brackets on the right side of the shell temperatures correspond to the visual optical depth found. The broken black line represents a simple blackbody function with the photosphere temperature. |
| In the text | |
|
Fig. 10 Spectral energy distributions of known bright Galactic RCB stars, normalised to flux in V. Same caption as Fig. 9. |
| In the text | |
|
Fig. 11 Spectral energy distributions of known bright Galactic RCB stars, normalised to flux in V. Same caption as Fig. 9. |
| In the text | |
|
Fig. 12 Spectral energy distributions of the 5 HdC stars known, normalised to flux in V. Red dots represent fluxes in the optical and the near-infrared obtained from AAVSO and the ASAS, DENIS and 2MASS surveys. The blue and black dots represent the mid-infrared fluxes from the WISE and AKARI surveys respectively. The red line is simply a spline function that connects the different fluxes. The broken black line represents a simple blackbody function with the temperature of the photosphere. In the case of HD175893, the dotted line represents the sum of two blackbodies, the photosphere and the shell. The black bodies’ effective temperatures for the photosphere (top) and the circumstellar shell (bottom) are listed in the bottom left corner. |
| In the text | |
Current usage metrics show cumulative count of Article Views (full-text article views including HTML views, PDF and ePub downloads, according to the available data) and Abstracts Views on Vision4Press platform.
Data correspond to usage on the plateform after 2015. The current usage metrics is available 48-96 hours after online publication and is updated daily on week days.
Initial download of the metrics may take a while.