Fig. 9
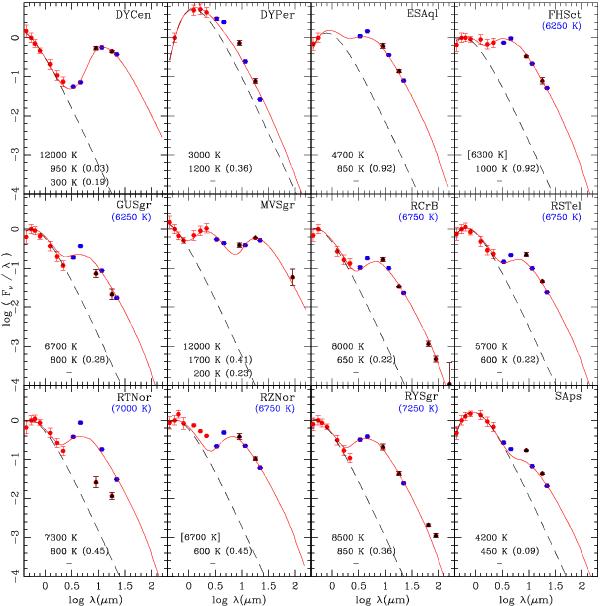
Spectral energy distributions of known bright Galactic RCB stars, normalised to flux in V. Red dots represent fluxes in the optical (B, V, R, and I) and the near-infrared (J, H, and K) obtained from AAVSO and the ASAS, DENIS, and 2MASS surveys. The blue and black dots represent mid-infrared fluxes from the WISE and AKARI surveys, respectively. The red line is the best fit found with DUSTY models (see text for more details); the related effective temperatures found (~10% level accuracy) are listed in the bottom left corner in the following order, from top to bottom: photosphere, first and second circumstellar shells. If the photosphere’s effective temperature is between square brackets, its value was fixed during the fit and corresponds to the photosphere effective temperature determined by Asplund et al. (2000), indicated below the name for 17 RCB stars. The values in brackets on the right side of the shell temperatures correspond to the visual optical depth found. The broken black line represents a simple blackbody function with the photosphere temperature.
Current usage metrics show cumulative count of Article Views (full-text article views including HTML views, PDF and ePub downloads, according to the available data) and Abstracts Views on Vision4Press platform.
Data correspond to usage on the plateform after 2015. The current usage metrics is available 48-96 hours after online publication and is updated daily on week days.
Initial download of the metrics may take a while.