Fig. 5
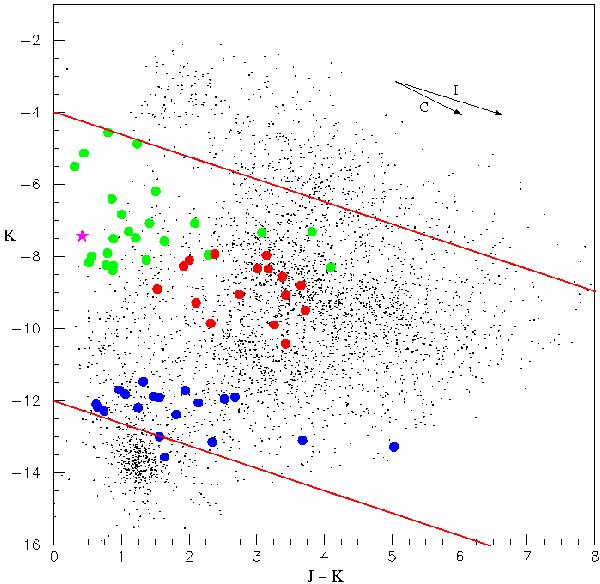
Colour–magnitude diagram K vs. J − K. Black points represent the remaining objects after applying selection criterion 6. The large dots correspond to RCB or HdC stars with the same colour coding as in Fig. 4. Extinction due to amorphous carbon grains (C) and interstellar dust (I) is represented with two vectors. The red lines represent selection cut number 7.
Current usage metrics show cumulative count of Article Views (full-text article views including HTML views, PDF and ePub downloads, according to the available data) and Abstracts Views on Vision4Press platform.
Data correspond to usage on the plateform after 2015. The current usage metrics is available 48-96 hours after online publication and is updated daily on week days.
Initial download of the metrics may take a while.