Fig. 12
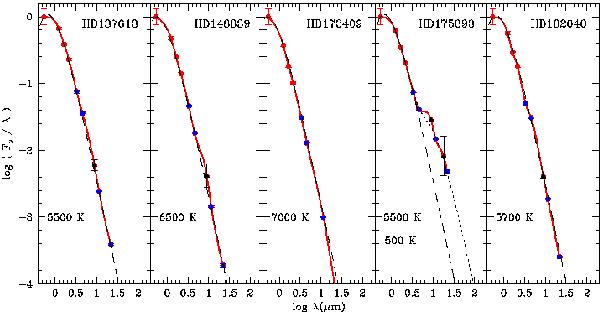
Spectral energy distributions of the 5 HdC stars known, normalised to flux in V. Red dots represent fluxes in the optical and the near-infrared obtained from AAVSO and the ASAS, DENIS and 2MASS surveys. The blue and black dots represent the mid-infrared fluxes from the WISE and AKARI surveys respectively. The red line is simply a spline function that connects the different fluxes. The broken black line represents a simple blackbody function with the temperature of the photosphere. In the case of HD175893, the dotted line represents the sum of two blackbodies, the photosphere and the shell. The black bodies’ effective temperatures for the photosphere (top) and the circumstellar shell (bottom) are listed in the bottom left corner.
Current usage metrics show cumulative count of Article Views (full-text article views including HTML views, PDF and ePub downloads, according to the available data) and Abstracts Views on Vision4Press platform.
Data correspond to usage on the plateform after 2015. The current usage metrics is available 48-96 hours after online publication and is updated daily on week days.
Initial download of the metrics may take a while.