Fig. 6
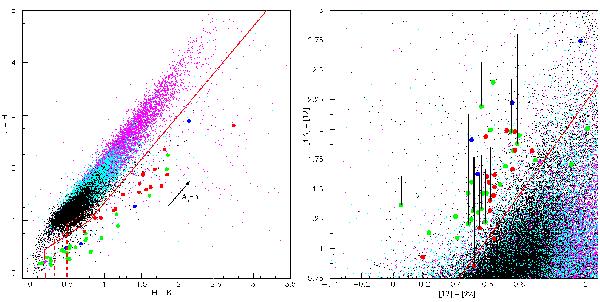
In both figures, all points represent objects that have passed the first 4 selection criteria. They are colour coded to represent their Galactic latitude b and therefore the interstellar reddening that affects their near-infrared J, H, and K magnitudes: black points correspond to objects with b > 2 deg, light blue ones are objects with  deg (corresponding to average extinction of ⟨AV⟩ ~ 2 mag), and purple ones are objects located close to the Galactic plane, with b < 1 deg (with ⟨AV⟩ ~ 5 mag). The larger dots and stars represent known RCB and HdC stars with identical colour coding to Fig. 4. The dashed and solid red lines represent the selection cuts 5 (left) and 6 (right) used in the analysis. Left: J − H vs. H − K diagram. Right: [4.6] − [12] vs. [12] − [22] diagram. The black vertical lines correspond to the brightness correction that needs to be applied to bright RCBs in the [4.6] band due to the photometric bias (see Sect. 2.2.1).
Current usage metrics show cumulative count of Article Views (full-text article views including HTML views, PDF and ePub downloads, according to the available data) and Abstracts Views on Vision4Press platform.
Data correspond to usage on the plateform after 2015. The current usage metrics is available 48-96 hours after online publication and is updated daily on week days.
Initial download of the metrics may take a while.