Fig. 7
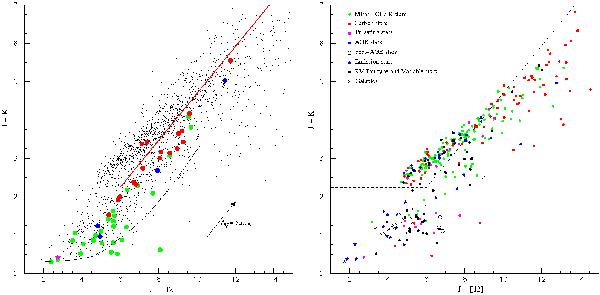
Both diagrams represent J − K versus J − [12]. Left: the black dots represent the remaining objects after application of selection criterion 7. The red line represents the selection cut number 8. The larger dots correspond to RCB or HdC stars that have also passed the first 7 criteria, with the same colour coding as in Fig. 4. The vector represents the interstellar reddening. The black curve corresponds to the combination of blackbodies consisting of a 6000 K star and a 700 K shell made of amorphous dust grains, in various proportions ranging from all “star” to all “shell”. Right: the symbols represent the classification found in SIMBAD. About 15% of the objects selected with the first seven criteria have an entry in the SIMBAD database with a matching radius of 5 arcsec. The dashed line represents the selection cut number 8.
Current usage metrics show cumulative count of Article Views (full-text article views including HTML views, PDF and ePub downloads, according to the available data) and Abstracts Views on Vision4Press platform.
Data correspond to usage on the plateform after 2015. The current usage metrics is available 48-96 hours after online publication and is updated daily on week days.
Initial download of the metrics may take a while.