| Issue |
A&A
Volume 537, January 2012
|
|
|---|---|---|
| Article Number | A62 | |
| Number of page(s) | 19 | |
| Section | The Sun | |
| DOI | https://doi.org/10.1051/0004-6361/201116956 | |
| Published online | 10 January 2012 | |
Magnetic flux emergence: a precursor of solar plasma expulsion
School of Mathematics and Statistics, University of St.
Andrews,
North Haugh, St. Andrews,
Fife
KY16 9SS,
UK
e-mail: This email address is being protected from spambots. You need JavaScript enabled to view it.
; This email address is being protected from spambots. You need JavaScript enabled to view it.
Received: 24 March 2011
Accepted: 6 November 2011
Abstract
Aims. We model the emergence of magnetized plasma from the top of the convection zone to the lower corona. We investigate the eruption of coronal flux ropes above emerging flux regions.
Methods. We performed three-dimensional numerical experiments in which the time-dependent and resistive equations of MHD are solved self-consistently, using the Lare3D code.
Results. A subphotospheric magnetic flux tube rises from the convectively unstable layer into the solar surface, followed by the formation and eruption of a new flux rope into the corona. Firstly, we examined the case where the corona is field-free. The expansion of the emerging field forms an envelope sheath that surrounds the newly formed flux rope. The erupting ropes are confined by the envelope field. The eruptions are driven by the gradient of the gas pressure and the tension of fieldlines that reconnect within the emerging flux region. The amount of the initial twist of the emerging field and the dense plasma that is lifted up, determine the height-time profile of the erupting ropes. Secondly, we examined the case of emergence into a pre-existing magnetic field in the upper solar atmosphere. A variety of different ambient field configurations was used in the experiments. External reconnection between the emerging and the pre-existing field may result in the removal of sufficient flux from the interacting fields and the full ejection of the flux ropes.
Conclusions. The results indicate that the relative contact angle of the interacting flux systems and their field strengths are crucial parameters that ultimately affect the evolution of the eruption of the rope into the higher solar atmosphere. One important result is that for any contact angle that favors reconnection, ejective eruptions occur earlier when the ambient field is relatively strong. In many cases, the erupting plasma adopts an S-like configuration. The sigmoidal structure accelerates during the fast eruption of the rope. The acceleration is enhanced by the external and internal reconnection of fieldlines during the rising motion of the rope. A key result is that in the reconnection-favored cases, the flux ropes experience ejective eruptions when the envelope flux is reduced (owing to removal by external reconnection) below that of the erupting flux rope. If the envelope flux stays higher than the erupting flux, the magnetic flux rope remains confined by the envelope field.
Key words: Sun: corona / magnetohydrodynamics (MHD) / Sun: magnetic topology
© ESO, 2012
1. Introduction
The emergence of magnetic flux (EMF) from the interior of the Sun is commonly associated with many dynamic phenomena that occur at various atmospheric heights. At the surface of the Sun, EMF is usually followed by the gradual build up of active regions (ARs) (e.g. Liggett & Zirin 1985; Zwaan 1985). Apart from the formation of ARs, the dynamical emergence of new magnetic fields is often linked to the onset of solar flares, prominence eruptions, and coronal mass ejections (Archontis 2008; van Driel-Gesztelyi & Culhane 2009; Schrijver 2009). Observations have indicated that newly emerging flux can interact with a pre-existing structure and destabilize it, leading to its dynamical rising motion across the solar atmosphere (e.g. Feynman & Martin 1995; Wang & Sheeley 1999; Williams et al. 2005). On the other hand, an AR can create its own “eruptions”, aided and incited by the pre-existing coronal magnetic field (e.g. Moore et al. 2001; Démoulin et al. 2002; Canou & Amari 2010; Liu et al. 2010). By “eruption”, we mean the sudden release of magnetic tension or pressure that results in the expulsion of magnetized plasma. Our primary aim is to numerically investigate the nature of these coronal eruptions that originate from emerging flux regions.
The majority of flux emergence experiments use a twisted flux tube as initial configuration for the magnetic field in the solar interior. A key feature in these experiments is the formation of a new flux rope at photospheric/chromospheric heights (Magara & Longcope 2001; Manchester et al. 2004; Gibson & Fan 2006; Archontis & Hood 2008), consisting of weakly twisted magnetic field lines surrounding its axis (Archontis & Török 2008; Archontis & Hood 2010). The axis of the new flux rope is distinct from the axis of the original subphotospheric flux tube that initially emerges from the solar interior. The axis of the original emerging field usually remains trapped at a few pressure scale heights above the base of the photosphere. How does the new flux rope form? After the emergence at the photosphere, the field in the close vicinity of the original tube’s axis (i.e. close to the “axial” magnetic field) is commonly sheared and twisted in the shape of a sigmoid (e.g. Fan 2001; Magara & Longcope 2001; Manchester et al. 2004; Archontis et al. 2009) along the polarity inversion line (PIL) of the emerging region. As they expand into the corona, the sheared axial fieldlines adopt the overall configuration of a sheared arcade-like structure. The gradual arcade shearing in conjunction with low pressure-driven converging flows toward the PIL, lead to “tether-cutting” reconnection (Moore & Roumeliotis 1992) occur low above the PIL. The opposite polarity strands of the sheared fieldlines reconnect at a sigmoid-shaped vertical current sheet, which is formed above the original axis of the tube (Manchester et al. 2004; Gibson & Fan 2006; Archontis & Hood 2008). The reconnection of the sheared fieldlines results in the formation of a new flux rope that starts to erupt into the corona and in a sudden release of energy (Archontis et al. 2009) underneath it. This development is reminiscent of the arcade-to-rope transformation process, proposed by van Ballegooijen & Martens (1989) as a possible mechanism for prominence formation and eruption.
The new flux rope starts to emerge into the higher solar atmosphere, leaving behind a considerable portion of the axial magnetic flux. The evolution of the magnetic field after the break-up of the original flux tube into two parts could be considered as “partial-emergence” of the magnetic field (e.g. Manchester et al. 2004; Gibson & Fan 2006; MacTaggart & Hood 2009; Archontis & Török 2008). Indeed, the exact location of the internal reconnection with respect to the original axis of the emerging field determines whether all, some (i.e. partial emergence), or none of the axial magnetic field will finally emerge into the corona. Using a different initial condition, Hood et al. (2009) found that if the original subphotospheric field has a semi-toroidal tube configuration, it can emerge bodily into the higher atmosphere. Only fields with a high magnetic field strength (e.g. 12 kG, initially located a few Mm below the photosphere) manage to emerge as a whole. Weaker fields undergo a similar evolution as the horizontal flux tubes: their axis stay at low photospheric heights. We will here consider experiments that investigate the emergence of horizontal twisted flux tubes. Similar theoretical considerations have been invoked to explain a complete, partial or no eruption of a flux rope that supports prominence material (Gilbert et al. 2001). The precise site of reconnection (below, above, or within the flux rope) critically affects the general reconfiguration and evolution of the prominence.
The fieldlines that are heated through reconnection at the sigmoidal current sheets that underlie the erupting flux rope may correspond to the observed quiescent X-ray sigmoids often seen in regions that trigger large-scale coronal eruptions (e.g. Rust & Kumar 1996; Moore et al. 2001). Many of the afore-mentioned experiments of coronal flux ropes produced by flux emergence have been used to discuss potential applications to partially erupting filaments and X-ray sigmoids (e.g. Gibson & Fan 2006; Archontis et al. 2009). The formation of a coronal flux rope with a sigmoidal shape has also been reported in the simulations by Fan (2009). The rotational motions of the two opposite polarities of an emerged flux tube are found to twist up the inner field lines such as they change their orientation into an inverse configuration. As the twisting of the flux rope footpoints continues, the coronal flux rope rises with increasing velocity.
Previous numerical studies have revealed that the eruption of the new magnetic flux rope depends on the properties of the magnetic environment that it emerges into, such as the relative orientation and the field strength (Archontis & Török 2008; Archontis & Hood 2010). It has been found that if the external, ambient magnetic field declines with height at a sufficiently steep rate, the new flux rope will most likely experience an eruption (Fan 2010). The triggering of the eruption is consistent with the onset of the torus instability (Kliem & Török 2006). In a similar manner, Török & Kliem (2005) have shown that if the magnetic field decreases more rapidly with height above a coronal flux rope, an eruption of the flux rope is obtained.
In idealized experiments, where the ambient environment is non-magnetized, the original flux tube expands into the corona, developing an “envelope” magnetic sheath that outlines the outskirts of the expanding volume (see Fig. 2, left). In this case, the envelope field comprises “closed” bipolar fieldlines that connect the opposite polarity magnetic flux elements at the photosphere. The parametric studies by Archontis & Török (2008) and Archontis & Hood (2010) and the experiments presented in this paper indicate that when the new flux rope rises into a field-free corona, it ultimately remains bounded by the envelope magnetic field. In this case, the rising motion of the flux rope is considered as a “confined eruption”. Following the work by Svestka (1986), Machado et al. (1988) and Moore et al. (2001) for the explosion of a sheared-core bipole and its transformation to an erupting twisted flux tube, we use the terms “confined” and “ejective” to denote the two different classes of erupting ropes. More precisely, in the “confined eruption”, the erupting plasma is ultimately restricted within the corona, owing to the downward tension force that the closed envelope fieldlines exert on the upcoming field. In the other case, where the magnetic field emerges into a magnetized corona, the new flux rope may experience an “ejective eruption” during which effective reconnection (occurring above and underneath the flux rope) opens and reconfigures the initially closed envelope fieldlines. Now, the flux rope experiences a high speed expulsion into the high solar atmosphere (Archontis & Török 2008). The essential difference now to the confined eruption is that the simultaneous occurrence of external (i.e. above the rope) and internal (i.e. underneath the rope) reconnection results in a run-away situation (that has been reported also in observations, e.g. Huang et al. 2011) that assists the flux rope to accelerate and escape far out of the envelope field.
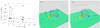 |
Fig. 1 Left: stratification of the background atmosphere (temperature (T), density (ρ), gas pressure (Pg)) and the initial magnetic field distribution ((Pm) is the magnetic pressure) at t = 0. Middle: the colored contours show the distribution of the vertical component of the magnetic field at the photosphere (yellow is positive and blue is negative). The blue and red field lines represent the outer and inner-most field lines of the emerging tube. The white field lines belong to the pre-existing field. The direction of the field lines is shown by the arrows. In this case, the two fields into contact are almost anti-parallel. Right: the same for an experiment where the field lines are at an angle of about Φ = 90. At this time of evolution, efficient reconnection has not started yet. |
The effect of external reconnection on the rising motion of coronal flux ropes has previously been investigated by Archontis & Hood (2008), using a different magnetic configuration as initial condition. More precisely, they reported on the dynamical rise of flux ropes following the new emergence of magnetic flux at the edges of a pre-existing ephemeral AR. It was found that before the interaction of the newly emerging field with the ambient field of the AR, the new flux ropes, which originate from the pre-existing AR, exhibit a slow-rise phase that leads to plasma confinement. After efficient external reconnection begins, the flux ropes undergo a secondary, fast-rise phase that could potentially lead to an ejective eruption of magnetized plasma. In a similar manner, 2D experiments (Chen & Shibata 2000) have used a kinematically driven model to show that reconnection-favored emerging flux underneath or at the side of a filament channel may destabilize the associated (flux-rope-like) structure and trigger a fast ejection. In 3D, Török et al. (2009) modeled the kinematic emergence of a twisted flux tube into a potential field arcade that overlies a weakly twisted coronal flux rope. They reported on the reconnection process between the emerging and the pre-existing magnetic fields, but they focused more on the formation of three-dimensional nullpoint topologies in the solar corona rather than on the triggering of an eruption.
We investigated the formation of a flux rope caused by the emergence and the conditions for the generation of an ejective or confined eruption through a parameter study. Section 2 presents the basic model for the initial cylindrical flux tube and the ambient coronal magnetic field. Section 3 re-examines the emergence into a field-free corona to emphasize the key ingredients involved in flux emergence and flux rope formation. In Sect. 4 a horizontal ambient coronal magnetic field is considered in a manner similar to previous work (Archontis et al. 2004; Galsgaard et al. 2005, 2007) and the interaction between emerging and ambient field is studied, but from the point of view of the eruption of the new flux rope. The effect of non-horizontal ambient fields on the flux rope eruption has not been discussed before and results are presented in Sect. 5. In the past, inclined ambient magnetic fields have been used by a number of authors as a model for emergence in coronal holes. For example, Yokoyama & Shibata (1995) have studied the formation of jets in 2D, formed by the reconnection of emerging flux and oblique pre-existing magnetic fields. This has been extended to 2.5D and 3D by Murray et al. (2009) and Moreno-Insertis et al. (2008), Gontikakis et al. (2009), Archontis et al. (2010), respectively, where the main emphasis was on the formation and properties of the outflow jets and the oscillatory reconnection that results in a waving of the jets. In Sect. 6 we show that the removal of the ambient flux via reconnection may drastically affect the rising motion of the coronal flux rope. Section 7 presents a discussion of the results and Sect. 8 the conclusions of this study.
2. Model
2.1. Equations
We solve the 3D time-dependent, resistive and compressible MHD equations in Cartesian geometry. The basic equations (here in dimensionless form) are 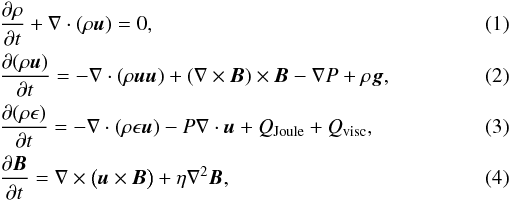 with specific energy density
  (5)In the above equations, B, ρ, P and u are the magnetic field vector, the density, the pressure and the velocity vector, respectively. The gravitational acceleration is
  , η is the resistivity and γ is the ratio of specific heats. The medium is assumed to be an inviscid, perfect gas with γ = 5/3. However, shock viscosity is used to deal with the formation of shocks. QJoule = ηj2 is the Ohmic heating and Qvisc is the heating through the shock viscosity.
Our units (with typical values in the solar photosphere) are as follows: density ρph = 3 × 10⁻⁷ g cm-3, pressure pph = 1.4 × 10⁵ erg cm-3, pressure scale height Hph = 170 km, with the derived units, magnetic field strength Bph = 1300 G, velocity Vph = 6.8 km s-1 and time tph = 25 s. For the explicit dimensionless resistivity we use a constant value of η = 10-3. The above equations were numerically solved by using the Lare3d code (Arber et al. 2001), which is a Lagrangian remap, shock capturing code that has been extensively used in experiments related to the process of flux emergence.
2.2. Initial conditions
 |
Fig. 2 Left: the colored contours show By at the vertical midplane (y = 0), in an experiment without ambient field. The arrows show the projection of the magnetic field vector onto the midplane. Also shown (with green lines) is the axis of the original flux tube, the internal reconnection site, the central part of the new flux rope and the outskirts of the envelope magnetic field. Right: height-time profiles of the rising rope for experiments with different twist: α = 0.2 (dotted line), α = 0.3 (dashed line), α = 0.4 (solid line), α = 0.5 (dotted-dashed line). |
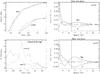 |
Fig. 3 Top-left: height-time profiles of the apex of the envelope fields (upper lines) and the center of the erupting ropes (lower lines): α = 0.3 (dashed line) and α = 0.4 (solid line). Bottom-left: the rising velocity, Vz, of the center of the rope: α = 0.3 (dashed line) and α = 0.4 (dotted line). Top-right: the spatial distribution of the vertical component of the forces for α = 0.3 and t = 43.3 min: magnetic pressure force (denoted by Pm), tension force (denoted by T), |
The initial conditions in our model consist of the background hydrostatic atmosphere, a horizontal twisted magnetic flux tube below the photosphere and a uniform magnetic field in the corona and transition region. We used the same ambient field as Archontis et al. (2005). The normal derivative of the field at the base of the transition region causes a very weak horizontal electric current.
Figure 1 (left panel) shows the initial distribution of the gas pressure (P), temperature (T), density (ρ) and magnetic pressure (Pm) as functions of height. The initial background atmosphere consists of four layers in hydrostatic equilibrium. The upper convection zone is represented by a superadiabatically stratified layer in the range (−1.7 Mm ≤ z < 3.4 Mm). An isothermal layer at 3.4 Mm ≤ z < 5.1 Mm represents the photosphere. The layer above the photosphere (5.1 Mm ≤ z ≤ 6.8 Mm is mimicking the chromosphere/transition region. The uppermost layer (6.8 Mm < z ≤ 25.5 Mm) is an isothermal layer that represents the corona.
For the initial subphotospheric magnetic field, we considered a horizontal and twisted magnetic flux tube, located 1.7 Mm below the photosphere. Initially, the magnetic flux tube is oriented along the positive y-axis. The axial field is defined by 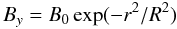 (6)and the azimuthal field by
 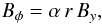 (7)where R is a measure of the radius of the tube, r is the radial distance from the tube axis (r2 = x2 + (z + 10)2) and α = 0.4 is the twist per unit length. In the following experiments, we chose R = 2.5 (i.e. 425 km). Owing to the above formulation, the field strength decreases with r from the axis following a Gaussian profile. The magnetic field on the axis solely has a By component. At a distance R from the axis, the component of the field in the axial direction is 37% its original value. Therefore, the strongest magnetic field is confined within distance R from the center of the tube.
The twist of the field lines around the axis of the tube is uniform. The rising motion of the tube is initiated by applying a density perturbation along the axis of the tube that makes the middle part of the tube less dense and hence more buoyant. This corresponds to the classical Parker buoyancy situation. The density deficit is ![Mathematical equation: \begin{equation} \Delta\,\rho=[p_{\rm t}(r)/p(z)]\,\rho(z)\,{\rm exp}\,(-y^2/\lambda^2), \end{equation}](/articles/aa/full_html/2012/01/aa16956-11/aa16956-11-eq56.png) (8)where pt is the pressure within the flux tube and λ is the buoyant part of the tube. In most of the following experiments, we use λ = 10 and B = 5 (i.e. 6.5 kG) for the initial field strength of the subphotospheric flux tube. The magnitude of the coronal magnetic field is a parameter of the system and it plays an important role in the evolution of the erupting flux ropes. For the coronal magnetic field, we choose values so that the local plasma β is much smaller than one. The distribution of the magnetic pressure in the subphotospheric flux tube and the ambient field is shown in Fig. 1.
(8)where pt is the pressure within the flux tube and λ is the buoyant part of the tube. In most of the following experiments, we use λ = 10 and B = 5 (i.e. 6.5 kG) for the initial field strength of the subphotospheric flux tube. The magnitude of the coronal magnetic field is a parameter of the system and it plays an important role in the evolution of the erupting flux ropes. For the coronal magnetic field, we choose values so that the local plasma β is much smaller than one. The distribution of the magnetic pressure in the subphotospheric flux tube and the ambient field is shown in Fig. 1.
The direction of the initial ambient field is given by the angle Φ. For an horizontal ambient field this angle is measured in a horizontal xy-plane from the positive x-axis. When Φ = 180, the magnetic field lines at the top of the rising flux system are oriented in an approximately antiparallel direction to the ambient field lines (see Fig. 1, middle panel) and they are almost parallel when Φ = 0. Therefore Φ should be considered as the relative contact angle between the two magnetic flux systems upon contact.
In the case of an oblique ambient field, we call the relative contact angle Φ1. The difference to Φ is that Φ1 is measured from the positive x-axis, in the vertical xz-midplane. Therefore, the ambient field is vertical when Φ1 = 90 and antiparallel when Φ1 = 180. The angles Φ and Φ1 are varied in our experiments. We find that they are critical initial parameters of the system because they affect the evolution of the eruptions of magnetized plasma into the corona.
For the computational domain, we assume periodic boundary conditions in the x and y directions. At the top boundary, we include a wave damping zone for z > 22.9 Mm where fluctuations of velocity, gas pressure and density decay exponentially with height. The numerical domain has a size of [−11.9,11.9] × [−13.6,13.6] × [−1.7,25.5] Mm in the longitudinal (x), transverse (y) and vertical (z) directions, respectively.
3. A field-free corona
3.1. Emergence and coronal eruptions
The arrival of the magnetic field at the photosphere is characterized by a significant horizontal spreading caused by the isothermal plasma distribution at the photosphere. Further emergence, above the photosphere, occurs on the basis of the magnetic buoyancy instability as has been described in previous experiments (e.g. Magara 2001; Archontis et al. 2004; Murray et al. 2006). A crucial term for the onset of the instability is the plasma β: the ratio of the gas pressure to the magnetic pressure. As more magnetic layers rise and reach the photosphere, β becomes smaller and the tube starts to expand into the corona. Later on, the buoyant rise of the magnetic field from the subphotospheric layer to the surface continues with a progressively lower rate. In addition, the horizontal expansion at the photosphere weakens the magnetic pressure, and thus, plasma β becomes larger than one, at photospheric heights between z = 3.4 Mm and z ≈ 4.2 Mm. Consequently, it is only the magnetic field above these heights (i.e. upper photosphere) that can expand dynamically into the ambient stratified atmosphere.
Previous experiments (e.g. Magara & Longcope 2001; Manchester et al. 2004; Archontis & Török 2008; Fan 2009) have shown that a new flux rope, which is formed at the upper photosphere, is able to erupt into the corona. Figure 2 (left) shows the cross section of such a flux rope in one of our experiments without a pre-existing ambient coronal field. Notice that the axial magnetic field component of the rope is enhanced relative to the background expanding plasma. The highest value of By, however, is found at the initial axis of the emerging tube. The latter is located underneath the new flux rope and remains in the photosphere throughout the evolution.
In the following experiments, we tracked the height of the center of the new rope (at x = 0,y = 0) and we studied its rising motion within the stratified atmosphere. The height za of its axis is determined by locating the zero of the horizontal field component, Bx(0,0,za) = 0. We confirmed that this location also corresponds to a change in sign of the vertical field component, Bz. As long as the new flux rope passes through the y = 0 plane in a nearly perpendicular manner, this method is a good approximation to calculate the height of its axis. The outermost expanding field forms a magnetic envelope that surrounds the new flux rope.
The right panel in Fig. 2 shows the height-time profile of the erupting rope in experiments where the original tube has a different amount of initial twist. In all experiments the ropes reached coronal heights, between z = 11.9 Mm and z = 13.6 Mm. These eruptions are confined because they cannot break out through the envelope field. After the eruption phase, the ropes approach a quasi-static stage where the magnetic pressure force of the erupting plasma is nearly balanced by the downward tension of the envelope field lines. Archontis & Török (2008) were the first to show the flux rope confinement by the envelope field in similar flux emergence experiments. Our work confirms this result, indicating that it is robust and quite generic.
There are distinct differences in the height-time profiles of the four cases, which are shown in Fig. 2. One difference is that the ropes form at earlier times in the low twist cases (i.e. α = 0.2, α = 0.3). When the twist is higher, the field lines have a strong azimuthal component and it takes longer for the field lines to come closer together and reconnect. For weaker twist, the field lines are oriented toward the axial (y) direction and, thus, shearing motions along the polarity inversion line together with converging plasma flows can bring them into contact in a shorter period of time.
Another difference is that the eruption of the ropes in the weak twist cases occurs with a higher speed, at least initially after their formation. They undergo one relatively fast-rise phase during the eruption, followed by a deceleration that eventually leads to an approximately static location at coronal heights. In the strong-twist cases, the ropes undergo two phases before they settle down in the high atmosphere: an initial slow-rise phase and a second fast-rise phase during which the ropes accelerate within the solar corona. In the following, we chose two experiments to study, α = 0.3 and α = 0.4, which are representative of the two classes (i.e. the weak and the strong twist cases). The height-time profiles in these two experiments are remarkably different until t ≈ 79.2 min, when they enter the quasi-static regime.
Figure 3 (top-left panel) shows the height-time profile (i) of the axis of the rising ropes in the two cases and (ii) of the apex of the envelope fields. The profiles reveal that the rising motion of the envelope fields is very similar in the two cases. The change in the initial amount of twist, from 0.3 to 0.4, does not dramatically affect the initial expansion of the magnetic field in the solar atmosphere. There is only a small difference in favor of the α = 0.4 tube, which is caused by the higher magnetic pressure. The evolution of the envelope fields is almost identical and, consequently, one might not expect a considerable change in the height-time profiles of the ropes that rise within these envelope fields, except if the mechanism that drives the eruption of the ropes is different in the two cases.
The bottom-left panel shows the velocity at the center of the erupting ropes. In the α = 0.3 case, the rope quickly accelerates to a maximum speed of about Vz = 6.8 km s-1 by t ≈ 45.8 min. During the rest of the evolution, the rope decelerates and its speed decreases to very low values (Vz ≈ 0.7 km s-1) while it has emerged within coronal heights. In the α = 0.4 case, the rope undergoes a slow-rise phase (up to t ≈ 53.3 min) during which the height of the rope’s center increases almost linearly with time. Then, a fast-rise phase begins, with an exponential increase of the height. The rising velocity of the rope reaches Vz ≈ 9.5 km s-1 at t ≈ 61.6 min. After that, the rope enters a quick deceleration phase (apart from short-periods of moderate enhancements of Vz) that lasts until the end of the experiment.
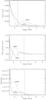 |
Fig. 4 Top: a close-up of the total force distribution along height, for α = 0.3, t = 43.3 min (solid line) and for α = 0.4, t = 48.3 min (dashed line). Middle: the same for the −∇Pg − ρg force. Bottom: the density distribution along height, for the same α and times as above. The vertical dashed line shows the location of the axis of the rope. |
3.2. The initial slow-rise phase: weak vs. strong twist
To study why the weak-twist case rises faster than the strong-twist case during the initial phase of the eruption, we examined the forces at work in the vicinity of the erupting rope. We chose times at which the ropes reach the same heights in the atmosphere. At t ≈ 43.3 min (for the α = 0.3 tube) and at t ≈ 48.3 min (for the α = 0.4 tube), the center of the rope is found at z ≈ 6.4 Mm. The top-right panel in Fig. 3 shows the distribution of the vertical component of the forces along the x = 0,y = 0 line, for the α = 0.3 case. For 5.1 Mm ≤ z ≤ 5.6 Mm the higher magnetic tension of the dipped, twisted field lines underneath the rope results in a positive total force (dotted-dashed line). The dashed line shows the combined force owing to the gas pressure gradient and the gravity force, although typically the gravity force is negligible at these heights. This force contributes to the total force for heights above z ≈ 5.6 Mm. In particular for z ≥ 6.1 Mm, the pressure gradient force and the small positive difference between the tension and the magnetic pressure force give a positive total force. The expansion of the rising magnetic field above the rope (e.g. above z ≈ 7.6 Mm) is driven by the magnetic pressure force that exceeds the downward tension of the field lines. The bottom-right panel shows the corresponding distribution of forces for the α = 0.4 case. For heights below the transition region (z ≈ 5.1 Mm), the dominant force is the Lorentz force. Then gas pressure force increases and contributes substantially to the total force that acts underneath the rope and drives its eruption. Notice that the total force at the center of the rope is weaker compared to the α = 0.3 case. For z > 6.8 Mm, it is again the Lorentz force (mainly the magnetic pressure force) that drives the expansion of the envelope field and the upper part (i.e. above the center) of the erupting rope.
In order to understand why the total force that acts on the rope is stronger when α is smaller, we focused on the area around the center of the rope. The top panel in Fig. 4 shows that the total force is similar in both cases for heights below z = 5.8 Mm. For 5.8 Mm ≤ z ≤ 6.6 Mm, the total force is stronger for α = 0.3 and for z ≥ 6.8 Mm the force is stronger in the α = 0.4 experiment. An examination of the  force (middle panel) shows that (i) for α = 0.4, it is stronger for z ≤ 5.8 Mm and (ii) for α = 0.3, it is stronger in the 5.8 Mm ≤ z ≤ 6.6 Mm regime, which includes the center of the rope. Therefore, the rope in the weak-twist case moves faster because the gas pressure force is stronger in the crucial region, at and just underneath the center of the rope. Notice that the local enhancement of the −∇Pg − ρg force when α = 0.4 does not result in a stronger total force compared to the α = 0.3 case. In the same region, the Lorentz force is stronger for α = 0.3 and, therefore, the total force is practically the same for z ≤ 5.8 Mm in both cases.
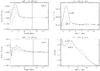 |
Fig. 5 Top-left: the spatial distribution of the vertical component of the forces for α = 0.4 and t = 60 min: total force (solid line), Lorentz force (dotted line) and −∇Pg − ρg force (dashed line). The dashed vertical line marks the position of the flux rope’s axis. Bottom-left: the same for α = 0.3 and t = 51.6 min. Top-right: close-up of the total force distribution for the two experiments: α = 0.4, t = 60 min (solid line) and α = 0.3, t = 51.6 min (dashed line). Bottom-right: density distribution, ρ(0,0,z), along height for the same experiments and times: α = 0.4 (solid line) and α = 0.3 (dashed line). |
The bottom panel shows the distribution of density. In both experiments, dense plasma is trapped underneath the erupting rope, at the dips of the field lines. However, when the twist is higher, the curvature of the dipped field lines is such as to support denser plasma. The density of the plasma that erupts is almost 5 times higher in the α = 0.4 case. Thus, the downward gravitational force is stronger in this case. Notice that the heavier plasma of the strong-twist case is located at lower atmospheric heights. This heavy plasma cannot rise with the same speed as the lighter plasma of the weak-twist case. In general, the distribution of density correlates well with the gas pressure force underneath the rope (middle panel), which ultimately drives the faster eruption when the initial twist of the emerging field is weaker. The less twisted flux rope gets less density from the low atmosphere during its formation and therefore rises faster than the stronger twisted tube during this initial rise phase.
For heights above the center of the rope (e.g. for z ≥ 6.8 Mm), the total force is stronger when the twist is larger. This is because of the higher magnetic pressure force that leads to a pronounced expansion of the field around the mid-plane as it erupts. Eventually, the stronger expansion of the central portion of the rope leads to more efficient draining of dense plasma, which, in turn, may result in a progressively faster eruption of the rope.
3.3. The fast-rise phase: driving mechanism
The height-time profiles in Figs. 2 and 3 reveal that the erupting ropes undergo a second fast-rise phase when the initial twist of the emerging field is stronger. For α = 0.4, the fast-rise phase starts at t ≈ 53.3 min and ends at t ≈ 62.5 min. For α = 0.3, there is no secondary fast eruption phase. As shown in Fig. 3 (bottom-left), the rope accelerates until t ≈ 46.6 min and then it rises across the higher atmosphere with slower speed. To find the driving mechanism of the eruption in the fast-rise phase, we again plotted the forces along the x = 0,y = 0 line. We examined both cases at a time (t = 51.6 min for α = 0.3 and t = 60 min for α = 0.4) when the rope has reached similar heights, within the fast-rise phase. Our aim is to find whether the driving force in the two eruptions is different.
The left panels in Fig. 5 show the spatial distribution of the individual forces for α = 0.4 (top) and α = 0.3 (bottom). In the first case, the dominant force that drives the acceleration of the rope is the Lorentz force. More precisely, it is the tension of the reconnected field lines underneath the rope that drives the fast-rise eruption. The gas pressure gradient also contributes to the acceleration, but only for a limited region across the atmosphere, for 6.3 Mm ≤ z ≤ 7.3 Mm. This is where the associated dense plasma of the eruption has been transferred to at this time of the evolution (see also bottom-right panel). Notice that there was more dense plasma underneath the rope at earlier times. The fast rise and expansion of the field leads to a significant draining of the heavy material along the field lines. At heights above the center of the rope, the total force is locally enhanced (top panels). This is because of the magnetic pressure force, which overwhelms the downward tension of the ambient field lines and drives the expansion of the rope within corona.
In the second case (left-bottom panel), the positive total force for low atmospheric heights (5.9 Mm ≤ z ≤ 6.3 Mm) arises through the gas pressure force. Again, similarly to earlier times, this is associated with the plasma density deposition at the dips of erupting field lines. For greater heights (6.4 Mm ≤ z ≤ 7.4 Mm), the dominant force that drives the rising motion of the rope is the Lorentz force, and it works mainly through the tension of the reconnected field lines. For z > 7.4 Mm and until the center of the rope, it is a combination of the Lorentz force and the gas pressure gradient force that drives the eruption. Notice (bottom-right panel) that there is more dense plasma higher in the corona, and across a more extended region, compared to the α = 0.4 case. Therefore, the gas pressure gradient force still plays an important role in the rising motion of the rope, although it now competes with the Lorentz force.
The top-right panel in Fig. 5 reveals that the total force in the two experiments is different in two discrete regimes: for 5.8 Mm ≤ z ≤ 7.3 Mm and for z > 9.2 Mm. It is worthwhile mentioning that in the region just below the center of the ropes (e.g. 7.4 Mm ≤ z ≤ 9 Mm) the total force is very similar in both experiments. Therefore one may naturally assume that the fast-rise phase that occurs only in the α = 0.4 experiment is caused by the strong Lorentz force in the region 5.8 Mm ≤ z ≤ 7.3 Mm. This is the area just above the vertical current sheet, where internal reconnection occurs as the rope rises. There the tension of the newly reconnected field lines exceeds all the other forces and accelerates the plasma. As the rope rises during the first linear-rise phase, the vertical current sheet builds up and reaches a maximum value at t ≈ 55 min. This time is approximately the time of the onset of the second, fast-rise phase of the rope. Thus, the rope starts to accelerate when internal reconnection becomes efficient enough to drive the eruption of the plasma, via the strong upward tension force of the reconnected fieldlines. This is consistent with the result by Archontis & Török (2008), who found that internal reconnection may become more effective during the eruption of the rope. The same process occurs underneath the rope in the α = 0.3 experiment. There is, however, one important difference. The twist of the field lines that reconnect in the internal vertical current sheet is weaker for α = 0.3 and, consequently, the angle of the field lines into contact is weaker. This leads to a slower internal reconnection and a smaller tension of the reconnected field lines to enhance the rising motion of the rope. An estimate of the maximum magnitude of the vertical current shows that its value is half, compared to the value in the α = 0.4 experiment. The maximum current is formed at t ≈ 58.3 min and, accordingly, one would expect that the rope will undergo a second, possibly fast-rise phase in a similar manner to the α = 0.4 experiment. However, by this time, the α = 0.3 rope has reached a great height, away from the reconnection site and the emitted jet. Therefore, the reconnection outflow does not drastically affect the motion of the rope. In adittion, the rope has entered a quasi-static regime where the downward tension of the envelope field lines nearly balances the Lorentz force. Consequently, the rope is trapped by the envelope field and it relaxes toward an equilibrium. If the rope were relaxed but still close to the reconnection site, the reconnection outflow would force it against the envelope field. In this case, the shape of the rope would be deformed through compression and subsequent possible reconnection with the neighboring fieldlines. The rope may experience some acceleration but it will not erupt. On the other hand, the (slow-rising) strongly twisted tube has not relaxed yet and, consequently, it becomes accelerated by the tension of the fieldlines that reconnect internally, underneath the rope.
4. Horizontal coronal fields
4.1. Height time profiles
Below, we studied the eruption of the rope when there is a pre-existing magnetic field in the solar atmosphere. Firstly, we considered ambient horizontal magnetic fields that make a different contact angle with the emerging field lines when they come into contact. This extends the work of Galsgaard et al. (2007), who considered the initial emergence and did not investigate the flux rope formation and evolution. The field strength of the ambient magnetized plasma was varied in the experiments. For simplicity, we kept the initial twist of the emerging tube the same during the simulations. We chose α = 0.4 because it has the fast-rise in the second phase of the eruption.
The top panel in Fig. 6 shows the height-time profile of the erupting rope in two experiments: without ambient field (solid line) and with a parallel horizontal field (Φ = 0, dashed line). In both experiments, the rope experiences a confined eruption because it cannot break out through the envelope field lines (Archontis & Török 2008; Archontis & Hood 2010). One difference between the experiment without ambient coronal field and the Φ = 0 experiment is that the rope reaches greater heights when there is no pre-existing magnetic field. The weaker the ambient field, the higher the rope reaches in the corona. When the parallel ambient field is stronger, there is an extra magnetic pressure and tension above the rope that halts the emergence, and consequently the rope reaches a lower final height. In any case, the height-time profiles indicate that the existence of an ambient magnetic field, which does not reconnect with the emerging field, does not generate any additional dynamic behavior and the rope remains trapped in the corona.
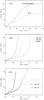 |
Fig. 6 Top: height-time profiles of the erupting rope when there is no ambient field (solid line) and when there is a parallel horizontal magnetic field (dashed line) with Bamb = 1.3 G. In both experiments α = 0.4. Middle: height-time profiles of the erupting rope for different contact angles. Bottom: the same for Φ = 180 (solid lines) and Φ = 270 (dashed lines). The value of the ambient magnetic field is Bamb = 1.3 G (thick lines) and Bamb = 0.91 G (thin lines). |
The middle panel in Fig. 6 shows the height-time profiles of the magnetic flux rope for different contact angles. In all cases the erupting plasma of the rope follows a first slow-rise phase and is then ejected into the outer solar atmosphere with a high speed. This evolution is substantially different from the case where the emergence occurs into a field-free atmosphere or from the Φ = 0 case. In those experiments, external reconnection is absent or limited.
In contrast, in all cases that are presented in Fig. 6 (middle panel), significant reconnection occurs between the ambient coronal field and the envelope magnetic field above the rope. This removes the constraining tension of the envelope field and allows the flux rope to break out and erupt. Shortly after the onset of the ejective eruption (e.g. at t ≈ 58.3 min in the Φ = 270 case), the rope rises with a high speed and collides with the ambient field that has not been reconnected yet. In many experiments, this collision leads to a secondary reconnection event, which occurs between the erupting rope and the remaining ambient field. The new reconnection event can drastically remove flux of the erupting structure, and as a result the rope may undergo a severe deformation or, indeed, annihilation. Therefore, the final heights in Fig. 6 are the maximum heights at which the erupting rope keeps its coherent, twisted shape and the center of its cross section can still be detected.
An important result is that the onset time of the fast-rise phase depends on the relative contact angle. The eruption occurs earlier in the Φ = 180 case because the magnetic field from the envelope is peeling off more effectively, compared to the Φ = 90 and Φ = 270 cases. As a consequence, the duration of the slow-rise phase is shorter and the height at the onset of the eruption is smaller in the Φ = 180 case. Therefore, the height-time profiles show that the dynamical evolution of the erupting rope is drastically affected by the relative contact angle Φ.
The bottom panel in Fig. 6 shows the emergence of the rope when a weaker magnetic field is included in the ambient atmosphere. The Φ = 180 (thick lines) and 270 (thin lines) cases are shown. In the first case, the inclusion of a weaker ambient field leads to a delay of the ejective eruption. The current sheet that is formed at the interface, between the emerging and the preexisting fields, is now weaker because of the reduced strength of the ambient magnetic field. Therefore, the reconnection process starts at a later time and delays the removal of sufficient envelope flux necessary for triggering the eruption. In the second case, the emergence into a weaker ambient field environment leads to a confined eruption. The emerging field is driven by excess magnetic pressure and it is pressed against the coronal magnetic field, without being reconnected in an efficient manner. Thus, the tension of the non-reconnected, envelope field lines can hold the rope at relatively low coronal heights.
The results shown in Fig. 6 are generic: for any Φ that favors reconnection, ejective eruptions occur earlier when the ambient field is stronger. In this case, a considerable amount of flux from the envelope field is removed, leading to the early onset of the eruption. Of course, too strong a field and the secondary reconnection of the rising flux rope directly with the ambient field may destroy the rope entirely. The removal of the envelope flux is less effective for progressively weaker ambient fields, eventually resulting in a confined eruption. The evolution of fluxes of the magnetic systems into contact is discussed in more detail in Sect. 6.
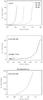 |
Fig. 7 Top: the velocity of the center of the erupting ropes for different Φ. Middle: temporal evolution of Vz at the center of the rope (solid line) and at the crest of the envelope field (dashed). Φ = 180. Bottom: maximum value of Vz, of the internal reconnection jet. Φ = 180. |
4.2. Velocity profiles
To show how fast the eruptions are, we measured the velocity of the ropes during their rising motion. The top panel in Fig. 7 shows Vz of the center of the rope in the vertical mid-plane for various Φ. In all cases, the rope is moving with a slow speed in the first linear phase and is accelerated after the onset of the eruption. The acceleration occurs almost with the same rate during the fast-rise phase, and the maximum speed that is reached before the ropes reach the upper boundary, is between Vz = 61 km s-1 and Vz = 68 km s-1. In the middle panel, we compare the velocity Vz with the velocity of the summit point at the crest of the envelope field (Vcrest), for the Φ = 180 case.
Galsgaard et al. (2007) performed a similar experiment. Using the same normalization, they showed that the emerging volume of the envelope field rises with a speed of about Vcrest = 13.6 km s-1 between t = 22.9 min and t = 29.1 min. Then, it decelerates but it continues to rise within the corona. The time of t = 29.1 min is approximately the time at which i) pressure balance is achieved across the current sheet at the interface and ii) the vertical forces that act on the upper part of the envelope field take on very low values. The above result explains the decrease of Vcrest at t = 41.6−45.8 min in the middle panel of Fig. 7. After this time, the rope begins the eruption phase and therefore it moves with progressively higher speed. As the rope rises, it also expands because of the enhanced magnetic pressure within its volume. Eventually, the upper part of the envelope coincides with the apex of the erupting volume of the rope. This explains the parallel evolution of Vcrest and Vz. The small difference shows that the center and the uppermost layers of the rope move practically with the same speed. However, this is not the maximum speed found within the erupting volume of the rope. After the onset of the fast-rise phase (t ≈ 47.9 min), a reconnection jet is emitted from the vertical current sheet that is formed underneath the rope. In similar flux emergence experiments, Archontis & Hood (2010) showed that this internal reconnection process is enhanced during the eruption of the rope because of the pressure deficit underneath the rope that brings oppositely directed field lines into contact. The maximum speed of this jet is shown in the bottom panel of Fig. 7. It follows a similar trend to the Vz of the rope’s center but it is much faster. It reaches values up to Vz = 374 km s-1, which is almost 2.5 times the local Alfvén speed in the corona. The high-speed outflow of the jet contributes to the acceleration of the rope.
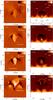 |
Fig. 8 Left column: vertical velocity at the xz-midplane, in the Φ = 90 case. Right column: density for the same experiment. |
The above results show that during the acceleration phase the velocity of the erupting plasma is higher at the low magnetic layers of the rising volume. This is mainly because of the internal reconnection outflows that are emitted underneath the rope and accelerate the plasma to high velocities. This is a generic result, which is found in all our experiments, independently of the properties of the ambient field. One example is shown in the left column of Fig. 8. This is the distribution of Vz in the vertical mid-plane for the Φ = 90 case. Before the fast-rise phase, the upward velocity is pronounced at the front of the erupting rope (e.g. x = 0.7 Mm, z = 13.6 Mm). Notice that there are downflows at the periphery of the erupting volume of the rope (e.g. x = −4.4 Mm, z = 9.5 Mm) but also at the far edges of the overall emerging field (e.g. x = −10.2 Mm, z = 9.5 Mm). This representation indicates that the erupting rope and the initial emerging field are two different structures. They consist of different field lines and their plasma rises with a different speed. As time progresses (t ≥ 66.6 min), bi-directional flows are produced at the low atmosphere (e.g. x = 0 Mm, z = 5.8 Mm) through internal reconnection. The height where the jets are emitted increases during the evolution of the system. This is because internal reconnection occurs underneath the rope in a continuous manner as the rope erupts into the corona. The later stages of the eruption (t = 70 min) show that the upper part of the erupting plasma (e.g. x = 0 Mm, z = 15.3 Mm) rises with a high speed. However, at all times, the fastest segment of the rising rope’s volume is the plasma accelerated by the tension of the newly internally reconnected field lines.
4.3. Eruption of dense plasma
It is important to study whether dense plasma is lifted up and expelled into the outer solar atmosphere during these eruptions. Previous simulations (e.g. Archontis & Török 2008) have shown that the erupting rope consists of twisted field lines that carry dense plasma from the low atmosphere at their concave parts. The right column in Fig. 8 shows the density distribution across the solar atmosphere during the eruption for the Φ = 90 case. By t = 60 min the apex of the envelope field has reached a height of about z = 13.6 Mm. It has also suffered a lateral expansion, which leads on the one hand to the accumulation of dense plasma at the edges of the envelope field in the low atmosphere. The pile-up of material forms dense deposits on both sides of the y − z mid-plane. On the other hand, the uppermost volume of the emerging field possess a cavity-like configuration, which is marked by a depletion of plasma. The dense plasma of the erupting rope emanates from a region that is located between the dense plasma deposits at the upper photosphere/transition region.
The evolution of the system shows that the start of the reconnection jet and the fast eruption of the dense plasma correlate well. The upward jet collides with the dense material, which then helps to accelerate it into higher atmospheric levels. In response to this motion, the dense plasma encompasses the jet forming an arch-like structure (t = 66.6 min, t = 70 min) that eventually reaches the outskirts of the envelope field (t = 71.6 min). Initially, the rope comprises plasma with density of about 2−3 × 10⁻⁵. As the rope rises and expands, the average plasma density drops. In addition, there is draining of plasma to the photosphere through gravity from the edges of the rope where the field lines are more vertical. On average, the density drops to values between ρ = 5 × 10⁻⁸ and ρ = 10-7. Although the rope reaches great coronal heights (e.g. 15 Mm within the corona), it is still 1−2 orders of magnitude heavier than the background plasma. The eruption of this dense plasma in the corona is common to all the experiments. In the cases where the erupting rope collides with the ambient field, the associated plasma may undergo compression that leads to a local enhancement of the density. This heavy plasma may either rise further for a few pressure scale heights into the corona or it may be dispersed within the emerging volume and eventually fall down to the low atmosphere.
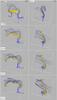 |
Fig. 9 Left column: 3D visualization of the eruption of the dense plasma through the solar atmosphere. The yellow isosurface represents dense material from the transition region. Only heights above z = 6.8 Mm are considered for the visualization of the isosurfaces. Field lines are shown in blue color. Right column: the same evolution, as viewed from above. |
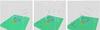 |
Fig. 10 3D configuration of the field lines of the emerging field (blue and red) and the ambient field (white). The colored contours show the photospheric distribution of Bz (yellow is positive and blue is negative). The arrows show the direction of the fieldlines. Three cases are shown: oblique with Φ1 = 30 (left), vertical with Φ1 = 90 (middle) and oblique with Φ1 = 150 (right). The three panels have been chosen to display an illustration of the reconnection between emerging and ambient field lines. Times are different, but they correspond to a similar stage of evolution of the system in each experiment. |
The configuration of the dense plasma eruption in the three-dimensional atmosphere is shown in Fig. 9. The 3D shape and dynamical evolution of the dense material is similar for the cases with different Φ. Here, we choose to show the Φ = 180 case, which is the most suitable for efficient external reconnection and early fast eruption of the rope. In Fig. 9 the transparent isosurface (yellow color) shows the dense plasma that erupts into the corona. The field lines have been traced from the lower part of the isosurface. Shown are snapshots at four times and two perspectives (side and top view, left and right column respectively).
At t = 59.1 min, the dense plasma is accumulated into a thin isosurface with a sigmoidal shape, as is revealed by the top view imaging of the structure. The heavy material is supported by the dips of the twisted field lines of the flux rope. The dense sigmoidal material constitutes the immediate part just beneath the center of the flux rope, in the flux region labeled F0 in Fig. 13. Most of the field lines make a full turn along the y-axis of the emerging tube, possessing a substantial number of dips along the bottom part of the sigmoid. At this time in the evolution, most of these field lines connect the two footpoints of the emerging flux tube. It is only a small number of field lines that reconnect with the ambient field and, therefore, they start from the subphotospheric tube but they end up as part of the pre-existing magnetic field. The top view panel shows the drastic change of connectivity for the externally reconnected field lines. They are now oriented along the x-axis, while the non-reconnected field lines are oriented along the y-axis, adopting an overall sigmoidal shape.
At t = 66.6 min, the emergence of the field and the reconnection with the ambient field has proceeded at a rapid pace. The corresponding top view shows that a considerable number of field lines have now been externally reconnected. Some of them experience multiple reconnection events (Archontis et al. 2005) and still possess dips underneath the dense material, supporting its eruption into the outer atmosphere. As time goes on (t = 70 min, t = 70.4 min), the process of reconnection continues to occur in an intricate manner. The majority of field lines that hold the heavy erupting plasma are oriented along the transverse direction because they now belong entirely to the coronal field. The visualization of the isosurface shows that the dense material continues to adopt a sigmoidal shape, when it is projected into the xy-plane. Moreover, the side-view imaging reveals that it develops an arch-like configuration along the y-direction. The development of this configuration is partly because the strength of the reconnection jet, which helps to accelerate the rope, varies in y-direction: it is faster around the middle region of the y-axis and becomes slower for y < −3.4 Mm, y > 3.4 Mm. Thus, it assists the central part of the sigmoidal structure (and the rope) in the faster eruption, while the two ends of the structure move with slower speeds.
5. Non-horizontal coronal fields
5.1. Height-time profiles
We now consider experiments with a vertical or oblique ambient field. Three cases have been studied. Two oblique cases, where the ambient field has an inclination of Φ1 = 30 and Φ1 = 150 degrees to the x-axis and one vertical, which forms a relative contact angle of ≈ 90 degrees with the uppermost field lines of the upcoming field. In all cases, there is a vertical component of the ambient field. The setup of these simulations can also be used to study flux emergence into a coronal hole or emergence close to one of the main polarities of a pre-existing active region.
Figure 10 shows the topology of the field lines in the three experiments. The envelope field lines (in blue color) of the upcoming field form an arch-like shape structure that comes into contact with the external coronal field (white field lines). In all cases, these two sets of field lines make a small relative angle around the area of the positive emerging polarity. In fact, for Φ1 = 90 the fieldlines are almost parallel in this location. Therefore, it is mainly the region around the negative polarity of the emerging field where the field lines reconnect more efficiently. Eventually, owing to the three-dimensional configuration of the fieldlines and the dynamic evolution of the emerging magnetic field, reconnection is expected to occur (with a varied degree of efficiency) not only in the vicinity of the negative emerging polarity but also around the emerging flux region.
It is worthwhile to mention that the contact of the emerging tube with the ambient field is followed by emission of high velocity outflows (jets). On the side where the field lines are more parallel, the plasma is compressed and the jet is driven by the pressure gradient force. On the other side of the polarity inversion line, the outflow is a reconnection jet and is driven by the tension of the reconnected field lines. The emission of jets is a generic phenomenon that occurs in most of the experiments described in this paper. They are more pronounced in the vertical and Φ1 = 150 case because of the relative orientation of the fields when they come into contact.
The top panel in Fig. 11 shows the height-time profile for the three cases. For Φ1 = 30, the rope is not ejected. The reconnection is limited and cannot release the downward tension of the envelope field in a break-out manner. Therefore, the rope remains at low coronal heights. Even if the external magnetic field becomes weaker, the rope will rise higher within the corona but it cannot avoid being constrained by the envelope field. In the other two cases (Φ1 = 90 and Φ1 = 150), the evolution of the rope indicates that the rising plasma undergoes a two-phase ejective eruption. A first comparison between the oblique and vertical cases show that when the inclination of the ambient field is steeper, the eruption is more explosive. Both eruptions go through short slow-rise phases before they start rising faster into the corona. In the vertical case, the slow-rise phase lasts for longer, approximately an extra 30 time units.
The middle panel in Fig. 11 shows the erupting velocity of the rope for the three experiments. In the case of the confined eruption, the rope is rising with a very low speed that does not exceed Vz ≈ 3 km s-1. For the Φ1 = 90 case, the rope reaches a maximum velocity of about Vz ≈ 20 km s-1 before it starts to decelerate because the coronal field has reconnected with the entire envelope field and is now eating into the flux rope. The fastest eruption is achieved in the oblique-antiparallel case. In a short period of time (45.8 min ≤ t ≤ 50 min) the rope accelerates from Vz ≈ 9 km s-1 to Vz ≈ 68 km s-1. This velocity is comparable to the speed of the eruptions in the horizontal field cases.
To compare all ambient field cases that we presented in this paper, we plot the height-time profiles of all six experiments, with α = 0.4. This is shown in the bottom panel of Fig. 11. Only the Φ1 = 30 case shows a confined eruption, all the other cases are ejective eruptions. The slope in the fast-rise phase is similar for all ejective eruptions. A small deviation is observed in the Φ1 = 90 case, where the rope erupts with slower speed. The comparison of the height-time profiles shows that a rotation of the horizontal Φ = 180 ambient field by 30 degrees to the x-axis does not affect the eruption dramatically. In the Φ1 = 150 experiment, the rope reaches great coronal heights around z = 20.4 Mm and is ejected with a similar speed to the Φ = 180 experiment. Further rotation of the ambient field direction (e.g. the Φ1 = 90 case) leads to a delay of the fast ejection phase. The ambient field lines in the Φ1 = 90 case extend vertically, from the low solar atmosphere to the corona, along the positive z-direction. Therefore, one might assume that reconnection of the envelope field with the vertical ambient field lines will open an upward, direct path for the new flux rope and result in an early, ejective eruption from the solar atmosphere. However, this is not the case, as other experiments (see e.g. the Φ1 = 150 case in Fig. 11) produce earlier eruptions.
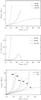 |
Fig. 11 Top: height-time profiles of the erupting ropes for Φ1 = 150 (dashed), Φ1 = 90 (solid) and Φ1 = 30 (dot-dashed). Middle: the evolution of the rising velocity of the erupting ropes for the three cases. Bottom: the height-time profiles of all the experiments for Φ (solid) and Φ1 (dot-dashed). From left to right: Φ = 180,270,90 and Φ1 = 150,90,30. |
5.2. Eruption of dense plasma
Our aim now is to study how a change in the relative contact angle Φ1 produces a different height-time profile. In Fig. 12 we consider the evolution of the density during the flux rope eruption for Φ1 = 90 (left column) and Φ1 = 150 (right column). The projection of the full magnetic field vector onto the vertical midplane (arrows) is overplotted.
Firstly, we studied the vertical field case. When the emerging field comes into contact with the ambient vertical field, a current layer is formed at the interface, which extends from the apex of the envelope towards the positive x-direction where the field lines are anti-parallel. Eventually, reconnection occurs in the current layer and plasma outflows are emitted from the ends of the current sheet along the reconnected field lines.
On the left side, the field lines are almost perfectly aligned and, therefore, reconnection is extremely limited. Mostly, there is compression of the local plasma through the sideways expansion of the emerging field. As the emerging and the ambient field lines are pressed against each other, the dense plasma is squeezed even more, undergoing an apparent rising motion. At t = 45 min, the topology of the field lines is such that threads of dense plasma reach heights around z = 41.6 Mm while encompassing the emerging field from the negative x-direction up to its crest. The compression leads to a local pressure enhancement. Thus, the emerging field starts gradually to expand, preferentially toward the positive x-direction where the outside pressure is less. In adittion, the deflection of the flux rope is supported by the Lorentz force through the interaction of the flux rope current with the ambient fieldlines. However, the main driver of the deflection is the pressure gradient force along the x-axis. Now the expansion of the emerging field is asymmetric (e.g. at t = 58.3 min). Notice, because of the above dynamic evolution, the fieldlines just above the envelope field have altered their direction. They are pointing along the positive x-direction, adopting an oblique configuration. This compels the reconnection to occur mainly on the right-hand side of the emerging field.
During the fast-rise phase of the erupting rope (t = 63.3 min), dense plasma is carried into the corona with progressively high speed. As in the horizontal ambient field case (see Fig. 8), this dense plasma is gathered at the dips of the twisted field lines underneath the center of the new flux rope. As the dense plasma erupts, the flux rope moves away from the high-pressure regime, on the left-hand side of the emerging flux toward the right. This motion together with the fact that reconnection removes flux primarily from the right-hand side, means that the tube follows a sideway eruption.
A similar sideway eruption occurs for Φ1 = 150 (right column, Fig. 12). In this case, the lower segments of the field lines that emanate from the positive polarity of the emerging flux make a small angle with the oblique ambient field lines and, consequently, they can reconnect after they come into contact. Owing to the relative orientation of the fieldlines, reconnection occurs at successive heights (e.g. at t = 33.3 min, top-right panel): from the low atmosphere (z ≈ 5.1 Mm) up to the summit of the envelope field (z ≈ 10.2 Mm), where the strongest current layer is formed. At low heights, the plasma is dense and therefore magnetic tension in the low atmosphere ejects heavy material along the direction of the reconnected field lines. The elongated threads of dense plasma that appear at t = 33.3 min (around −10.2 Mm < x < −3.4 Mm, 5.1 Mm < z < 13.6 Mm) are the result of this process. However, the low velocity of reconnected plasma is not sufficient to escape the force of gravity. Therefore, the dense plasma threads are bounded at moderate heights on the left-hand side of the emerging flux region.
As we explained above, this accumulation of dense plasma on the sides of the emerging flux, affects the eruption of the rope. Therefore, similarly to the Φ1 = 90 case, we find that the rope undergoes a sideway eruption during the evolution (see panels at t = 45−51.6 min). Notice that the declination of the eruption toward the positive x-direction is not as marked this time, because the distinct dense plasma is orientated mainly along the ambient field direction and, therefore, does not encompass the envelope of the emerging field substantially. Another remarkable difference between the two cases is that reconnection removes flux from the emerging field in a more efficient manner in the Φ1 = 150 case. For instance, looking at t = 45 min, we find that the volume of the emerging field for Φ1 = 150 has become very narrow: it extends from x ≈ −0.7 Mm to x ≈ 2.4 Mm along the transverse direction. All other field lines in the x-direction have been reconnected. At the same time, the emerging volume in the Φ1 = 90 case keeps the fan-like shape that extends from x ≈ −4.3 Mm to x ≈ 7 Mm. Obviously, there are more fieldlines in the envelope field that have not been reconnected yet. This is actually the reason why the slow-rise phase is longer for the Φ1 = 90 case than for the Φ1 = 150 case, before the fast eruption of the rope.
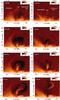 |
Fig. 12 Left column: distribution of density at the xz-midplane, Φ1 = 90. Right column: the same for Φ1 = 150. The arrows show the projection of the full magnetic field vector into the plane. Also shown is the emerging flux region (EFR) and the reconnection loops, on the right-hand side of the EFR (top panels). |
6. Magnetic flux removal via reconnection
Previous simulations (e.g. Archontis & Török 2008) have shown that internal reconnection, which occurs underneath the rising magnetized plasma, accompanies the eruption of the rope. As we mentioned before, our results indicate that when there is no ambient field, this internal reconnection helps the rope to accelerate, but it is not sufficient to lead to an ejective eruption. Our aim is to find whether the removal of the right amount of flux above the upcoming rope may lead to an ejective or a confined eruption. To this end, we made a first estimate of the evolution of the magnetic flux, within and outside the magnetic flux rope.
In the following, we studied two horizontal cases: Φ = 0 and Φ = 180. In the latter, the fields that come into contact are anti-parallel and it is mainly the x-component of the magnetic field that reconnects at the summit of the envelope field. Accordingly, a rough approach for the calculation of the fluxes is to estimate the transverse flux, per unit length in y-direction, 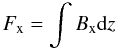 (9)at the vertical mid-plane.
Figure 13 is a schematic representation of the system that shows the separate regions where we calculated the magnetic fluxes. Firstly we located the X-type point of the internal reconnection regime underneath the erupting rope. This is not a null point (in the strict sense) but the term is used to illustrate the shape of the field lines projected onto the x − z plane. Then, we traced field lines from the close vicinity of the X point. The limits of the flux rope are delineated by the outermost field lines with an O-like shape. Outside the edge of the rope, the field lines with an Ω-like shape belong to the envelope field. The upper field lines that have not yet been reconnected with the ambient field outline the crest of the envelope field. Similarly, the lowermost non-reconnected field lines of the ambient field outline the bottom of the pre-existing magnetic field. We found the coordinates (i.e. the position on the z-axis) of the afore-mentioned field lines and subsequently we defined the limits of the regions where we calculated the fluxes. We repeat the method for each timestep, because the X-type point changes in height during the evolution. Consequently, F0 is the flux between the X point and the flux rope axis. F1 is the flux between the axis and the top of the rope. F2 is the flux in the envelope field and F3 is the flux in the ambient field. Equation (9) is only a very rough estimate of the fluxes involved, because the rope has a 3D structure and the fieldlines passing through the lower half of the rope have not necessarily been reconnected at the same site and with the same rate as the fieldines passing through the upper half. In other words, the reconnection rate is not the same all along the X-line, which is formed by the collection of the X-type points underneath the flux rope. This, presumably, leads to a small flux imbalance shortly after the initial formation of the magnetic flux rope. If the rope were, e.g. a straight horizontal and symmetric cylinder, experiencing the same reconnection rate all along the X-axis, then F0 and F1 would be exactly equal and opposite. The left panel in Fig. 14 shows the time evolution of the magnetic fluxes in the case of no ambient field. There are three main phases. In the first phase (39.6 min < t < 50 min), the fluxes remain almost constant. The height-time profile in Fig. 3 shows that the rope has reached the corona by the end of this phase. During the second phase (50 min < t < 75 min) the fluxes undergo significant deviations from their nominal values. The fluxes within the rope (F0, F1) increase while F2 decreases. As the rope rises into the corona, the field lines of the envelope field reconnect at the current sheet underneath the rope. Owing to this internal reconnection, magnetic flux is removed from the envelope field and is partially added to the rising rope. After t = 75 min, the rope approaches a quasi-static state as it is indicated by the height-time profile in Fig. 3. This is the beginning of the third phase during which the changes in the magnetic fluxes are minimal. Notice that the flux of the envelope field remains higher than the transverse flux F1 of the rope. We have repeated the calculation in other x − z slices and found similar results, i.e. when the internal reconnection process does not remove enough flux from the envelope field, the rope does not escape in an ejective manner.
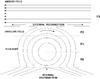 |
Fig. 13 A cartoon sketch representing the process of emergence and reconnection (internal and external) that leads to the eruption of a flux rope. |
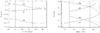 |
Fig. 14 Left: time evolution of the magnetic fluxes in the case with no ambient field. Right: the same for the case with Φ = 180. |
The right panel in Fig. 14 shows the time evolution of the magnetic fluxes in the Φ = 180 case. Again there are three main phases. In the first phase (up to t ≈ 37.5 min), there is a moderate decrease of the envelope and the ambient fluxes. The decrease is caused by the external reconnection that removes flux from the two magnetic flux systems. It is worthwhile to mention that during this phase the external reconnection does not occur at a fast rate. Plasmoid-like structures are formed in the current sheet, which develops at the interface between the upcoming and pre-existing field lines. As shown in previous simulations (e.g. Shibata et al. 1992; Yokoyama & Shibata 1994; Archontis et al. 2006), the existence of plasmoids delays the direct contact and the fast reconnection of the interacting magnetic fields. As a result, the fluxes of the ambient and envelope fields decrease at a slow rate. The evolution of the new flux rope starts at t ≥ 37.5 min and, therefore, the calculation for F0 and F1 begins at this time.
Indeed, after t ≈ 37.5 min (phase 2), there is a more genuine modification in the evolution of the fluxes. This is bacause external reconnection becomes more efficient. The reason is that the plasmoids are ejected out of the current layer. The removal of the plasmoids brings the two fields into direct contact and, consequently, leads to a more effective removal of flux. Therefore, F2 and F3 decrease faster now. During this phase, the new flux rope rises from the transition region into the corona. As we discussed for the Φ = 0 experiment, the internal reconnection underneath the erupting rope adds more flux to the expanding magnetized volume. Therefore, F1 and F0 increase.
After looking at the height-time profile of the rope (Fig. 6), we find that the rope starts the second phase of a successful eruption around the time of t ≈ 48.3 min. This is the time that a new phase begins in the evolution of the magnetic fluxes. The third phase is marked by a rapid increase of the rope’s flux and a remarkable decrease of the ambient and envelope fluxes. This is the result of a runaway situation driven by the simultaneous action of the internal and external reconnection. As we mentioned above, the internal reconnection produces a jet that emanates around t ≈ 48.3 min. The reconnection jet is pushing the rope from below and therefore the rope and the envelope field rise with a higher speed toward the external reconnection site. This increases the inflow of the magnetized plasma that reconnects and, consequently, it increases the rate of flux removal from the envelope and the ambient magnetic field. Therefore, this is a runaway situation where both (internal and external) reconnection events assist the rope to rise into a progressively weaker flux regime.
A striking result is that at t ≈ 48.3 min the decreasing envelope flux F2 becomes equal to the rope’s flux F1 and after that time there is a flux imbalance in favor of the erupting rope. It is not unlikely that the amount of envelope flux that is removed affects the onset of the acceleration phase of the rope. More precisely, in the Φ = 0 case, the flux of the envelope field is decreased via internal reconnection, but it remains higher than the flux of the erupting rope until the end of the experiment. In this case, the rope cannot break through the envelope field and remains confined in the corona. In the Φ = 180 case, the envelope flux becomes less than the erupting flux and the envelope field does not prevent the full escape of the rope to the outer solar atmosphere. Indeed, after t ≈ 48.3 min the flux rope accelerates and undergoes an ejective eruption.
In any case, to fully determine the dynamical evolution of the rising flux rope, it is important to perform an analysis of the forces. This analysis will strongly suggest whether, e.g. the removal of the right amount of downward tension of the envelope fieldlines leads to the ejective expulsion of the magnetic flux rope.
7. Discussion
We presented an investigation of how emergence of magnetic flux from the solar interior leads to expulsion of solar plasma. The experiments presented in this paper belong to two main categories. In the first category, a twisted magnetic flux tube emerges into a field-free atmosphere. In the second category, a series of numerical simulations illustrate the emergence into a pre-existing ambient magnetic field. These two sets of experiments were undertaken to study the changes in the dynamics of plasma expulsions, when the emerging plasma comes into contact with a background magnetic field in the solar atmosphere.
Now, the solar corona is a low-β regime and, therefore, the emergence into a magnetic-free environment is a far too idealized scenario. However, these experiments are suitable for studying the effect of the initial twist of the emerging tube on the dynamics of the erupting plasma. Moreover, the inclusion of a weak ambient field or one that disfavors reconnection seems to have the same effect in the dynamics of the eruption. Namely, the new flux ropes remain enclosed within the envelope magnetic field. Therefore, the results of these experiments can be applied to emerging flux regions with envelope fields that are not substantially reconfigured (e.g. via reconnection) by the pre-existing coronal field.
In the second series of experiments, we have included an ambient field in the corona. This field is space-filling, constant and uniform. A different (possibly more realistic) external field should decrease in field strength with height, and have, for example, an arcade-like configuration. In this case, the removal of envelope flux because of external reconnection will occur with a different rate because the successive, reconnected ambient fieldlines will have a different field strength. Therefore, the height-time profile and the dynamics of the eruptions will change. To find out exactly how these ambient fields affect the eruptions requires a parametric study, similar to the one presented in this paper for horizontal and oblique fields.
The actual values of the ambient field strengths in our experiments represent a small group of weak coronal magnetic fields. The solar corona consists of a complex network of open and closed fieldlines, filled with magnetized plasma, with a wide range of field strengths. Therefore, our simulations should be considered as thought experiments: the main aim is to explore the potential consequences of the external interaction between the emerging and the ambient fields on the eruption of coronal flux ropes. Given the field strength of the original emerging field and the specific initial conditions of each experiment, the coronal magnetic fields under consideration may or may not lead (for example, via reconnection) to a confined or ejective eruption. A small change in the field strength of the ambient field may alter the ultimate eruptive phase of the rising plasma. This highlights the crucial importance of the relative strength of the interacting fields, which may result in efficient removal of envelope flux and in turn lead to coronal eruptions.
The expulsions of the magnetized plasma that are produced in our experiments might account for small-scale eruptions over ephemeral active regions. These expulsions occur in simple magnetic field configurations, including the original single bipolar loop of the emerging flux and the uniform, horizontal or oblique, pre-existing magnetic field. The erupting plasma is dense and is carried upward within the twisted fieldlines of a coronal flux rope. The length of the erupting structure is on the order of 20 Mm (along the axial direction) and its rising motion is extremely dynamic (it can erupt within a few minutes). Clearly, the numerical domain of connectivity includes only the lower part of the corona and does not extend over longer distances, e.g. into the heliosphere. Therefore, we cannot conclude whether these eruptions may develop into large-scale coronal eruptions, which will propagate into the interplanetary space. However, we have shown that these small-scale eruptive events have some characteristics in common with large-scale eruptions: a) the cross-section of the erupting plasma possesses the shape of a plasmoid that lifts up dense material from the low atmosphere; b) the height-time profile of the eruption shows a slow-rise and a fast-rise phase, during which the rope erupts with super-Alfvénic speed; c) the fast eruption is accompanied by an episode of intense heating underneath the rope; d) the rope experiences a progressively marked expansion as it erupts into the corona; e) given the removal of the entire ambient and envelope fields, the flux rope is potentially able to continue to accelerate and expand into interplanetary space. Therefore, it is not unlikely that these small-scale phenomena may develop into larger scale coronal expulsions, which originate in active regions. Exploring the nature of their onset and propagation is extremely important for our understanding of solar eruptive events on various scales.
8. Conclusions
Through our numerical experiments we investigated the nature of coronal flux rope eruptions in regions of magnetic flux emergence. In the following, we describe the most important results of our investigation.
The emergence of a twisted flux tube into a field-free atmosphere is followed by the formation of a new flux rope and its subsequent eruption into the corona. The eruption is confined by the envelope field of the emerging flux. In this case, the new flux rope approaches a quasi-static equilibrium state. If the initial twist of the emerging tube is strong (i.e. α > 0.3), the coronal rope possesses two phases during its eruption. In the first phase, the rope rises with a slow speed while in the second phase the ropes accelerates within coronal heights.
The coronal eruptions are characterized by the transfer of dense plasma, which is deposited at the dips of the twisted field lines that erupt. The stronger the twist of the coronal rope, the more dense plasma is carried into the corona. The three-dimensional distribution of density adopts a sigmoidal shape along the erupting flux rope.
While the magnetic flux ropes with weak twist erupt earlier, the flux ropes with strong twist become faster during the evolution of the system. Initially, the eruption is driven by the gas pressure gradient force that is locally enhanced through the trapped dense plasma at the dipped field lines. Eventually, internal reconnection, which occurs underneath the rope, becomes very efficient so that the tension of the reconnected field lines may accelerate the rope to high speeds. In fact, the acceleration is more apparent when the rope is closer to the reconnection site and has not yet relaxed (i.e. the strong-twist case). The onset of the fast-rise phase in the eruptions is closely related to the efficiency of the internal reconnection.
The inclusion of a pre-existing magnetized atmosphere may cause dramatic changes in the evolution of the erupting plasma. More precisely, the experiments have revealed that the emergence into an ambient magnetic field may lead to an ejective eruption of the flux rope. The potential escape of the rope into the high atmosphere is subject to specific parameters of the ambient field: the relative contact angle and the magnetic field strength.
When the relative contact angle (i.e. Φ, Φ1) is sufficient for effective removal of envelope flux, the rope experiences an ejective eruption. For any contact angle that favors reconnection, ejective eruptions occur earlier when the ambient field is stronger. However, if the pre-existing field is too strong, the erupting rope may collide with the remaining ambient field, which has not reconnected yet, and as a result it may undergo a severe deformation or annihilation. The emergence into an ambient weak magnetic field most likely leads to a confined eruption, owing to the limited external reconnection in removing the flux and tension of the envelope magnetic field. In all cases, a vertical or an oblique ambient magnetic field is not necessarily more effective than a horizontal field at opening the way (via reconnection) for the upcoming rope to erupt.
The ejective eruptions possess a two-phase rising motion with velocities that may exceed the local Alfvén speed in the corona. Jets that are emitted underneath the rope and are caused by internal reconnection may assist the rope in erupting with a high speed. In fact, we are witnessing a runaway situation where both the internal and external reconnection boost the rapid rising motion of the rope.
A preliminary quantitative analysis has revealed that the amount of the envelope flux that is removed may play a role in determing the rising behavior of the rope. For instance, in the Φ = 180 case, we found that when the envelope flux becomes less than the erupting flux, the rope can erupt into the outer solar atmosphere in an ejective manner. In the Φ = 0 case, the removal of the envelope flux is limited and, therefore, it remains higher than the amount of flux enclosed within the rising flux rope. In this case, the rope remains trapped under the tension of the envelope fields.
These key results were identified as general features from all simulations and they can be looked for in observations. More parameter studies of this type are required to further investigate the coupling between magnetic flux emergence and plasma expulsions in the Sun.
Acknowledgments
We gratefully acknowledge the financial support of STFC and the European Commission through the SOLAIRE Network (MTRN-CT-2006-035484). The simulations were performed on the STFC and SRIF funded UKMHD cluster, at the University of St Andrews. The authors are grateful to Dr. T. Török for useful suggestions and comments on this manuscript. V. Archontis acknowledges support of a Royal Society University Research Fellowship.
References
- Arber, T., Longbottom, A., Gerrard, C., & Milne, A. 2001, J. Comp. Phys., 171, 151 [Google Scholar]
- Archontis, V. 2008, J. Geophys. Res. (Space Phys.), 113, 3 [Google Scholar]
- Archontis, V., & Hood, A. W. 2008, ApJ, 674, L113 [NASA ADS] [CrossRef] [Google Scholar]
- Archontis, V., & Hood, A. W. 2010, A&A, 514, A56 [NASA ADS] [CrossRef] [EDP Sciences] [Google Scholar]
- Archontis, V., & Török, T. 2008, A&A, 492, L35 [NASA ADS] [CrossRef] [EDP Sciences] [Google Scholar]
- Archontis, V., Moreno-Insertis, F., Galsgaard, K., Hood, A. & O’Shea, E. 2004, A&A, 426, 1047 [NASA ADS] [CrossRef] [EDP Sciences] [Google Scholar]
- Archontis, V., Moreno-Insertis, F., Galsgaard, K., & Hood, A. W. 2005, ApJ, 635, 1299 [NASA ADS] [CrossRef] [Google Scholar]
- Archontis, V., Galsgaard, K., Moreno-Insertis, F., & Hood, A. W. 2006, ApJ, 645, L161 [NASA ADS] [CrossRef] [Google Scholar]
- Archontis, V., Hood, A. W., Savcheva, A., Golub, L., & Deluca, E. 2009, ApJ, 691, 1 [Google Scholar]
- Archontis, V., Tsinganos, K., & Gontikakis, C. 2010, A&A, 512, L2 [NASA ADS] [CrossRef] [EDP Sciences] [Google Scholar]
- Canou, A., & Amari, T. 2010, ApJ, 715, 1566 [NASA ADS] [CrossRef] [Google Scholar]
- Chen, P. F., & Shibata, K. 2000, ApJ, 545, 524 [Google Scholar]
- Démoulin, P., Mandrini, C. H., van Driel-Gesztelyi, L., et al. 2002, A&A, 382, 650 [NASA ADS] [CrossRef] [EDP Sciences] [Google Scholar]
- Fan, Y. 2001, ApJ, 554, L111 [NASA ADS] [CrossRef] [Google Scholar]
- Fan, Y. 2009, ApJ, 697, 1529 [NASA ADS] [CrossRef] [Google Scholar]
- Fan, Y. 2010, ApJ, 719, 728 [NASA ADS] [CrossRef] [Google Scholar]
- Feynman, J., & Martin, S. F. 1995, J. Geophys. Res., 100, 3355 [NASA ADS] [CrossRef] [Google Scholar]
- Galsgaard, K., Moreno-Insertis, F., Archontis, V., & Hood, A. 2005, ApJ, 618, L153 [NASA ADS] [CrossRef] [Google Scholar]
- Galsgaard, K., Archontis, V., Moreno-Insertis, F., & Hood, A. W. 2007, ApJ, 666, 516 [NASA ADS] [CrossRef] [Google Scholar]
- Gibson, S. E., & Fan, Y. 2006, ApJ, 637, L65 [NASA ADS] [CrossRef] [Google Scholar]
- Gibson, S. E., & Fan, Y. 2008, J. Geophys. Res. (Space Phys.), 113, 9103 [Google Scholar]
- Gilbert, H. R., Holzer, T. E., & Burkepile, J. T. 2001, ApJ, 549, 1221 [NASA ADS] [CrossRef] [Google Scholar]
- Gontikakis, C., Archontis, V., & Tsinganos, K. 2009, A&A, 506, L45 [NASA ADS] [CrossRef] [EDP Sciences] [Google Scholar]
- Hood, A. W., Archontis, V., Galsgaard, K., & Moreno-Insertis, F. 2009, A&A, 503, 999 [NASA ADS] [CrossRef] [EDP Sciences] [Google Scholar]
- Huang, J., Démoulin, P., Pick, M., et al. 2011, ApJ, 729, 107 [NASA ADS] [CrossRef] [EDP Sciences] [Google Scholar]
- Kliem, B., & Török, T. 2006, Phys. Rev. Lett., 96, 255002 [NASA ADS] [CrossRef] [PubMed] [Google Scholar]
- Liggett, M., & Zirin, H. 1985, Sol. Phys., 97, 51 [NASA ADS] [CrossRef] [Google Scholar]
- Liu, R., Liu, C., Park, S., & Wang, H. 2010, ApJ, 723, 229 [NASA ADS] [CrossRef] [Google Scholar]
- Machado, M. E., Moore, R. L., Hernandez, A. M., et al. 1988, ApJ, 326, 425 [NASA ADS] [CrossRef] [Google Scholar]
- MacTaggart, D., & Hood, A. W. 2009, A&A, 508, 445 [NASA ADS] [CrossRef] [EDP Sciences] [Google Scholar]
- Magara, T. 2001, ApJ, 549, 608 [NASA ADS] [CrossRef] [Google Scholar]
- Magara, T., & Longcope, D. W. 2001, ApJ, 559, L55 [NASA ADS] [CrossRef] [Google Scholar]
- Manchester, IV, W., Gombosi, T., DeZeeuw, D., & Fan, Y. 2004, ApJ, 610, 588 [NASA ADS] [CrossRef] [Google Scholar]
- Moore, R. L., & Roumeliotis, G. 1992, in IAU Colloq. 133: Eruptive Solar Flares, ed. Z. Svestka, B. V. Jackson, & M. E. Machado (Berlin: Springer Verlag), Lecture Notes in Physics, 399, 69 [Google Scholar]
- Moore, R. L., Sterling, A. C., Hudson, H. S., & Lemen, J. R. 2001, ApJ, 552, 833 [NASA ADS] [CrossRef] [Google Scholar]
- Moreno-Insertis, F., Galsgaard, K., & Ugarte-Urra, I. 2008, ApJ, 673, L211 [Google Scholar]
- Murray, M. J., Hood, A. W., Moreno-Insertis, F., Galsgaard, K., & Archontis, V. 2006, A&A, 460, 909 [NASA ADS] [CrossRef] [EDP Sciences] [Google Scholar]
- Murray, M. J., van Driel-Gesztelyi, L., & Baker, D. 2009, A&A, 494, 329 [NASA ADS] [CrossRef] [EDP Sciences] [Google Scholar]
- Rust, D. M., & Kumar, A. 1996, ApJ, 464, L199 [NASA ADS] [CrossRef] [Google Scholar]
- Schrijver, C. J. 2009, Adv. Space Res., 43, 739 [NASA ADS] [CrossRef] [Google Scholar]
- Shibata, K., Nozawa, S., & Matsumoto, R. 1992, PASJ, 44, 265 [NASA ADS] [Google Scholar]
- Svestka, Z. 1986, in The lower atmosphere of solar flares, Proc. Solar Maximum Mission Symposium, Sunspot, NM, Aug. 20−24, 1985 (A87-26201 10-92), Sunspot, NM, National Solar Observatory, ed. D. F. Neidig, 332 [Google Scholar]
- Török, T., & Kliem, B. 2005, ApJ, 630, L97 [Google Scholar]
- Török, T., Aulanier, G., Schmieder, B., Reeves, K. K., & Golub, L. 2009, ApJ, 704, 485 [NASA ADS] [CrossRef] [Google Scholar]
- van Ballegooijen, A. A., & Martens, P. C. H. 1989, ApJ, 343, 971 [NASA ADS] [CrossRef] [Google Scholar]
- van Driel-Gesztelyi, L., & Culhane, J. L. 2009, Space Sci. Rev., 144, 351 [Google Scholar]
- Wang, Y.-M. & Sheeley, Jr., N. R. 1999, ApJ, 510, L157 [NASA ADS] [CrossRef] [Google Scholar]
- Williams, D. R., Török, T., Démoulin, P., van Driel-Gesztelyi, L., & Kliem, B. 2005, ApJ, 628, L163 [NASA ADS] [CrossRef] [Google Scholar]
- Yokoyama, T., & Shibata, K. 1994, ApJ, 436, L197 [NASA ADS] [CrossRef] [Google Scholar]
- Yokoyama, T., & Shibata, K. 1995, Nature, 375, 42 [NASA ADS] [CrossRef] [Google Scholar]
- Zwaan, C. 1985, Sol. Phys., 100, 397 [NASA ADS] [CrossRef] [Google Scholar]
All Figures
|
Fig. 1 Left: stratification of the background atmosphere (temperature (T), density (ρ), gas pressure (Pg)) and the initial magnetic field distribution ((Pm) is the magnetic pressure) at t = 0. Middle: the colored contours show the distribution of the vertical component of the magnetic field at the photosphere (yellow is positive and blue is negative). The blue and red field lines represent the outer and inner-most field lines of the emerging tube. The white field lines belong to the pre-existing field. The direction of the field lines is shown by the arrows. In this case, the two fields into contact are almost anti-parallel. Right: the same for an experiment where the field lines are at an angle of about Φ = 90. At this time of evolution, efficient reconnection has not started yet. |
| In the text | |
|
Fig. 2 Left: the colored contours show By at the vertical midplane (y = 0), in an experiment without ambient field. The arrows show the projection of the magnetic field vector onto the midplane. Also shown (with green lines) is the axis of the original flux tube, the internal reconnection site, the central part of the new flux rope and the outskirts of the envelope magnetic field. Right: height-time profiles of the rising rope for experiments with different twist: α = 0.2 (dotted line), α = 0.3 (dashed line), α = 0.4 (solid line), α = 0.5 (dotted-dashed line). |
| In the text | |
|
Fig. 3 Top-left: height-time profiles of the apex of the envelope fields (upper lines) and the center of the erupting ropes (lower lines): α = 0.3 (dashed line) and α = 0.4 (solid line). Bottom-left: the rising velocity, Vz, of the center of the rope: α = 0.3 (dashed line) and α = 0.4 (dotted line). Top-right: the spatial distribution of the vertical component of the forces for α = 0.3 and t = 43.3 min: magnetic pressure force (denoted by Pm), tension force (denoted by T), |
| In the text | |
|
Fig. 4 Top: a close-up of the total force distribution along height, for α = 0.3, t = 43.3 min (solid line) and for α = 0.4, t = 48.3 min (dashed line). Middle: the same for the −∇Pg − ρg force. Bottom: the density distribution along height, for the same α and times as above. The vertical dashed line shows the location of the axis of the rope. |
| In the text | |
|
Fig. 5 Top-left: the spatial distribution of the vertical component of the forces for α = 0.4 and t = 60 min: total force (solid line), Lorentz force (dotted line) and −∇Pg − ρg force (dashed line). The dashed vertical line marks the position of the flux rope’s axis. Bottom-left: the same for α = 0.3 and t = 51.6 min. Top-right: close-up of the total force distribution for the two experiments: α = 0.4, t = 60 min (solid line) and α = 0.3, t = 51.6 min (dashed line). Bottom-right: density distribution, ρ(0,0,z), along height for the same experiments and times: α = 0.4 (solid line) and α = 0.3 (dashed line). |
| In the text | |
|
Fig. 6 Top: height-time profiles of the erupting rope when there is no ambient field (solid line) and when there is a parallel horizontal magnetic field (dashed line) with Bamb = 1.3 G. In both experiments α = 0.4. Middle: height-time profiles of the erupting rope for different contact angles. Bottom: the same for Φ = 180 (solid lines) and Φ = 270 (dashed lines). The value of the ambient magnetic field is Bamb = 1.3 G (thick lines) and Bamb = 0.91 G (thin lines). |
| In the text | |
|
Fig. 7 Top: the velocity of the center of the erupting ropes for different Φ. Middle: temporal evolution of Vz at the center of the rope (solid line) and at the crest of the envelope field (dashed). Φ = 180. Bottom: maximum value of Vz, of the internal reconnection jet. Φ = 180. |
| In the text | |
|
Fig. 8 Left column: vertical velocity at the xz-midplane, in the Φ = 90 case. Right column: density for the same experiment. |
| In the text | |
|
Fig. 9 Left column: 3D visualization of the eruption of the dense plasma through the solar atmosphere. The yellow isosurface represents dense material from the transition region. Only heights above z = 6.8 Mm are considered for the visualization of the isosurfaces. Field lines are shown in blue color. Right column: the same evolution, as viewed from above. |
| In the text | |
|
Fig. 10 3D configuration of the field lines of the emerging field (blue and red) and the ambient field (white). The colored contours show the photospheric distribution of Bz (yellow is positive and blue is negative). The arrows show the direction of the fieldlines. Three cases are shown: oblique with Φ1 = 30 (left), vertical with Φ1 = 90 (middle) and oblique with Φ1 = 150 (right). The three panels have been chosen to display an illustration of the reconnection between emerging and ambient field lines. Times are different, but they correspond to a similar stage of evolution of the system in each experiment. |
| In the text | |
|
Fig. 11 Top: height-time profiles of the erupting ropes for Φ1 = 150 (dashed), Φ1 = 90 (solid) and Φ1 = 30 (dot-dashed). Middle: the evolution of the rising velocity of the erupting ropes for the three cases. Bottom: the height-time profiles of all the experiments for Φ (solid) and Φ1 (dot-dashed). From left to right: Φ = 180,270,90 and Φ1 = 150,90,30. |
| In the text | |
|
Fig. 12 Left column: distribution of density at the xz-midplane, Φ1 = 90. Right column: the same for Φ1 = 150. The arrows show the projection of the full magnetic field vector into the plane. Also shown is the emerging flux region (EFR) and the reconnection loops, on the right-hand side of the EFR (top panels). |
| In the text | |
|
Fig. 13 A cartoon sketch representing the process of emergence and reconnection (internal and external) that leads to the eruption of a flux rope. |
| In the text | |
|
Fig. 14 Left: time evolution of the magnetic fluxes in the case with no ambient field. Right: the same for the case with Φ = 180. |
| In the text | |
Current usage metrics show cumulative count of Article Views (full-text article views including HTML views, PDF and ePub downloads, according to the available data) and Abstracts Views on Vision4Press platform.
Data correspond to usage on the plateform after 2015. The current usage metrics is available 48-96 hours after online publication and is updated daily on week days.
Initial download of the metrics may take a while.