Fig. 2
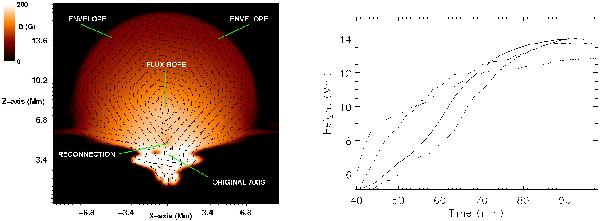
Left: the colored contours show By at the vertical midplane (y = 0), in an experiment without ambient field. The arrows show the projection of the magnetic field vector onto the midplane. Also shown (with green lines) is the axis of the original flux tube, the internal reconnection site, the central part of the new flux rope and the outskirts of the envelope magnetic field. Right: height-time profiles of the rising rope for experiments with different twist: α = 0.2 (dotted line), α = 0.3 (dashed line), α = 0.4 (solid line), α = 0.5 (dotted-dashed line).
Current usage metrics show cumulative count of Article Views (full-text article views including HTML views, PDF and ePub downloads, according to the available data) and Abstracts Views on Vision4Press platform.
Data correspond to usage on the plateform after 2015. The current usage metrics is available 48-96 hours after online publication and is updated daily on week days.
Initial download of the metrics may take a while.