Free Access
Fig. 12
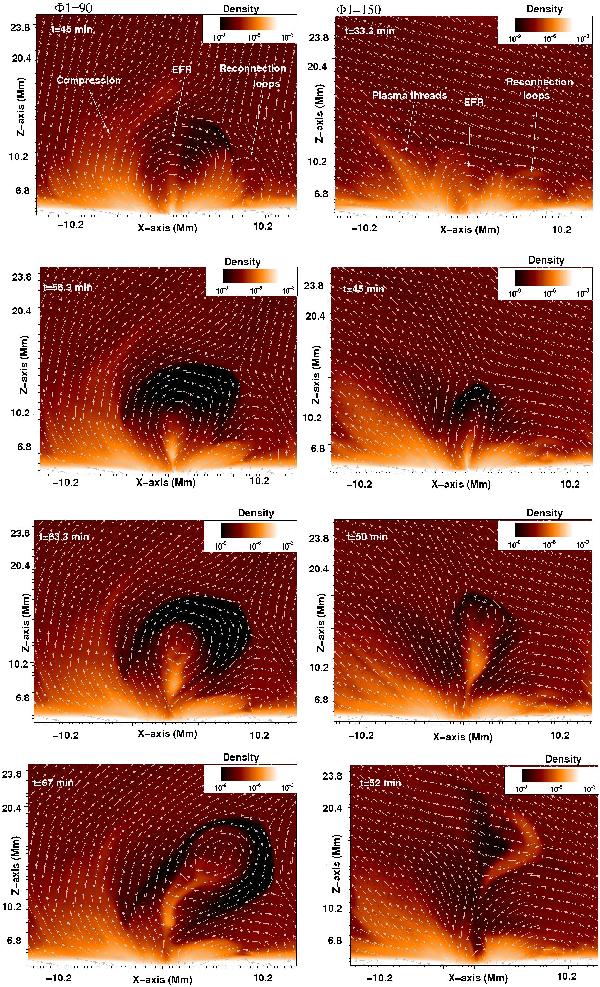
Left column: distribution of density at the xz-midplane, Φ1 = 90. Right column: the same for Φ1 = 150. The arrows show the projection of the full magnetic field vector into the plane. Also shown is the emerging flux region (EFR) and the reconnection loops, on the right-hand side of the EFR (top panels).
Current usage metrics show cumulative count of Article Views (full-text article views including HTML views, PDF and ePub downloads, according to the available data) and Abstracts Views on Vision4Press platform.
Data correspond to usage on the plateform after 2015. The current usage metrics is available 48-96 hours after online publication and is updated daily on week days.
Initial download of the metrics may take a while.