Fig. 3
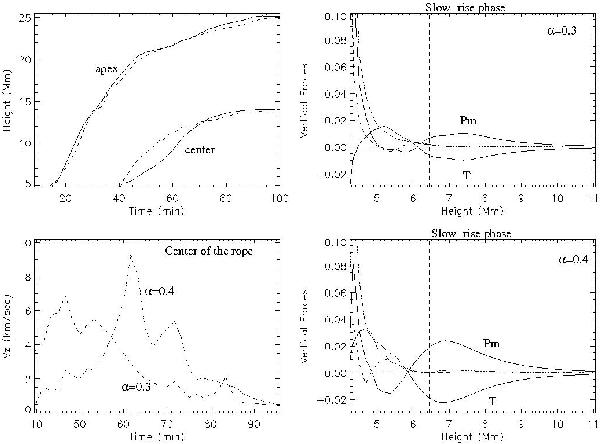
Top-left: height-time profiles of the apex of the envelope fields (upper lines) and the center of the erupting ropes (lower lines): α = 0.3 (dashed line) and α = 0.4 (solid line). Bottom-left: the rising velocity, Vz, of the center of the rope: α = 0.3 (dashed line) and α = 0.4 (dotted line). Top-right: the spatial distribution of the vertical component of the forces for α = 0.3 and t = 43.3 min: magnetic pressure force (denoted by Pm), tension force (denoted by T),  force (dashed line) and total force (dotted-dashed line). Bottom-right: as above, for α = 0.4 and t = 48.3 min. The vertical dashed line shows the location of the axis of the rope.
Current usage metrics show cumulative count of Article Views (full-text article views including HTML views, PDF and ePub downloads, according to the available data) and Abstracts Views on Vision4Press platform.
Data correspond to usage on the plateform after 2015. The current usage metrics is available 48-96 hours after online publication and is updated daily on week days.
Initial download of the metrics may take a while.