Fig. 5
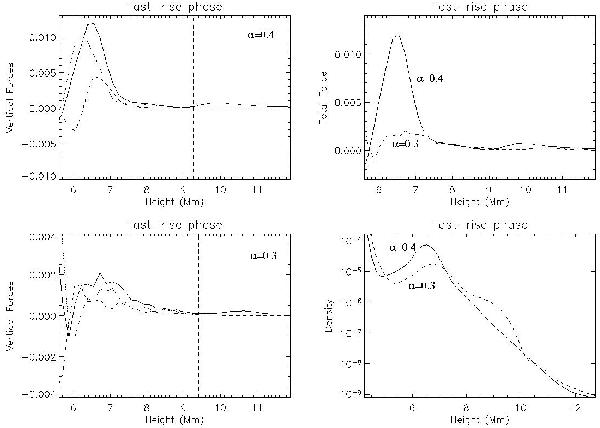
Top-left: the spatial distribution of the vertical component of the forces for α = 0.4 and t = 60 min: total force (solid line), Lorentz force (dotted line) and −∇Pg − ρg force (dashed line). The dashed vertical line marks the position of the flux rope’s axis. Bottom-left: the same for α = 0.3 and t = 51.6 min. Top-right: close-up of the total force distribution for the two experiments: α = 0.4, t = 60 min (solid line) and α = 0.3, t = 51.6 min (dashed line). Bottom-right: density distribution, ρ(0,0,z), along height for the same experiments and times: α = 0.4 (solid line) and α = 0.3 (dashed line).
Current usage metrics show cumulative count of Article Views (full-text article views including HTML views, PDF and ePub downloads, according to the available data) and Abstracts Views on Vision4Press platform.
Data correspond to usage on the plateform after 2015. The current usage metrics is available 48-96 hours after online publication and is updated daily on week days.
Initial download of the metrics may take a while.