Fig. 9
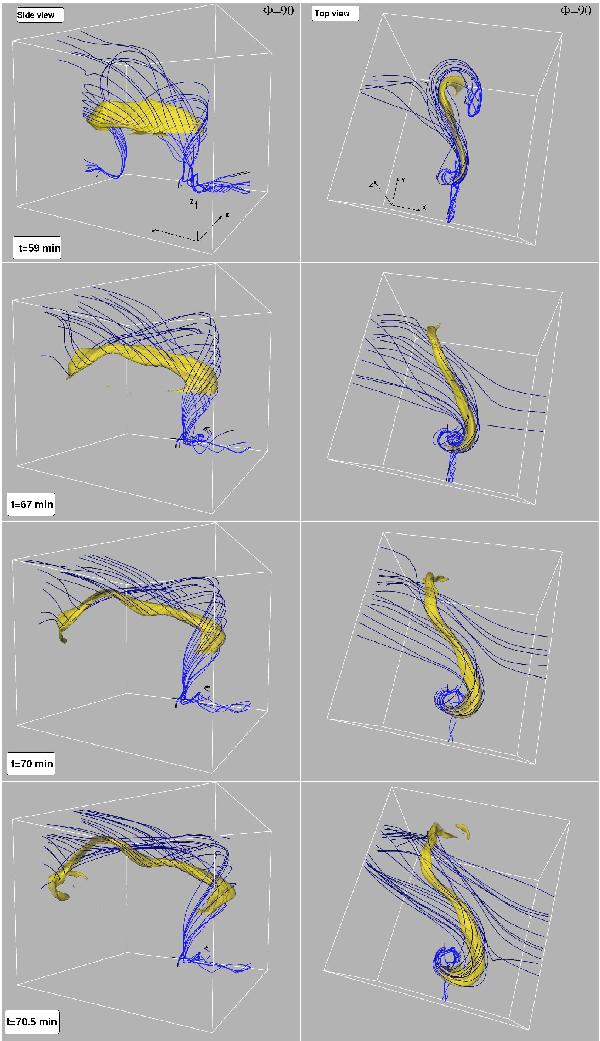
Left column: 3D visualization of the eruption of the dense plasma through the solar atmosphere. The yellow isosurface represents dense material from the transition region. Only heights above z = 6.8 Mm are considered for the visualization of the isosurfaces. Field lines are shown in blue color. Right column: the same evolution, as viewed from above.
Current usage metrics show cumulative count of Article Views (full-text article views including HTML views, PDF and ePub downloads, according to the available data) and Abstracts Views on Vision4Press platform.
Data correspond to usage on the plateform after 2015. The current usage metrics is available 48-96 hours after online publication and is updated daily on week days.
Initial download of the metrics may take a while.