| Issue |
A&A
Volume 535, November 2011
|
|
|---|---|---|
| Article Number | A93 | |
| Number of page(s) | 20 | |
| Section | Extragalactic astronomy | |
| DOI | https://doi.org/10.1051/0004-6361/201117420 | |
| Published online | 17 November 2011 | |
The X-ray emission of local luminous infrared galaxies⋆
1 Departamento de Astrofísica, Centro de Astrobiología, CSIC/INTA, Carretera de Torrejón a Ajalvir, km 4, 28850 Torrejón de Ardoz, Madrid, Spain
e-mail: This email address is being protected from spambots. You need JavaScript enabled to view it.
2 XMM-Newton Science Operation Centre, European Space Agency, 28691 Villanueva de la Cañada, Madrid, Spain
3 Instituto de Astronomía, Universidad Nacional Autónoma de México, Apartado Postal 70-264, 04510 Mexico DF, México
4 MIT Kavli Institute for Astrophysics and Space Research, 77 Massachusetts Avenue, NE80-6011, Cambridge, MA 02139, USA
5 Steward Observatory, University of Arizona, 933 North Cherry Avenue, Tucson, AZ 85721, USA
6 Department of Physics, Durham University, South Road, Durham, DH1 3LE, UK
Received: 6 June 2011
Accepted: 5 September 2011
Abstract
We study the X-ray emission of a representative sample of 27 local luminous infrared galaxies (LIRGs). The median IR luminosity of our sample is log LIR/L⊙ = 11.2, therefore the low-luminosity end of the LIRG class is well represented. We used new XMM-Newton data as well as Chandra and XMM-Newton archive data. The soft X-ray (0.5–2 keV) emission of most of the galaxies (>80%), including LIRGs hosting a Seyfert 2 nucleus, is dominated by star-formation-related processes. These LIRGs follow the star-formation rate (SFR) versus soft X-ray luminosity correlation observed in local starbursts. We find that ~15% of the non-Seyfert LIRGs (3 out of 20) have an excessively hard X-ray emission relative to that expected from star-formation, which might indicate the presence of an obscured AGN. The rest of the non-Seyfert LIRGs follow the SFR versus hard X-ray (2–10 keV) luminosity correlation of local starbursts. The non-detection of the 6.4 keV Fe Kα emission line in the non-Seyfert LIRGs allows us to put an upper limit on the bolometric luminosity of an obscured AGN, Lbol <1043 erg s-1. That is, if these galaxies were hosting a low-luminosity AGN, its contribution to the total luminosity would be less than 10%. Finally we estimate that the AGN contribution to the total luminosity for our sample of local LIRGs is between 7% and 10%.
Key words: galaxies: active / galaxies: starburst / X-ray: galaxies
Appendices are available in electronic form at http://www.aanda.org
© ESO, 2011
1. Introduction
Luminous infrared galaxies (LIRGs) are galaxies with infrared (IR) luminosities (LIR = L8 − 1000 μm) from 1011 to 1012 L⊙. They are powered by star-formation and/or an active galactic nucleus (AGN; see Sanders & Mirabel 1996 for a review). Together with ultraluminous infrared galaxies (ULIRGs; LIR > 1012 L⊙), they are the major contributors to the star-formation rate (SFR) density at z ~ 1–2 (Pérez-González et al. 2005; Le Floc’h et al. 2005; Caputi et al. 2007).
The star-formation in local LIRGs is distributed over few kpc scales (Alonso-Herrero et al. 2006; Hattori et al. 2004; Rodríguez-Zaurín et al. 2011). This is similar to local starbursts and z ~ 2 infrared bright galaxies (Daddi et al. 2007; Rigby et al. 2008; Farrah et al. 2008; Rujopakarn et al. 2010), but at odds with local ULIRGs where most of the activity is taking place in very compact regions (the central kpc). Similarly, the fraction of AGN-dominated local ULIRGs increases with increasing IR luminosity. About 40% of the ULIRGs are classified as Seyfert (Veilleux et al. 1995; Kim et al. 1998). This motivates the study of local LIRGs because they might be scaled-down versions of more distant IR-bright galaxies.
The X-ray emission of starburst galaxies is mainly produced by high-mass X-ray binaries (HMXB), supernova remnants (SNR), O stars and hot gas heated by the energy that originated in supernova explosions (Persic & Rephaeli 2002; Fabbiano 2006). The hard X-ray (2–10 keV) emission is dominated by HMXBs, although the contribution of hot gas (kT > 3 keV) heated by supernovae may dominate the hard X-ray emission for the most intense starbursts (Strickland & Heckman 2009; Iwasawa et al. 2011; Colina et al. 2011, submitted). On the other hand, the soft part of the X-ray emission (0.5–2 keV) emission is mostly produced by gas at kT ~ 0.3–0.7 keV.
It has been shown that there is a good correlation between the hard X-ray luminosity and the SFR for local starbursts (e.g., Ranalli et al. 2003; Grimm et al. 2003; Persic et al. 2004). However, the contribution to the hard X-ray luminosity from low-mass X-ray binaries (LMXB), which is not related to the current SFR, is not always negligible. For instance Colbert et al. (2004) and Lehmer et al. (2010) estimated that the LMXB contribution is significant for galaxies with low SFR/M ⋆ . It should be noted that the X-ray emission of a star-formation burst is delayed with respect to other SFR tracers. Consequently, an evolution with time is expected in the X-ray emission of the star-forming galaxies (Mas-Hesse et al. 2008; Rosa González et al. 2009). This evolution might explain part of the scatter in the X-ray luminosity vs. SFR correlations.
According to their IR luminosity, the SFR of LIRGs ranges from ~20 to 200 M⊙ yr-1 (Kennicutt 1998). Therefore strong X-ray emission (~1041 erg s-1) associated to star-formation is expected from these galaxies. The AGN contribution to the X-ray emission of LIRGs is expected to be low. Pure Seyfert AGN emission is detected in ~15% of the LIRGs using optical spectroscopy (Kim et al. 1998), however a dust-embedded AGN could be present in some of the them. Thanks to X-ray observations of LIRGs we are able to determine whether an obscured AGN is present, or, in the case of non-detection, set an upper limit to the AGN contribution.
Previous studies of the X-ray emission produced by star-formation have been focused on nearby starbursts (e.g., Ptak et al. 1999; Jiménez-Bailón et al. 2003; Ranalli et al. 2003; Grimm et al. 2003; Persic et al. 2004; Colbert et al. 2004) or ULIRGs (e.g., Rieke 1988; Perez-Olea & Colina 1996; Ptak et al. 2003; Franceschini et al. 2003; Teng et al. 2005; Teng & Veilleux 2010).
Although there is a number of papers on individual LIRGs (e.g., Lira et al. 2002; Blustin et al. 2003; Jenkins et al. 2004, 2005; Levenson et al. 2004, 2005; Miniutti et al. 2007), there are few studies of the X-ray properties of LIRGs as a class (e.g., Risaliti et al. 2000; Lehmer et al. 2010; Iwasawa et al. 2011). Risaliti et al. (2000) studied a sample of 78 objects, biased toward Seyfert LIRGs (90%). They concluded that many of the sources might be completely Compton-thick (NH > 1025). Using an unbiased subsample of LIRGs, they found that ~60% of the LIRGs host AGN although they are weak or heavily obscured. More recently, Iwasawa et al. (2011) carried out a study of the most luminous local IR galaxies (11.7 < log LIR/L⊙ < 12.5). About 50% of them are likely to contain an AGN, increasing the fraction of AGN sources with increasing LIR. The authors found that their non-AGN galaxies have lower hard X-ray luminosities than expected from the local starbursts hard X-ray vs. SFR correlation. They suggested that the hard X-ray emission of these (U)LIRGs is dominated by hot gas and not by HMXBs as in local starbursts.
In this paper we present a study of a sample of 27 local LIRGs (median log LIR/L⊙ = 11.2) observed with XMM-Newton and Chandra. The sample is described in Sect. 2. In Sect. 3 we describe the X-ray data reduction. In Sects. 4 and 5 we present the spatial and spectral analysis of the X-ray data. The properties of the X-ray emission produced by star-formation and AGN-related processes are discussed in Sects. 6 and 7 respectively. Section 8 summarizes the main conclusions.
Throughout this paper we assume a flat cosmology with H0 = 70 km s-1 Mpc-1, ΩM = 0.3 and ΩΛ = 0.7.
2. The sample of LIRGs
2.1. Definition of the sample
Our sample of LIRGs contains 27 galaxies with XMM-Newton or Chandra data drawn from the volume-limited sample of local LIRGs (40 Mpc < d < 75 Mpc) of Alonso-Herrero et al. (2006). The Alonso-Herrero et al. (2006) sample was selected from the the IRAS Revised Bright Galaxy Sample (RBGS; Sanders et al. 2003)1 to have 2750 < vhel (km s-1) < 5200 and 11.05 < log LIR/L⊙ < 11.88. These criteria were imposed to allow for narrow-band observations of the Paα emission line with the NICMOS instrument on the HST. More details about the parent sample are given in Alonso-Herrero et al. (2006). Additionally we extended the Alonso-Herrero et al. (2006) sample to include all the galaxies in the IRAS RBGS that fulfill their selection criteria but were not included in their sample (mostly optically classified Seyfert galaxies, see Alonso-Herrero et al. 2011).
In Fig. 1 we compare the LIR distribution (adapted to the cosmology used throughout this paper) of our sample with that of the extended Alonso-Herrero et al. (2006) sample. The Kolmogorov-Smirnov two-sample test shows that it is not possible to reject (p > 0.49) that both samples come from the same distribution. According to their nuclear activity classification2, 44 ± 10% and 46 ± 13% are H II-type in the parent sample and in our sample respectively. On the other hand, Seyfert galaxies represent 22 ± 7% of the parent sample and 27 ± 10% of our sample. That is, our X-ray sample is not biased toward active galaxies. Therefore these 27 galaxies constitute a representative sample of the local LIRGs in terms of both IR luminosity and nuclear activity. The median log LIR/L⊙ of the sample is 11.2, thus low luminosity LIRGs are satisfactorily represented. The selected galaxies are listed in Table 1.
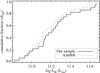 |
Fig. 1 Comparison of the cumulative galaxy distributions as a function of the LIR of our sample of LIRGs and the extended parent sample (AAH06; see Sect. 2.1). |
The sample of local LIRGs.
2.2. Star-formation rate and stellar mass
The IR luminosity in bright-IR galaxies is produced by dust heated by massive young stars. The dust absorbs a large part ( > 90% for LIRGs, Buat et al. 2007) of the UV light from these stars that is re-emitted as thermal radiation in the mid- and far-IR. The IR luminosity accordingly is a good tracer of the SFR for these galaxies (see Kennicutt 1998 for review). We note, however, that the far-IR luminosity may also include the emission of a cooler dust component that is heated by the interstellar radiation field and is not related with the current SFR. To minimize the contribution of the cooler dust, we used the Spitzer/MIPS 24 μm luminosity instead of the LIR, which includes longer wavelengths, to estimate the SFR. Moreover, the better spatial resolution of the Spitzer/MIPS 24 μm data, compared with IRAS, allowed us to separate the individual galaxy emission of interacting systems. We used the SFR calibration of Rieke et al. (2009): 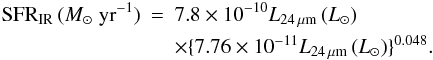 (1)For this calibration Rieke et al. (2009) assumed a Kroupa (2001) initial mass function (IMF) over the stellar mass range from 0.08 to 100 M⊙. A correction to account for the leaked UV light from young stars is included in the calibration. Alonso-Herrero et al. (2011) estimated the AGN contribution at 24 μm in these LIRGs. The authors decomposed their Spitzer/IRS mid-IR spectra into AGN and starburst components using clumpy torus models and star-forming galaxy templates. We used these estimates to subtract the AGN luminosity at 24 μm before calculating the obscured SFR. The AGN fractions and the calculated SFRIR are listed in Table 2.
Some galaxies were observed with the XMM-Newton optical monitor (OM) in the UVW2 band (2120 Å, see Sect. 3). We corrected the observed UV flux from Galactic extinction using the Fitzpatrick (1999) extinction curve and the Galactic color excess, E(B–V), from the NASA Extragalactic Database (NED). For these galaxies we compared the SFR derived from the UV continuum with that from the IR luminosity. Assuming a flat continuum in Lν in the UV range (1500–2800 Å) and scaling to a Kroupa IMF, the SFRUV can be expressed as  (2)where Lν is the UV continuum luminosity (Kennicutt 1998).
The SFRIR/SFRUV ratio ranges from ~2–115 for our LIRGs. This corresponds to an UV leakage from 1 to 30% of the total luminosity if the IR and the UV emissions trace the same stellar populations. This agrees well with the ratio expected for LIRGs (Buat et al. 2007).
To estimate the stellar mass of the galaxies, we used the integrated J-, H-, and K-band near-IR magnitudes from the Two Micron All Sky Survey (2MASS) large galaxy atlas (Jarrett et al. 2003) and the 2MASS extended source catalog (Jarrett et al. 2000). The near-IR emission is well-suited to calculate the stellar mass because the contribution from young stars is usually negligible and the scatter in the mass-to-light ratio is relatively small (~0.4 dex). Following Bell & de Jong (2001), we used the K-band luminosity together with the J − H color to obtain the stellar mass. We adjusted the normalization for the Kroupa IMF: 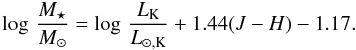 (3)The SFRs, IR/UV ratios and stellar masses for our sample are listed in Table 2.
Galaxy properties.
3. X-ray observations
3.1. XMM-Newton observations and data reduction
We obtained new XMM-Newton data for nine galaxies (proposals 55046 and 60160). We also found in the XMM-Newton archive X-ray data for 12 more galaxies. Our proposal was focused on galaxies classified as H II galaxies based on their optical spectra, whereas most of the galaxies from the archive are active galaxies (Seyfert and LINER activity). The observation IDs and effective exposure times are shown in Table 3. The analysis of the Chandra X-ray data for the other six galaxies in our sample is taken from the literature (see Sect. 3.2).
Log of the XMM-Newton observations.
We reduced the observation data files (ODF) using SAS version 10.0.2. First we used the SAS epproc and emproc tasks to generate the calibrated event files from the raw European Photon Imaging Camera (EPIC) pn and MOS data respectively. A circular aperture (d ~ 15 ′′ depending on the source extent) was used to extract the spectra of the galaxies. We estimated the backgrounds from a region close to the source in the same CCD and free of any contaminating source. The background regions were ~4–5 times larger than the aperture used for the galaxies. Then we created the background and background + source light-curves that we used to filter out high-background periods. The background count rate threshold was chosen to just filter out those high-background periods that would not increase the signal-to-noise (S/N) ratio of the source (see Appendix A of Piconcelli et al. 2004). For the pn data we considered single and double pixel events (PATTERN ≤ 4). We rejected events close to the CCD borders or to bad pixels (#XMMEA_EP). For the MOS we also considered triple and quadruple pixel events (PATTERN ≤ 12) and we used the recommended expression (#XMMEA_EM) to filter the events. The energy redistribution matrices were generated with rmfgen and arfgen. We rebinned the combined MOS spectrum (MOS1 and MOS2 spectra) and the pn spectrum to obtain at least 20 counts in each spectral bin using grppha. Likewise we obtained X-ray images of the galaxies using the pn calibrated event files.
Owing to the low number of counts in the Reflection Grating Spectrometer (RGS) data we could only extract the RGS spectra for a few galaxies: NGC 3256, MCG−03-34-064, and NGC 7469. The spectra of MCG−03-34-064 and NGC 7469 are analyzed in detail by Miniutti et al. (2007) and Blustin et al. (2003), respectively.
Simultaneously with the X-ray observations we obtained optical and UV images of the galaxies using the XMM-Newton/OM with all available filters (V 5430 Å, B 4500 Å, U 3440 Å, UVW1 2910 Å, UVM2 2310 Å, and UVW2 2120 Å). We used the SAS script omichain for the data reduction. This script processes the OM ODF files and produces calibrated images taking into account the telescope tracking information and the flat-fielding corrections. For some filters there was more than one exposure that we combined to increase the S/N ratio. Then we used aperture photometry to measure the fluxes. We estimated the background from the image with special care to avoid artifacts in the images such as smoke rings, etc. (see the XMM-Newton/OM Calibration Status document). We corrected the count rate for the detector sensitivity degradation and coincidence loss. The count rates were converted into Jy using the conversion factors given in the XMM-Newton/OM Calibration Status document.
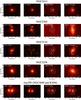 |
Fig. 2 XMM-Newton/EPIC pn 0.5–2 keV and 2–7 keV images (first and second panels), XMM-Newton/OM UVW2 (2120 Å) images for the galaxies observed with this filter (third panel). The third panel of Arp299 and MCG+04-48-002 corresponds to the XMM-Newton/OM UVM2 (2310 Å) filter. Spitzer/IRAC 3.6 μm images (forth panel). For reference we represent in the third and forth panels the smoothed 0.5–7 keV contours. The white line in the right panels represents 5 kpc at the distance of the galaxy. All images are shown in a square root scale. North is up and east is to the left. |
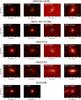 |
Fig. 2 continued. |
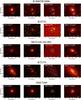 |
Fig. 2 continued. |
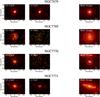 |
Fig. 2 continued. |
3.2. Chandra data from the literature
We found in the literature (Levenson et al. 2004, 2005; Lehmer et al. 2010) Chandra X-ray data for another six galaxies (two Seyfert 2 galaxies, two composite, one H II, and one without classification; see Table 1). For these galaxies we used the published galaxy-integrated X-ray fluxes (Table 4).
Galaxies taken from the literature.
4. Spatial analysis of the XMM-Newton data
4.1. Morphologies
We obtained X-ray images of these LIRGs as described in Sect. 3.1. Figure 2 shows the soft (0.5–2 keV) and hard (2–7 keV) X-ray images for the LIRGs together with the XMM-Newton/OM UV (2120 Å) and near-IR Spitzer/IRAC (3.6 μm) images for comparison.
In our sample of LIRGs we find different X-ray emission morphologies. Most of them are dominated by the nuclear emission and appear as point-like (or slightly resolved) sources at the XMM-Newton angular resolution, 4–6 arcsec. At the distances of these LIRGs this corresponds to 0.9–2 kpc. Six galaxies (NGC 3110, NGC 3256, NGC 5734, NGC 5743, IC 5179, and NGC 7769), ~20% of the sample, show extended soft X-ray emission. This indicates that at least some of the sources responsible for the origin of the X-ray emission (X-ray binaries, SNR, diffuse hot plasma, etc.) are extended over several kpc ( > 1 kpc). Higher angular resolution images with Chandra of LIRGs confirm that the X-ray emission comes from multiple point sources as well as from diffuse emission distributed over the galaxies (Zezas et al. 2003; Levenson et al. 2004, 2005; Lehmer et al. 2010).
The S/N ratio in the hard XMM-Newton X-ray band (2–10 keV) of the H II galaxies is too low to measure the size of the X-ray emitting region accurately. The only exception is NGC 3256, which appears approximately as extended as its soft X-ray emission. The higher spatial resolution Chandra X-ray images of NGC 3256 reveal that both the soft and hard X-ray emissions are resolved into multiple point sources, besides the two nuclei, and diffuse emission (Lira et al. 2002).
The hard X-ray emission of the Seyfert galaxies is dominated by the AGN, consequently they appear as point sources in this energy range.
4.2. Extranuclear sources
In two LIRGs observed with XMM-Newton (NGC 2369 and NGC 7771) we find bright extranuclear X-ray sources that might be ultraluminous X-ray sources (ULXs). Note that we can only isolate such X-ray sources if they are located more than 0.9–2 kpc away from the nucleus owing to the spatial resolution of the images. That is, ULXs may exist in the rest of the sample within the central 0.9–2 kpc.
The two sources located at either side of the nucleus of NGC 7771 (NGC 7771 X-1 and NGC 7771 X-2) were studied by Jenkins et al. (2005). The spectra of both sources are well-fitted with an absorbed power-law (Γ = 1.6 and 1.7) plus a soft component (thermal plasma at 0.3 keV and a blackbody disk at 0.2 keV). The unabsorbed luminosities ( ) of these sources are 1.7 ± 1.0 × 1040 erg s-1 and 1.4 ± 0.8 × 1040 erg s-1.
The ULX candidate in NGC 2369 is located 25 arcsec (~5 kpc) to the north of the nucleus (NGC 2369 X-1 at RA (J2000) = 7:16:38.5 Dec (J2000) = –62:20:16). An absorbed power-law model reproduces the observed spectrum of this source well (χ2/d.o.f. = 31/42, Fig. 3) and implies an intrinsic X-ray luminosity  erg s-1. This is one order of magnitude higher than the ULX luminosity threshold (
 erg s-1) and comparable to the luminosities measured for other ULXs. The parameters of the model (Γ = 1.6 ± 0.2 and NH = 1.3 ± 0.5 × 1021 cm-2) are also similar to those obtained for other ULXs (Swartz et al. 2004). The angular resolution of the XMM-Newton data does not allow us to determine if this emission comes from a single source (i.e., ULX or a background AGN) or, conversely, if it is the integrated emission from multiple sources. NGC 2369 X-1 is coincident with an extended UV emitting region that seems to be located in the spiral arms of NGC 2369 (Fig. 2). Therefore the background AGN possibility is unlikely. The SFR of this region derived from their UV and IR luminosities3 is 0.9 M⊙ yr-1 (see Sect. 2.2). Accordingly the expected hard X-ray luminosity from star-formation (~2.3 × 1039 erg s-1, see Sect. 6) is ~10 times lower than the observed luminosity. Moreover, no excess soft X-ray emission from hot (~0.7 keV) gas, which is common in star-forming regions, is detected in its spectra (Fig. 3). All these pieces of evidence suggest that the X-ray emission of NGC 2369 X-1 is dominated by a single bright source.
5. Spectral analysis of the XMM-Newton data
At 60 Mpc (typical distance of these LIRGs) the XMM-Newton spatial resolution (6 ′′) corresponds to 1.7 kpc. This means that we are not able to resolve individual emitting sources. Instead, the XMM-Newton spectra of these LIRGs probably include the emission from X-ray binaries (low- and high-mass), SNRs and diffuse hot plasma. An AGN may be present as well. Therefore, we would ideally include one component for each in the X-ray model. However, this is not possible because (1) it is complicated to determine the characteristic spectrum of these objects and even more complicated to determine the characteristic integrated spectrum of these objects in a galaxy; and (2) the S/N ratio of our data is not sufficiently high to obtain statistically meaningful results with a very complex model. We used the XSPEC package (version 12.5) to fit the EPIC MOS and pn spectra simultaneously. The RGS data of the three galaxies with sufficient counts (see Sect. 3.1) are compatible with the fit obtained using just the EPIC data. Adding the RGS data does not improve the constraints on the model parameters significantly. Consequently, the RGS data are not used in the spectral analysis. The fits of some individual sources are discussed in Appendix A.
5.1. The X-ray spectra of star-forming galaxies
We fitted the spectra of the star-forming galaxies using a simple model consisting of a soft thermal plasma (mekal) plus an absorbed power-law. The absorption of the thermal plasma component is not well constrained and it is compatible with no absorption for most of the galaxies. It was only necessary in the fit of the NGC 3256 and NGC 3690 spectra. The thermal plasma represents the soft X-ray emitting gas heated by SN shocks, whereas the power-law reproduces the observed hard X-ray continuum produced by X-ray binaries and/or AGN. We also added the absorption caused by the Galactic hydrogen column density to the model (Kalberla et al. 2005). The absolute value of the plasma metallicity is not well constrained for our relatively low S/N ratio spectra. However, the [Fe/O]ratio can be determined because the most prominent spectral features in the soft X-ray range are produced by these elements (the Fe L-shell and the O K-shell). Consequently, the plasma abundances were fixed to the solar values except for the Fe abundance. The latter was left as a free parameter to calculate the [Fe/O] ratio. It should be noted that a degeneracy exists between the plasma abundances and temperatures. This model provides a reasonable fit to the data ( ) for most of the galaxies. We included a Gaussian line when a Fe Kα emission line was present in the spectrum (NGC 3256, NGC 3690, and IC 694). For those galaxies with undetected 6.4 keV emission line we calculated the upper limits for a narrow emission line. Figure 4 shows the observed X-ray spectra together with the model for all galaxies with XMM-Newton data.
The parameters of the fits are listed in Table 5. The typical values of the model parameters are Γ ~ 1.3–2.2, NH ~ 1 × 10²¹–5 × 1021 cm-2, kT ~ 0.5–0.7 keV and [Fe/O] ~ − 0.5– − 0.1. The measured NH corresponds to AV ~ 0.5–2.3 mag using the Güver & Özel (2009) conversion factor. In general, the X-ray derived absorption is lower than that obtained from the near-IR colors (~3 mag) and the Paα/Hα ratio (~2–5 mag) for these galaxies (Alonso-Herrero et al. 2006). The temperature of the plasma and its contribution to the hard X-ray emission of these LIRGs are comparable with those of local starbursts (0.8 keV and 3%, Persic & Rephaeli 2003). However, the power-law component is slightly steeper than in local starbursts, Γ = 1.2 (Persic & Rephaeli 2003) versus Γ = 1.8 in these LIRGs.
The upper limits and fluxes of the Fe Kα emission line are listed Table 6.
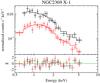 |
Fig. 3 EPIC pn (black) and combined EPIC MOS (red) 0.5–10 keV spectrum of NGC 2369 X-1 together with the spectral model consisting of an absorbed power-law (see Sect. 4.2). |
5.2. AGN X-ray spectra
The X-ray spectra of two galaxies, IC 4518W, MCG+04-48-002, are poorly fitted by the star-formation model described above. The hard X-ray emission of these galaxies is dominated by the AGN (Fig. 4). We added an absorbed power-law and a Gaussian emission line at 6.4 keV to the star-formation model to account for the AGN emission. For IC 4518W we added another Gaussian emission line at 7.1 keV. For these galaxies the power-law index of the star-formation component is poorly constrained because of the AGN contribution to the hard X-ray emission. Hence we fixed it to the median value obtained for the other LIRGs (Γ = 1.85). This model provides a good fit to the data,  ≤ 1, for the two galaxies. For this reason, we did not include an AGN reflection component (pexrav). By doing this we may underestimate the absorbing column density towards the AGN. This model fits the soft X-ray emission of these galaxies well. However, this does not imply a star-formation origin of the soft X-ray emission because the thermal plasma and the power-law continuum can be produced by an AGN. The origin of the soft X-ray emission is discussed in Sect. 6. The model parameters for these two galaxies are given in Table 7.
5.3. Literature X-ray data
The X-ray luminosities taken from the literature are listed in Table 4. This Table includes the six galaxies observed with Chandra plus two galaxies observed with XMM-Newton. For these two objects, MCG−03-34-064 and NGC 7469, we repeated the fits of the XMM-Newton data using the models given by Miniutti et al. (2007) and Blustin et al. (2003), respectively, to take advantage of the latest calibration.
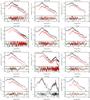 |
Fig. 4 Observed EPIC pn (black) and combined EPIC MOS (red) 0.3–10 keV spectra, best-fitting model and residuals of the LIRGs observed by XMM-Newton. |
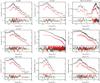 |
Fig. 4 contenuied. |
6. X-ray emission from star-formation activity
6.1. Soft X-ray emission versus SFR
At soft energies (0.5–2-0 keV), the X-ray emission is produced by diffuse hot gas heated by supernova explosions as well as X-ray binaries. Therefore the soft X-ray emission is expected to be correlated with the SFR (Ranalli et al. 2003; Rosa González et al. 2009).
The correlation found by Ranalli et al. (2003) between the soft X-ray and the far-infrared (FIR, 40–500 μm) luminosities is not linear. The galaxies in their study cover a large range in FIR luminosities and it is possible that for those galaxies with the lowest SFR, the total SFR is not dominated by the obscured SFR traced by the FIR luminosity (see Pérez-González et al. 2006; Kennicutt et al. 2009). To account for the unobscured star-formation, we used the near-UV (2267 Å) fluxes from Gil de Paz et al. (2007), which we translated into SFR (see Sect. 3). We found near-UV fluxes for 65% of the Ranalli et al. (2003) sample. To calculate the obscured SFR, we used the IRAS fluxes to obtain the total IR luminosity (8–1000 μm). Then we used the calibration of Kennicutt (1998), correcting for our adopted Kroupa IMF. We added IR and UV SFR to obtain the total SFR. The SFR traced by the UV light contributes to the total SFR between 5% and 60% with a median contribution of 20% for the galaxies of the Ranalli et al. (2003) sample. For the LIRGs we neglected the unobscured star-formation because it contributes less than 10% for most of the galaxies (see Table 2 and Howell et al. 2010; Rodríguez-Zaurín et al. 2011). In the left panel of Fig. 5 we compare the SFRIR+UV with the soft X-ray luminosity for our sample of LIRGs together with the nearby galaxies of Ranalli et al. (2003). The best-fit4 slope in log-log space is 1.1 ± 0.1, which is compatible with a linear relation. Assuming a constant SFRIR+UV/L0.5 − 2 keV ratio, we found  (4)with a 0.24 dex scatter. Mas-Hesse et al. (2008) modeled the soft X-ray luminosity expected from a starburst. They assumed that the mechanical energy from the starburst (SN and stellar winds) heats the interstellar diffuse gas with an efficiency of 1–5%. After correcting for the different IMF normalization, their calibration for a young extended burst is consistent with Eq. (4) within the scatter.
The Seyfert 2 galaxies in our sample of LIRGs lie on the correlation (NGC 3690 and IC 4518W), or have a low (less than a factor of 3) soft X-ray emission excess (MCG−03-34-064, NGC 5135, and NGC 7130). In Type-2 Seyferts the absorbing hydrogen column density toward the AGN is high and consequently most of the soft X-ray emission coming from the AGN is absorbed. Therefore we conclude that when a sufficiently powerful starburst is present it may contribute significantly to the observed soft X-ray emission. The two Seyfert 1s (NGC 7469 and NGC 7679) in our sample have a soft X-ray emission excess relative to their SFR caused by the AGN emission. Two objects (IC 860 and Zw 049.057) lie below the correlation. The low number of counts of these galaxies does not allow us to correct the soft X-ray fluxes properly for their internal absorption. In addition, the high 9.7 μm silicate absorption of these galaxies (Alonso-Herrero et al. 2011) suggests that they are highly obscured, therefore this correction is likely to be large (Shi et al. 2006).
6.2. Hard X-ray emission versus SFR
The HMXBs dominate the hard X-ray (2–10 keV) emission of a starburst galaxy when there is no AGN. Consequently the hard X-ray emission is also a tracer of the SFR (Ranalli et al. 2003; Grimm et al. 2003; Persic et al. 2004; Lehmer et al. 2010).
The right panel of Fig. 5 shows that there is a good correlation between the hard X-ray emission and the SFR when there is no AGN. The best-fit slope is 1.1 ± 0.1 (in log-log space). Assuming a directly proportional relation between the SFRIR+UV and the L2 − 10 keV, we obtained  (5)with a 0.27 dex scatter. In the fit we used all H II galaxies (excluding MGC+04-48-002 whose X-ray spectra resembles that of a Seyfert 2 galaxy, see Appendix A) and the galaxies of the Ranalli et al. (2003) sample. This calibration agrees within the uncertainties with that of Ranalli et al. (2003). However, Lehmer et al. (2010) found a highly non-linear relation (slope = 0.76) between the SFR and the L2 − 10 keV. In their fit they included high-luminosity LIRGs and ULIRGs. These galaxies are underluminous in the 2–10 keV range (see Iwasawa et al. 2009; Lehmer et al. 2010), which may affect the relation slope.
Owing to the low number of galaxies with SFR of less than ~4 M⊙ yr-1 in our sample, it is uncertain whether the correlation is still valid in the low SFR range or not. Indeed, a change in the slope of the L2 − 10 keV versus SFR relation is expected for this range (Grimm et al. 2003). For these galaxies with low SFR a bright HMXB can dominate the galaxy-integrated hard X-ray luminosity.
As can be seen in the right panel of Fig. 5, the hard X-ray emission of three Seyfert galaxies (NGC 3690, NGC 5135, and NGC 7130) is compatible (within 2σ) with that expected from star-formation. These galaxies are known to host powerful starbursts that might dominate their energy output (González Delgado et al. 1998; Alonso-Herrero et al. 2009b; Bedregal et al. 2009; Alonso-Herrero et al. 2011). For these three galaxies high angular resolution Chandra images were used to isolate and quantify the AGN emission, which was found to be approximately 70% of the total hard X-ray emission (Zezas et al. 2003; Levenson et al. 2004, 2005).
In the previous fit we neglected the contribution of the LMXBs to the hard X-ray luminosity. The emission of the LMXBs is proportional to the stellar mass of the galaxy (Gilfanov 2004), and LMXBs may be important for galaxies with the lowest SFR/M ⋆ ratios. Assuming that there is a linear correlation between the 2–10 keV galaxy-integrated emission of LMXBs and HMXBs with the stellar mass and the SFR, respectively, Lehmer et al. (2010) constrained the relation 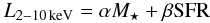 (6)for a sample of nearby normal galaxies, LIRGs, and ULIRGs. They found α = (9.05 ± 0.37) × 1028 erg s-1
 and β = (1.62 ± 0.22) × 1039 erg s-1 (M⊙ yr-1)-1. From this equation we estimate that the contribution of LMXBs to the integrated hard X-ray luminosity is less than 15% for our sample of LIRGs. This is much lower than the scatter of the SFR versus hard X-ray luminosity correlation, thus it would not be the main cause of the observed scatter.
X-ray model fits. Starburst model.
Figure 6 shows that the predicted X-ray luminosity using Eq. (6) agrees with that observed for most of the H II galaxies in our sample of LIRGs. Likewise, most of the Seyfert galaxies have hard X-ray luminosities 10 times higher than that expected from star-formation. The three Seyferts (NGC 3690, NGC 5135, and NGC 7130) that lie within 2σ of the expected relation for star-formation are those with powerful starbursts.
6.3. Fe Kα line from star formation
Although the Fe Kα emission line is detected mainly in active galaxies, it has been found in starbursts (e.g., M 82 and NGC 253, Cappi et al. 1999). In the latter its origin is associated with X-ray binaries and SNRs. The 6.4 keV Fe Kα line is observed in Galactic X-ray binaries (White et al. 1983; Torrejón et al. 2010). Using high-resolution X-ray spectroscopy, Torrejón et al. (2010) studied a sample of 41 X-ray binaries. They detected the Fe Kα line in all the HMXBs (10), but only in 10% of the LMXB. For this reason and because the X-ray binary population in starbursts is dominated by HMXBs we only consider HMXBs in the following.
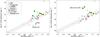 |
Fig. 5 Soft (0.5–2 keV; left) and hard (2–10 keV; right) X-ray luminosity corrected for absorption vs. SFR calculated combining the UV and IR luminosities (Sect. 3). Red stars are H II galaxies. Light green triangles and dark green circles are Type 1 and 2 Seyfert galaxies, respectively. Blue stars are composite galaxies, orange diamonds are LINERs and blue squares are galaxies without classification from optical spectroscopy. Galaxies from Ranalli et al. (2003) are plotted as gray circles. The solid line is our best linear fit to those LIRGs classified as H II and the Ranalli et al. (2003) galaxies. The dashed lines indicate the ± 1σ dispersion in this relation. |
Fe K line.
X-ray model fits. AGN model.
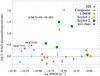 |
Fig. 6 Observed/expected hard X-ray (2–10 keV) luminosity ratio vs. SFR/M ⋆ ratio. The expected X-ray luminosity only includes the X-ray emission from LMXBs and HMXBs and is based on the relation LX = αM ⋆ + βSFR from Lehmer et al. (2010). The dashed lines indicate the scatter in this relation. Galaxy symbols are as in Fig. 5. |
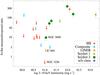 |
Fig. 7 Observed/expected 6.4 keV Fe Kα luminosity from star formation (see Sect. 6.3) vs. 2–10 keV luminosity. Galaxy symbols are as in Fig. 5. |
We estimated the median EW of the Fe Kα line produced in X-ray binaries using the data of Torrejón et al. (2010), EW = 0.07 ± 0.04 keV. Assuming that the spectra of the HMXBs in the 2–10 keV energy range can be represented as a power-law with photon index Γ = 1.2 (Persic & Rephaeli 2002), we obtain log LFeKα/L2 − 10 keV = −2.1 ± 0.6. The variation of this ratio with Γ is small, less than 0.1 dex for Γ between 1 and 2.
The integrated hard X-ray luminosity, L2−10 keV, from HMXBs is directly related to the SFR (see Lehmer et al. 2010 and Eq. (6)). Combining these relations, we obtain  (7)With this equation we estimated the expected flux of the 6.4 keV Fe Kα line from HMXBs. In Fig. 7 we show the expected/observed Fe Kα emission line ratio. For all galaxies without line detection the upper limits are compatible with our flux estimation for star-formation. Because this line is correlated with the luminosity of the AGN when present, these upper limits also put an upper limit on the AGN contribution to the total energy output of the galaxy (see Sect. 7.1).
The detection of the ionized iron line at 6.7 keV in IC 694 and NCG 3256 (Table 6) indicates the presence of hot gas (kT > 3 keV) in these galaxies. Therefore their hard X-ray emission may be dominated by hot gas, as is the case in high-luminosity LIRGs and ULIRGs (Iwasawa et al. 2009, 2011; Colina et al. 2011, submitted). This is in contrast with local starbursts, where the hard X-ray emission is mostly caused by HMXBs. Figure 7 shows that the upper limit for the 6.4 keV line in NGC 3256 is lower than the expected value for HMXBs. This provides additional support for a noticeable contribution from hot gas to the hard X-ray emission, at least in some LIRGs.
For Seyfert galaxies the observed-to-expected Fe Kα emission ratio is higher than ~ 50, reaching ~ 300 in some cases. Clearly, the Fe Kα emission is dominated by the AGN in these galaxies.
AGN luminosity.
6.4. Metal abundances of the thermal plasma
The soft X-ray spectrum of starburst galaxies is dominated by the emission of a diffuse thermal plasma with temperatures in the range 0.1 to 1 keV. It is believed that it is heated by shock-fronts generated by SN explosions and stellar winds (Persic et al. 2004). Table 5 shows the Fe/O ratio with respect to the solar values5 of our sample. Owing to the limited S/N ratio of the spectra we were not able to obtain the absolute abundances. The average Fe/O ratio with respect to the solar abundance is 0.5 ± 0.2. The underabundance of Fe relative to α elements has been observed in nearby starbursts (Strickland et al. 2004; Grimes et al. 2005) and local (U)LIRGs (Iwasawa et al. 2011).
Various processes have been proposed to explain these results. In the dwarf starburst galaxy NGC 1559 the α elements abundance with respect to Fe is consistent with the enhanced production of α elements in Type II SN (Martin et al. 2002). Indeed the Fe/O ratio measured in these LIRGs is consistent with the IMF-averaged Fe relative to α elements ratio expected from Type II SN (Gibson et al. 1997). Alternatively, Strickland et al. (2000) suggested that the X-ray emission is produced in the boundary layer between the cold interstellar medium and the SN winds, therefore the underabundance of Fe could be caused by the Fe depletion into dust grains. To distinguish between Fe depletion and enhanced α elements production in Type-II SN it is necessary to determine the abundances relatives to hydrogen and compare them with the galaxy metallicity (Strickland et al. 2004).
7. AGN activity of LIRGs from X-ray emission
7.1. Low-luminosity AGN
The Fe Kα emission line is one of the most prominent signatures of obscured AGN in the hard X-ray energy range. In Compton-thick AGN (NH > 1024 cm-2) the Fe Kα line at 6.4 keV has a high EW ( > 1 keV; Levenson et al. 2006). This is caused by the different gas column densities that affect the AGN continuum and the emission line. The X-ray continuum in a Compton-thick AGN is highly absorbed below 10 keV by the gas around the AGN. The 6.4 keV Fe Kα emission line, on the other hand, is produced in regions far from the AGN with an absorbing column density in our line of sight significantly lower than that of the continuum (e.g., Jiménez-Bailón et al. 2005). Fe Kα emission lines with high EW have been detected in ULIRGs, indicating that some ULIRGs (~20–30%) contain buried AGNs, although their X-ray emission is dominated by star formation (Ptak et al. 2003; Franceschini et al. 2003).
Table 6 shows the Fe Kα EW measured for our sample of LIRGs. The Fe Kα EW upper limits for 40% of the galaxies are compatible with EW higher than 1 keV. These galaxies could host a Compton-thick AGN. However, if they do, it would not be a bright AGN. Their bolometric luminosity would be lower than 1043 erg s-1 (estimated from the upper limits of the Fe Kα emission line flux, see Sect. 7.2). That is, the AGN contribution in these galaxies would be less than 10% of the total luminosity (IR luminosity). By comparison, for the Seyfert galaxies in the sample the AGN contribution ranges from less than 1% to 35% (see Sect. 7.3).
Apart from the Fe Kα emission line, the AGN continuum, absorbed or reflected (depending on the absorbing column density), might be detected in the hard X-ray (2–10 keV) range. Three of the non-Seyfert galaxies (NGC 5743, MCG+04-48-002, and NGC 7771) have hard X-ray luminosities between 5 and 100 times higher than those expected from star formation (Fig. 6). NGC 5743 is classified as H II from optical spectroscopy, although the detection of the [Ne v] lines at 14.3 and 24.3 μm (Pereira-Santaella et al. 2010) indicates that an AGN is present in this galaxy. These [Ne v] lines are also detected in the mid-infrared spectrum of MCG+04-48-002 (Pereira-Santaella et al. 2010). The presence of an AGN in this object is also confirmed by its 20–100 keV emission (Bassani et al. 2006). In the case of NGC 7771 the nuclear activity type is H II (Alonso-Herrero et al. 2009a). The only evidence of an AGN in this galaxy is the detection of the Fe Kα line6 and the excessively hard X-ray emission (Jenkins et al. 2005).
7.2. Obscured AGN
Five of the LIRGs (NGC 3690, MCG−03-34-064, NGC 5135, IC 4518W, and NGC 7130) are Seyfert 2 galaxies. In addition, the mid-IR and X-ray properties of MCG+04-48-002 suggest the presence of a bright AGN, although it is not detected in the optical spectrum (Masetti et al. 2006). These galaxies are likely to host an obscured AGN.
We can constrain the hydrogen column density toward the AGN from their X-ray spectra for three galaxies: MCG−03-34-064, IC 4518W, and MCG+04-48-002. It is < 1024 cm-2 for all of them, therefore they are not Compton-thick AGN. After correcting the observed luminosity for this absorption, we obtain the intrinsic AGN X-ray luminosity (Table 8). These three galaxies are also detected in the Swift/BAT 14–195 keV all-sky survey (Tueller et al. 2010). The 14–195 keV emission is less affected by absorption than the 2–10 keV emission. Therefore it is a direct indicator of the intrinsic AGN luminosity except for the most obscured Compton-thick AGN7 (NH > 1026 cm-2; e.g., Matt et al. 1997).
Using the Marconi et al. (2004) AGN template, Rigby et al. (2009) calculated that the L2 − 10 keV/L14 − 195 keV ratio is 0.37. This ratio is between 0.77 and 0.12 for these three LIRGs and is comparable to that observed in a sample of local Swift/BAT selected AGNs (Fig. 6 of Winter et al. 2009). MCG−03-34-064 has the highest ratio and also the steepest continuum (Γ ~ 2.7). Likewise, IC 4518W has the lowest ratio and the lowest photon index (Γ ~ 1.6). Thus the continuum slope might affect the L2 − 10 keV/L14 − 195 keV ratio. However, the Swift/BAT flux contamination by nearby sources, the uncertainty in the contribution of the AGN reflected continuum to the 14–195 keV luminosity (which represents about 40% of the total AGN emission at 30 keV, Ueda et al. 2003), and the AGN variability may be important factors that affect the observed L2−10 keV/L14 − 195 keV ratio.
The other three Seyfert 2s in our LIRGs sample (NGC 3690, NGC 5135, and NGC 7130) might be Compton-thick AGN. In fact, NGC 5135 and NGC 7130 have been classified as Compton-thick based on their high Fe Kα EW (see Levenson et al. 2004, 2005). The Fe Kα EW of NGC 3690 is 0.93 keV (see Table 6). It is slightly less than the typical values of Compton-thick AGN ( > 1 keV). However, the star-formation contribution to the hard X-ray continuum is ~ 30% in NGC 3690 (see Sect. 6.2) and therefore decreases the observed EW of the Fe Kα emission line. To estimate the AGN X-ray luminosity of these objects, we used the flux of the Fe Kα emission line because it seems to be a good indicator of the intrinsic AGN luminosity (Ptak et al. 2003; Levenson et al. 2006; LaMassa et al. 2009). We assumed LFeKα/ (Levenson et al. 2006). However, we note that this ratio depends on both the geometry of the AGN-obscuring material and the column density in our line of sight (Liu & Wang 2010; Yaqoob et al. 2010; Murphy & Yaqoob 2009). Consequently a large uncertainty, a factor of ~5, is expected in the intrinsic AGN luminosities of these galaxies.
None of these three Compton thick candidates are detected in the Swift-BAT 14–195 keV survey. The 14–195 keV luminosity upper limits are slightly lower than the expected luminosity for their 2–10 keV emission. The large scatter (a factor of 6) in the L14 − 195 keV/L2 − 10 keV ratio for the detections and the uncertainties discussed above might explain this.
The 2–10 keV and 14–195 keV luminosities are listed in Table 8. For completeness, the two Seyfert 1 galaxies in our sample are also included in the table.
7.3. AGN contribution to the LIRGs luminosity
We calculated the fraction of the bolometric luminosity produced by AGN in our sample of LIRGs. We used the LIR(8–1000 μm) as the total luminosity of the LIRGs. The AGN luminosity was estimated from the X-ray data.
There are eight active galaxies in our sample. This represents 30% of the sample, although the AGN do not dominate the luminosity of any of them. For these galaxies we estimated the AGN luminosity from their X-ray spectral model or from their Fe Kα line luminosity (Sect. 7.2). To obtain the AGN bolometric luminosity, we applied the bolometric correction of Marconi et al. (2004). Comparing the bolometric AGN luminosity with the IR luminosity (Table 8), we find that the median AGN contribution is 25% and ranges from less than 1% to 35% for the Seyfert LIRGs. For the rest of the sample we used the upper limit of the Fe Kα line luminosity to obtain the upper limit for the AGN luminosity (Sect. 7.1).
The AGN luminosity of the active LIRGs contributes 7% of the total luminosity of the sample. If we also consider the upper limits of the AGN luminosity of the star-forming galaxies, the AGN contribution is < 10%. That is, AGN contribute between 7% and 10% to the total energy output of our sample of local LIRGs. This is agrees with the value obtained for local LIRGs by Petric et al. (2011), 12%, and Alonso-Herrero et al. (2011) using mid-IR diagnostics.
8. Conclusions
We have analyzed the X-ray properties of a representative sample of 27 local LIRGs. The median log LIR/L⊙ is 11.2, therefore the low-luminosity end of the LIRG class is well represented. The main results are as follows:
-
1.
For most of the galaxies the soft X-ray emission (0.5–2 keV) can be associated to the star-formation activity. This is true even for some Seyfert 2s that host powerful starbursts and highly obscured AGN. We found a proportional correlation between the SFR (unobscured plus obscured) and the L0.5 − 2 keV (Eq. (4)). This relation is compatible with that obtained from synthesis models (Mas-Hesse et al. 2008). Only LIRGs hosting Seyfert 1 deviate significantly from this correlation.
-
2.
We found that the hard X-ray (2–10 keV) emission of those LIRGs classified as H II like is also proportional to the SFR (Eq. (5)). This correlation is compatible with that found for nearby starbursts (Ranalli et al. 2003; Persic et al. 2004). In this relationship LIRGs hosting Seyfert nuclei (type 1 and type 2) show in general an excess of 2–10 keV emission that is clearly attributed to the AGN. However, some LIRGs hosting a Seyfert 2 nucleus and with powerful starbursts relative to their obscured AGN also lie on the correlation.
-
3.
The soft X-ray emission can be modeled with a thermal plasma. The plasma abundance has subsolar Fe/O ratios. This can be explained by the α elements enrichment caused by Type-II SNe or by the Fe depletion into dust grains. The data analyzed here do not allow us to reject any of these possibilities.
-
4.
We did not detect the Fe Kα emission line at 6.4 keV in most ( > 90%) of the H II LIRGs. Only in one H II LIRG (MCG+04-48-002) is the presence of an obscured AGN evident from the X-ray data. Therefore we can rule out the presence of luminous obscured (or Compton-thick) AGN in these H II LIRGs. If present, the AGN contribution to the bolometric luminosity would be less than 10%.
-
5.
Three Seyfert LIRGs (10%) in our sample are Compton-thick AGN candidates based on their high Fe Kα EW. The rest are Seyfert 2s (2, 7%) with NH < 1024 cm-2 or Seyfert 1s (2, 7%). The median AGN contribution to the bolometric luminosity of those LIRGs hosting a Seyfert nucleus is 25%, ranging from 1% to 35%.
-
6.
The AGN emission represents about 7% of the total energy output of the sample. Taking into account the upper limits for the AGN contribution in the H II LIRGs, the AGN contribution is between 7% and 10%. This agrees with the values estimated from mid-IR data (Alonso-Herrero et al. 2011; Petric et al. 2011).
Online material
Appendix A: Notes on individual sources
In this appendix we discuss the X-ray spectral analysis of some galaxies with XMM-Newton data.
NGC 3256
It is the most luminous nearby (z < 0.01) merger system. Its energy output is dominated by a powerful starburst. Previous ASCA, Chandra, and XMM-Newton X-ray observations of this galaxy have been analyzed in detail by Moran et al. (1999), Lira et al. (2002) and Jenkins et al. (2004), respectively. We used a simple model (absorbed vmekal + power-law) to fit the XMM-Newton spectrum. It provides an acceptable fit ( ) for our analysis. Jenkins et al. (2004) tentatively detected a Fe Kα emission line at ~ 6–7 keV. The higher S/N ratio data analyzed here clearly show an emission line at 6.60
 keV (Table 6). The energy of the line suggests that it is produced by ionized Fe, possibly related to supernovae activity. The upper limit for the EW of a neutral Fe Kα line at 6.4 keV is < 70 eV (Table 6). This low EW is not compatible with that expected from a luminous Compton-thick AGN.
Arp 299 (NGC 3690 and IC 694)
It is a luminous infrared (LIR = 6 × 10¹¹L⊙) merger system. It hosts one of the most powerful starbursts in local galaxies (Alonso-Herrero et al. 2009b). The X-ray emission below 10 keV is dominated by star formation, however a Compton-thick AGN is found in the system (Della Ceca et al. 2002). The hard X-ray spectrum of the nucleus of NGC 3690 indicates that the obscured AGN is probably located there (Zezas et al. 2003). Ballo et al. (2004) detected the Fe Kα emission feature in both system components NGC 3690 and IC 694. They found that the energy of the emission line in NGC 3690 is consistent with neutral iron, but in our fit the energy of the emission line is only poorly constrained (Table 6). The measured 6.4 keV Fe Kα flux is ~10 times higher than that expected from star formation suggesting the presence of an AGN in NGC 3690. The energy of the emission line in IC 694 is consistent with the Fe Kα from ionized iron that may be produced in highly ionized gas around the AGN or SN explosions (Ballo et al. 2004). For the fit we used a model consisting of an absorbed thermal plasma plus a power-law. We included a Gaussian profile to account for the Fe Kα emission lines.
MCG−03-34-064
This galaxy is classified as Seyfert 1.8. The soft X-ray spectrum is dominated by a thermal component likely produced by star formation and gas photoionized by the AGN. The AGN absorbed component dominates the spectrum in the hard X-ray range. An Fe Kα emission line is detected at 6.4 keV, consistent with neutral iron. A detailed analysis of the XMM-Newton data of this galaxy was presented by Miniutti et al. (2007).
IC 4518W
It is a Seyfert 2 galaxy. Its XMM-Newton and INTEGRAL observations are described by de Rosa et al. (2008). This is the only galaxy in the sample in which we detected two prominent emission lines in the hard X-ray spectrum, one at 6.39 ± 0.03 keV and a weaker emission line at 7.1 (Table 6). The former is compatible with Fe Kα emission from neutral Fe. The latter may be Fe Kα produced by highly ionized iron, Fe Kβ or these lines blended. Comastri et al. (2010) found the Fe Kβ line in some obscured AGN. However, the Fe Kβ/Fe Kα ratio from neutral iron is 0.12–0.17 (Palmeri et al. 2003) and the ratio between the 6.39 and the 7.1 keV emission lines in IC 4518W is larger (0.4). Accordingly there might be a contribution from the Fe xxvi Kα emission line.
MCG+04-48-002
This galaxy is classified as H II from optical spectroscopy, but its radio, hard X-ray emission, and mid-IR spectrum suggest the presence of an obscured AGN (Masetti et al. 2006; Pereira-Santaella et al. 2010). Suzaku observations of this galaxy were analyzed by Winter et al. (2009). We detected an emission line at 6.47 that is compatible with neutral Fe Kα. The high hydrogen column density (
 cm-2) toward the AGN and the powerful star-formation might explain why no AGN signatures are found in its optical spectrum.
NGC 7679
is a composite Seyfert 1/starburst galaxy. It is sometimes misclassified as Seyfert 2 (see Shi et al. 2010). The hard X-ray spectrum is well reproduced by a power-law model, but we had to add a soft thermal plasma component to account for the soft X-ray excess. Della Ceca et al. (2001) reported X-ray fluxes ~ 7 times higher in the soft and hard bands from the analysis of contemporaneous (1998) ASCA and BeppoSax observations of this galaxy. Previous X-ray observations of NGC 7679 are available with Einstein (1981) and ROSAT (1990). The fluxes in the 0.2–4 keV (Einstein) and 0.1–2.4 keV (ROSAT) bands are a factor of ~ 2 higher than those measured in the XMM-Newton data (Della Ceca et al. 2001). These flux variations reflect the long-term variability of the X-ray emission of this galaxy.
Appendix B: Optical classification
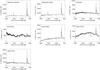 |
Fig. B.1 Observed optical spectra of seven LIRGs from the 6dFGS database. |
The optical spectra of seven galaxies in the parent sample of LIRGs (Alonso-Herrero et al. 2006, 2011) without a previous activity classification were obtained as part of the six-degree Field (6dF) Galaxy Survey (6dFGS DR3; Jones et al. 2004, 2009). Only four of these seven LIRGs are members of the subsample studied in this paper. However, we present the optical spectra of all of them because in Sect. 2 we compare the nuclear activity of both samples.
The optical spectra were obtained with the 6dF multi-object fibre spectrograph on the United Kingdom Schmidt Telescope (UKST) from 2001 to 2006. The fiber angular diameter is 6 7, which means that at the distance of these LIRGs it covers the central ~2 kpc of the galaxies (i.e., similar to the physical regions covered by the Veilleux et al. 1995 spectra of local LIRGs). Each object was observed with two gratings in the V (3900–5600 Å) and R (5400–7500 Å) bands for at least 1 h and 0.5 h, respectively. These two spectra were later spliced to obtain the final object spectrum. The spectral resolution is 5–6 Å in V and 9–12 Å in R. The spectra are not accurately flux-calibrated, but they can be used to calculate ratios of emission lines near in wavelength (see Lee et al. 2011). The spectra of the 7 LIRGs are shown in Fig. B.1.
We measured the Hβ, [O iii]λ5007 Å, Hα, and [N ii]λ6584 Å emission lines in the spectra by fitting a Gaussian to each emission line. The measured [N ii]/Hα and [O iii]/Hβ line ratios are listed in Table B.1. We did not correct Hβ for stellar absorption, so the calculated [O iii]/Hβ ratio should be considered as an upper limit.
To determine the nuclear activity of these galaxies, we used the standard optical diagnostic diagram [N ii]λ6584 Å/Hα vs. [O iii]λ5007 Å/Hβ (Baldwin et al. 1981). We adopted the boundaries between H II, AGN, and composite galaxies of Kewley et al. (2006). The diagram for these LIRGs is shown in Fig. B.2 and the adopted classifications are listed in Table B.1. Neither the Hβ nor the [O iii]λ5007 emission lines are detected in IC 4518E, therefore we do not plot this galaxy in Fig. B.2. We did not detect the [O iii]λ5007 Å emission line in the spectrum of IC 4280, so we plotted the upper limit of the [O iii]/Hβ ratio in Fig. B.2. This does not affect the H II activity classification of this galaxy (see Fig. B.2).
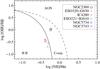 |
Fig. B.2 [N ii]λ6584/Hα versus [O iii]λ5007/Hβ diagnostic diagram for the nuclear spectra of six LIRGs. The black lines show the empirical separation between H II, AGN, and composite galaxies of Kewley et al. (2006). |
Observed optical emission line ratios and classification.
The IRAS RBGS is a complete flux-limited sample including all extragalactic objects with a 60 μm flux density greater than 5.25 Jy and Galactic latitude |b| > 5 °.
In Appendix B we present the optical activity classification of seven LIRGs with no published classification. This new classification is based on the optical spectra available in the six-degree Field Galaxy Survey (6dFGS) database.
The UV (2120 Å) and IR fluxes of the NGC 2369 X-1 region are  mJy and F24 μm = 0.14 Jy.
We only used the galaxies classified as H II and the galaxies of Ranalli et al. (2003) for the fit.
We used the solar abundances of Anders & Grevesse (1989).
In our spectral analysis of NGC 7771 we do not detect the Fe Kα line, although the upper limit is compatible with the line flux measured by Jenkins et al. (2005).
However, owing to the angular resolution of the Swift-BAT survey (19.5 arcmin), the 14–195 keV fluxes can be contaminated by other nearby Seyfert galaxies (MCG−03-34-064 and MCG−03-34-063, MCG+04-48-002 and NGC 6921).
Acknowledgments
We thank the anonymous referee for useful comments and suggestions. The authors thank C. Done for helpful discussion. M.P.-S. thanks the Durham University for their hospitality during his stay while part of this work was done. M.P.-S. also acknowledges support from the CSIC under grant JAE-Predoc-2007. A.A.-H. and M.P.-S. acknowledge support from the Spanish Plan Nacional del Espacio under grant ESP2007-65475-C02-01 and Plan Nacional de Astronomía y Astrofísica AYA2009-05705-E. This work is based on observations obtained with XMM-Newton, an ESA science mission with instruments and contributions directly funded by ESA Member States and the USA (NASA). This research has made use of the NASA/IPAC Extragalactic Database (NED), which is operated by the Jet Propulsion Laboratory, California Institute of Technology, under contract with the National Aeronautics and Space Administration.
References
- Alonso-Herrero, A., Rieke, G. H., Rieke, M. J., et al. 2006, ApJ, 650, 835 [NASA ADS] [CrossRef] [Google Scholar]
- Alonso-Herrero, A., García-Marín, M., Monreal-Ibero, A., et al. 2009a, A&A, 506, 1541 [NASA ADS] [CrossRef] [EDP Sciences] [Google Scholar]
- Alonso-Herrero, A., Rieke, G. H., Colina, L., et al. 2009b, ApJ, 697, 660 [NASA ADS] [CrossRef] [Google Scholar]
- Alonso-Herrero, A., Pereira-Santaella, M., Rieke, G. H., & Rigopoulou, D. 2011, ApJ, in press [arXiv:1109.1372] [Google Scholar]
- Anders, E., & Grevesse, N. 1989, Geochim. Cosmochim. Acta, 53, 197 [Google Scholar]
- Baldwin, J. A., Phillips, M. M., & Terlevich, R. 1981, PASP, 93, 5 [NASA ADS] [CrossRef] [EDP Sciences] [Google Scholar]
- Ballo, L., Braito, V., Della Ceca, R., et al. 2004, ApJ, 600, 634 [NASA ADS] [CrossRef] [Google Scholar]
- Bassani, L., Molina, M., Malizia, A., et al. 2006, ApJ, 636, L65 [NASA ADS] [CrossRef] [Google Scholar]
- Bedregal, A. G., Colina, L., Alonso-Herrero, A., & Arribas, S. 2009, ApJ, 698, 1852 [NASA ADS] [CrossRef] [Google Scholar]
- Bell, E. F., & de Jong, R. S. 2001, ApJ, 550, 212 [NASA ADS] [CrossRef] [Google Scholar]
- Blustin, A. J., Branduardi-Raymont, G., Behar, E., et al. 2003, A&A, 403, 481 [NASA ADS] [CrossRef] [EDP Sciences] [Google Scholar]
- Buat, V., Takeuchi, T. T., Iglesias-Páramo, J., et al. 2007, ApJS, 173, 404 [NASA ADS] [CrossRef] [Google Scholar]
- Cappi, M., Persic, M., Bassani, L., et al. 1999, A&A, 350, 777 [NASA ADS] [Google Scholar]
- Caputi, K. I., Lagache, G., Yan, L., et al. 2007, ApJ, 660, 97 [NASA ADS] [CrossRef] [Google Scholar]
- Charmandaris, V., Stacey, G. J., & Gull, G. 2002, ApJ, 571, 282 [NASA ADS] [CrossRef] [Google Scholar]
- Colbert, E. J. M., Heckman, T. M., Ptak, A. F., Strickland, D. K., & Weaver, K. A. 2004, ApJ, 602, 231 [NASA ADS] [CrossRef] [Google Scholar]
- Colina, L., Pereira-Santaella, M., Alonso-Herrero, A., Bedregal, A. G., & Arribas, S. 2011 ApJ, submitted [Google Scholar]
- Comastri, A., Iwasawa, K., Gilli, R., et al. 2010, ApJ, 717, 787 [NASA ADS] [CrossRef] [Google Scholar]
- Corbett, E. A., Kewley, L., Appleton, P. N., et al. 2003, ApJ, 583, 670 [NASA ADS] [CrossRef] [Google Scholar]
- Daddi, E., Dickinson, M., Morrison, G., et al. 2007, ApJ, 670, 156 [NASA ADS] [CrossRef] [Google Scholar]
- de Rosa, A., Bassani, L., Ubertini, P., et al. 2008, A&A, 483, 749 [NASA ADS] [CrossRef] [EDP Sciences] [Google Scholar]
- Della Ceca, R., Pellegrini, S., Bassani, L., et al. 2001, A&A, 375, 781 [NASA ADS] [CrossRef] [EDP Sciences] [Google Scholar]
- Della Ceca, R., Ballo, L., Tavecchio, F., et al. 2002, ApJ, 581, L9 [NASA ADS] [CrossRef] [Google Scholar]
- Fabbiano, G. 2006, ARA&A, 44, 323 [NASA ADS] [CrossRef] [Google Scholar]
- Farrah, D., Lonsdale, C. J., Weedman, D. W., et al. 2008, ApJ, 677, 957 [NASA ADS] [CrossRef] [Google Scholar]
- Fitzpatrick, E. L. 1999, PASP, 111, 63 [NASA ADS] [CrossRef] [Google Scholar]
- Franceschini, A., Braito, V., Persic, M., et al. 2003, MNRAS, 343, 1181 [NASA ADS] [CrossRef] [Google Scholar]
- García-Marín, M., Colina, L., Arribas, S., Alonso-Herrero, A., & Mediavilla, E. 2006, ApJ, 650, 850 [NASA ADS] [CrossRef] [Google Scholar]
- Gibson, B. K., Loewenstein, M., & Mushotzky, R. F. 1997, MNRAS, 290, 623 [NASA ADS] [Google Scholar]
- Gil de Paz, A., Boissier, S., Madore, B. F., et al. 2007, ApJS, 173, 185 [NASA ADS] [CrossRef] [Google Scholar]
- Gilfanov, M. 2004, MNRAS, 349, 146 [NASA ADS] [CrossRef] [Google Scholar]
- González Delgado, R. M., Heckman, T., Leitherer, C., et al. 1998, ApJ, 505, 174 [NASA ADS] [CrossRef] [Google Scholar]
- Grimes, J. P., Heckman, T., Strickland, D., & Ptak, A. 2005, ApJ, 628, 187 [Google Scholar]
- Grimm, H., Gilfanov, M., & Sunyaev, R. 2003, MNRAS, 339, 793 [NASA ADS] [CrossRef] [Google Scholar]
- Güver, T., & Özel, F. 2009, MNRAS, 400, 2050 [NASA ADS] [CrossRef] [Google Scholar]
- Hattori, T., Yoshida, M., Ohtani, H., et al. 2004, AJ, 127, 736 [NASA ADS] [CrossRef] [Google Scholar]
- Howell, J. H., Armus, L., Mazzarella, J. M., et al. 2010, ApJ, 715, 572 [NASA ADS] [CrossRef] [Google Scholar]
- Iwasawa, K., Sanders, D. B., Evans, A. S., et al. 2009, ApJ, 695, L103 [NASA ADS] [CrossRef] [Google Scholar]
- Iwasawa, K., Sanders, D. B., Teng, S. H., et al. 2011, A&A, 529, A106 [NASA ADS] [CrossRef] [EDP Sciences] [Google Scholar]
- Jarrett, T. H., Chester, T., Cutri, R., et al. 2000, AJ, 119, 2498 [NASA ADS] [CrossRef] [Google Scholar]
- Jarrett, T. H., Chester, T., Cutri, R., Schneider, S. E., & Huchra, J. P. 2003, AJ, 125, 525 [NASA ADS] [CrossRef] [Google Scholar]
- Jenkins, L. P., Roberts, T. P., Ward, M. J., & Zezas, A. 2004, MNRAS, 352, 1335 [NASA ADS] [CrossRef] [Google Scholar]
- Jenkins, L. P., Roberts, T. P., Ward, M. J., & Zezas, A. 2005, MNRAS, 357, 109 [NASA ADS] [CrossRef] [Google Scholar]
- Jiménez-Bailón, E., Santos-Lleó, M., Mas-Hesse, J. M., et al. 2003, ApJ, 593, 127 [NASA ADS] [CrossRef] [Google Scholar]
- Jiménez-Bailón, E., Piconcelli, E., Guainazzi, M., et al. 2005, A&A, 435, 449 [NASA ADS] [CrossRef] [EDP Sciences] [Google Scholar]
- Jones, D. H., Saunders, W., Colless, M., et al. 2004, MNRAS, 355, 747 [NASA ADS] [CrossRef] [Google Scholar]
- Jones, D. H., Read, M. A., Saunders, W., et al. 2009, MNRAS, 399, 683 [NASA ADS] [CrossRef] [Google Scholar]
- Kalberla, P. M. W., Burton, W. B., Hartmann, D., et al. 2005, A&A, 440, 775 [NASA ADS] [CrossRef] [EDP Sciences] [Google Scholar]
- Kennicutt, Jr., R. C. 1998, ARA&A, 36, 189 [Google Scholar]
- Kennicutt, R. C., Hao, C., Calzetti, D., et al. 2009, ApJ, 703, 1672 [NASA ADS] [CrossRef] [Google Scholar]
- Kewley, L. J., Groves, B., Kauffmann, G., & Heckman, T. 2006, MNRAS, 372, 961 [NASA ADS] [CrossRef] [Google Scholar]
- Kim, D., Veilleux, S., & Sanders, D. B. 1998, ApJ, 508, 627 [NASA ADS] [CrossRef] [Google Scholar]
- Kroupa, P. 2001, MNRAS, 322, 231 [NASA ADS] [CrossRef] [Google Scholar]
- LaMassa, S. M., Heckman, T. M., Ptak, A., et al. 2009, ApJ, 705, 568 [NASA ADS] [CrossRef] [Google Scholar]
- Le Floc’h, E., Papovich, C., Dole, H., et al. 2005, ApJ, 632, 169 [NASA ADS] [CrossRef] [Google Scholar]
- Lee, J. C., Hwang, H. S., Lee, M. G., Kim, M., & Kim, S. C. 2011, MNRAS, 414, 702 [NASA ADS] [CrossRef] [Google Scholar]
- Lehmer, B. D., Alexander, D. M., Bauer, F. E., et al. 2010, ApJ, 724, 559 [NASA ADS] [CrossRef] [Google Scholar]
- Levenson, N. A., Weaver, K. A., Heckman, T. M., Awaki, H., & Terashima, Y. 2004, ApJ, 602, 135 [NASA ADS] [CrossRef] [Google Scholar]
- Levenson, N. A., Weaver, K. A., Heckman, T. M., Awaki, H., & Terashima, Y. 2005, ApJ, 618, 167 [NASA ADS] [CrossRef] [Google Scholar]
- Levenson, N. A., Heckman, T. M., Krolik, J. H., Weaver, K. A., & Życki, P. T. 2006, ApJ, 648, 111 [NASA ADS] [CrossRef] [Google Scholar]
- Lípari, S., Díaz, R., Taniguchi, Y., et al. 2000, AJ, 120, 645 [NASA ADS] [CrossRef] [Google Scholar]
- Lira, P., Ward, M., Zezas, A., Alonso-Herrero, A., & Ueno, S. 2002, MNRAS, 330, 259 [NASA ADS] [CrossRef] [Google Scholar]
- Liu, T., & Wang, J.-X. 2010, ApJ, 725, 2381 [NASA ADS] [CrossRef] [Google Scholar]
- Marconi, A., Risaliti, G., Gilli, R., et al. 2004, MNRAS, 351, 169 [NASA ADS] [CrossRef] [Google Scholar]
- Martin, C. L., Kobulnicky, H. A., & Heckman, T. M. 2002, ApJ, 574, 663 [NASA ADS] [CrossRef] [Google Scholar]
- Mas-Hesse, J. M., Otí-Floranes, H., & Cerviño, M. 2008, A&A, 483, 71 [NASA ADS] [CrossRef] [EDP Sciences] [Google Scholar]
- Masetti, N., Bassani, L., Bazzano, A., et al. 2006, A&A, 455, 11 [NASA ADS] [CrossRef] [EDP Sciences] [Google Scholar]
- Matt, G., Guainazzi, M., Frontera, F., et al. 1997, A&A, 325, L13 [NASA ADS] [Google Scholar]
- Miniutti, G., Ponti, G., Dadina, M., Cappi, M., & Malaguti, G. 2007, MNRAS, 375, 227 [NASA ADS] [CrossRef] [Google Scholar]
- Moran, E. C., Lehnert, M. D., & Helfand, D. J. 1999, ApJ, 526, 649 [NASA ADS] [CrossRef] [Google Scholar]
- Murphy, K. D., & Yaqoob, T. 2009, MNRAS, 397, 1549 [NASA ADS] [CrossRef] [Google Scholar]
- Palmeri, P., Mendoza, C., Kallman, T. R., Bautista, M. A., & Meléndez, M. 2003, A&A, 410, 359 [NASA ADS] [CrossRef] [EDP Sciences] [Google Scholar]
- Parra, R., Conway, J. E., Aalto, S., et al. 2010, ApJ, 720, 555 [NASA ADS] [CrossRef] [Google Scholar]
- Pereira-Santaella, M., Diamond-Stanic, A. M., Alonso-Herrero, A., & Rieke, G. H. 2010, ApJ, 725, 2270 [NASA ADS] [CrossRef] [Google Scholar]
- Pérez-González, P. G., Rieke, G. H., Egami, E., et al. 2005, ApJ, 630, 82 [NASA ADS] [CrossRef] [Google Scholar]
- Pérez-González, P. G.,Kennicutt, Jr., R. C., Gordon, K. D., et al. 2006, ApJ, 648, 987 [NASA ADS] [CrossRef] [Google Scholar]
- Perez-Olea, D. E., & Colina, L. 1996, ApJ, 468, 191 [NASA ADS] [CrossRef] [Google Scholar]
- Persic, M., & Rephaeli, Y. 2002, A&A, 382, 843 [NASA ADS] [CrossRef] [EDP Sciences] [Google Scholar]
- Persic, M., & Rephaeli, Y. 2003, A&A, 399, 9 [NASA ADS] [CrossRef] [EDP Sciences] [Google Scholar]
- Persic, M., Rephaeli, Y., Braito, V., et al. 2004, A&A, 419, 849 [NASA ADS] [CrossRef] [EDP Sciences] [Google Scholar]
- Petric, A. O., Armus, L., Howell, J., et al. 2011, ApJ, 730, 28 [NASA ADS] [CrossRef] [Google Scholar]
- Piconcelli, E., Jimenez-Bailón, E., Guainazzi, M., et al. 2004, MNRAS, 351, 161 [NASA ADS] [CrossRef] [Google Scholar]
- Ptak, A., Serlemitsos, P., Yaqoob, T., & Mushotzky, R. 1999, ApJS, 120, 179 [NASA ADS] [CrossRef] [Google Scholar]
- Ptak, A., Heckman, T., Levenson, N. A., Weaver, K., & Strickland, D. 2003, ApJ, 592, 782 [NASA ADS] [CrossRef] [Google Scholar]
- Ranalli, P., Comastri, A., & Setti, G. 2003, A&A, 399, 39 [NASA ADS] [CrossRef] [EDP Sciences] [Google Scholar]
- Rieke, G. H. 1988, ApJ, 331, L5 [NASA ADS] [CrossRef] [Google Scholar]
- Rieke, G. H., Alonso-Herrero, A., Weiner, B. J., et al. 2009, ApJ, 692, 556 [NASA ADS] [CrossRef] [Google Scholar]
- Rigby, J. R., Marcillac, D., Egami, E., et al. 2008, ApJ, 675, 262 [NASA ADS] [CrossRef] [Google Scholar]
- Rigby, J. R., Diamond-Stanic, A. M., & Aniano, G. 2009, ApJ, 700, 1878 [NASA ADS] [CrossRef] [Google Scholar]
- Risaliti, G., Gilli, R., Maiolino, R., & Salvati, M. 2000, A&A, 357, 13 [NASA ADS] [Google Scholar]
- Rodríguez-Zaurín, J., Arribas, S., Monreal-Ibero, A., et al. 2011, A&A, 527, A60 [NASA ADS] [CrossRef] [EDP Sciences] [Google Scholar]
- Rosa González, D., Terlevich, E., Jiménez Bailón, E., et al. 2009, MNRAS, 399, 487 [NASA ADS] [CrossRef] [Google Scholar]
- Rujopakarn, W., Eisenstein, D. J., Rieke, G. H., et al. 2010, ApJ, 718, 1171 [NASA ADS] [CrossRef] [Google Scholar]
- Sanders, D. B., & Mirabel, I. F. 1996, ARA&A, 34, 749 [NASA ADS] [CrossRef] [Google Scholar]
- Sanders, D. B., Mazzarella, J. M., Kim, D.-C., Surace, J. A., & Soifer, B. T. 2003, AJ, 126, 1607 [Google Scholar]
- Shi, Y., Rieke, G. H., Hines, D. C., et al. 2006, ApJ, 653, 127 [NASA ADS] [CrossRef] [Google Scholar]
- Shi, Y., Rieke, G. H., Smith, P., et al. 2010, ApJ, 714, 115 [NASA ADS] [CrossRef] [Google Scholar]
- Strickland, D. K., & Heckman, T. M. 2009, ApJ, 697, 2030 [NASA ADS] [CrossRef] [Google Scholar]
- Strickland, D. K., Heckman, T. M., Weaver, K. A., & Dahlem, M. 2000, AJ, 120, 2965 [NASA ADS] [CrossRef] [Google Scholar]
- Strickland, D. K., Heckman, T. M., Colbert, E. J. M., Hoopes, C. G., & Weaver, K. A. 2004, ApJS, 151, 193 [NASA ADS] [CrossRef] [Google Scholar]
- Surace, J. A., Sanders, D. B., & Mazzarella, J. M. 2004, AJ, 127, 3235 [NASA ADS] [CrossRef] [Google Scholar]
- Swartz, D. A., Ghosh, K. K., Tennant, A. F., & Wu, K. 2004, ApJS, 154, 519 [NASA ADS] [CrossRef] [Google Scholar]
- Teng, S. H., & Veilleux, S. 2010, ApJ, 725, 1848 [NASA ADS] [CrossRef] [Google Scholar]
- Teng, S. H., Wilson, A. S., Veilleux, S., et al. 2005, ApJ, 633, 664 [NASA ADS] [CrossRef] [Google Scholar]
- Torrejón, J. M., Schulz, N. S., Nowak, M. A., & Kallman, T. R. 2010, ApJ, 715, 947 [NASA ADS] [CrossRef] [Google Scholar]
- Tueller, J., Baumgartner, W. H., Markwardt, C. B., et al. 2010, ApJS, 186, 378 [NASA ADS] [CrossRef] [Google Scholar]
- Ueda, Y., Akiyama, M., Ohta, K., & Miyaji, T. 2003, ApJ, 598, 886 [NASA ADS] [CrossRef] [Google Scholar]
- Veilleux, S., Kim, D.-C., Sanders, D. B., Mazzarella, J. M., & Soifer, B. T. 1995, ApJS, 98, 171 [NASA ADS] [CrossRef] [Google Scholar]
- White, N. E., Swank, J. H., & Holt, S. S. 1983, ApJ, 270, 711 [NASA ADS] [CrossRef] [Google Scholar]
- Winter, L. M., Mushotzky, R. F., Terashima, Y., & Ueda, Y. 2009, ApJ, 701, 1644 [NASA ADS] [CrossRef] [Google Scholar]
- Yaqoob, T., Murphy, K. D., Miller, L., & Turner, T. J. 2010, MNRAS, 401, 411 [NASA ADS] [CrossRef] [Google Scholar]
- Yuan, T.-T., Kewley, L. J., & Sanders, D. B. 2010, ApJ, 709, 884 [NASA ADS] [CrossRef] [Google Scholar]
- Zezas, A., Ward, M. J., & Murray, S. S. 2003, ApJ, 594, L31 [NASA ADS] [CrossRef] [Google Scholar]
All Tables
All Figures
|
Fig. 1 Comparison of the cumulative galaxy distributions as a function of the LIR of our sample of LIRGs and the extended parent sample (AAH06; see Sect. 2.1). |
| In the text | |
|
Fig. 2 XMM-Newton/EPIC pn 0.5–2 keV and 2–7 keV images (first and second panels), XMM-Newton/OM UVW2 (2120 Å) images for the galaxies observed with this filter (third panel). The third panel of Arp299 and MCG+04-48-002 corresponds to the XMM-Newton/OM UVM2 (2310 Å) filter. Spitzer/IRAC 3.6 μm images (forth panel). For reference we represent in the third and forth panels the smoothed 0.5–7 keV contours. The white line in the right panels represents 5 kpc at the distance of the galaxy. All images are shown in a square root scale. North is up and east is to the left. |
| In the text | |
|
Fig. 2 continued. |
| In the text | |
|
Fig. 2 continued. |
| In the text | |
|
Fig. 2 continued. |
| In the text | |
|
Fig. 3 EPIC pn (black) and combined EPIC MOS (red) 0.5–10 keV spectrum of NGC 2369 X-1 together with the spectral model consisting of an absorbed power-law (see Sect. 4.2). |
| In the text | |
|
Fig. 4 Observed EPIC pn (black) and combined EPIC MOS (red) 0.3–10 keV spectra, best-fitting model and residuals of the LIRGs observed by XMM-Newton. |
| In the text | |
|
Fig. 4 contenuied. |
| In the text | |
|
Fig. 5 Soft (0.5–2 keV; left) and hard (2–10 keV; right) X-ray luminosity corrected for absorption vs. SFR calculated combining the UV and IR luminosities (Sect. 3). Red stars are H II galaxies. Light green triangles and dark green circles are Type 1 and 2 Seyfert galaxies, respectively. Blue stars are composite galaxies, orange diamonds are LINERs and blue squares are galaxies without classification from optical spectroscopy. Galaxies from Ranalli et al. (2003) are plotted as gray circles. The solid line is our best linear fit to those LIRGs classified as H II and the Ranalli et al. (2003) galaxies. The dashed lines indicate the ± 1σ dispersion in this relation. |
| In the text | |
|
Fig. 6 Observed/expected hard X-ray (2–10 keV) luminosity ratio vs. SFR/M ⋆ ratio. The expected X-ray luminosity only includes the X-ray emission from LMXBs and HMXBs and is based on the relation LX = αM ⋆ + βSFR from Lehmer et al. (2010). The dashed lines indicate the scatter in this relation. Galaxy symbols are as in Fig. 5. |
| In the text | |
|
Fig. 7 Observed/expected 6.4 keV Fe Kα luminosity from star formation (see Sect. 6.3) vs. 2–10 keV luminosity. Galaxy symbols are as in Fig. 5. |
| In the text | |
|
Fig. B.1 Observed optical spectra of seven LIRGs from the 6dFGS database. |
| In the text | |
|
Fig. B.2 [N ii]λ6584/Hα versus [O iii]λ5007/Hβ diagnostic diagram for the nuclear spectra of six LIRGs. The black lines show the empirical separation between H II, AGN, and composite galaxies of Kewley et al. (2006). |
| In the text | |
Current usage metrics show cumulative count of Article Views (full-text article views including HTML views, PDF and ePub downloads, according to the available data) and Abstracts Views on Vision4Press platform.
Data correspond to usage on the plateform after 2015. The current usage metrics is available 48-96 hours after online publication and is updated daily on week days.
Initial download of the metrics may take a while.