Fig. 2
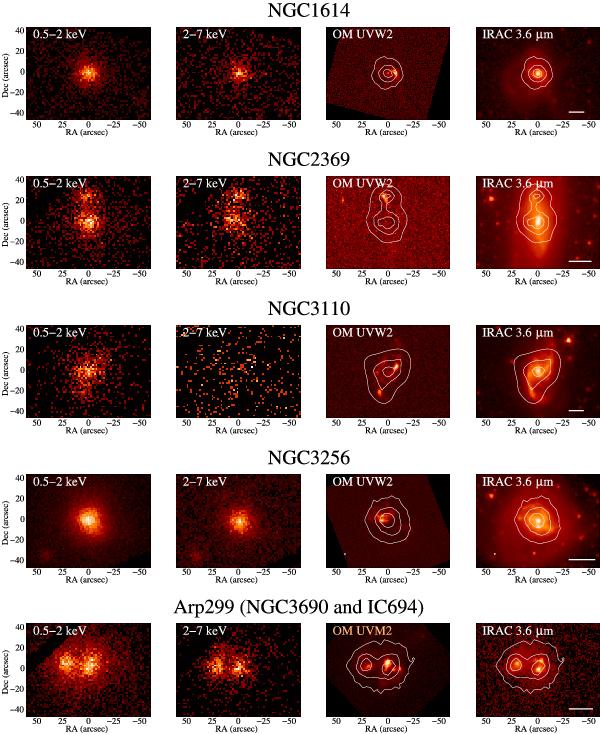
XMM-Newton/EPIC pn 0.5–2 keV and 2–7 keV images (first and second panels), XMM-Newton/OM UVW2 (2120 Å) images for the galaxies observed with this filter (third panel). The third panel of Arp299 and MCG+04-48-002 corresponds to the XMM-Newton/OM UVM2 (2310 Å) filter. Spitzer/IRAC 3.6 μm images (forth panel). For reference we represent in the third and forth panels the smoothed 0.5–7 keV contours. The white line in the right panels represents 5 kpc at the distance of the galaxy. All images are shown in a square root scale. North is up and east is to the left.
Current usage metrics show cumulative count of Article Views (full-text article views including HTML views, PDF and ePub downloads, according to the available data) and Abstracts Views on Vision4Press platform.
Data correspond to usage on the plateform after 2015. The current usage metrics is available 48-96 hours after online publication and is updated daily on week days.
Initial download of the metrics may take a while.