| Issue |
A&A
Volume 535, November 2011
|
|
|---|---|---|
| Article Number | A93 | |
| Number of page(s) | 20 | |
| Section | Extragalactic astronomy | |
| DOI | https://doi.org/10.1051/0004-6361/201117420 | |
| Published online | 17 November 2011 | |
Online material
Appendix A: Notes on individual sources
In this appendix we discuss the X-ray spectral analysis of some galaxies with XMM-Newton data.
NGC 3256
It is the most luminous nearby (z < 0.01) merger system. Its energy output is dominated by a powerful starburst. Previous ASCA, Chandra, and XMM-Newton X-ray observations of this galaxy have been analyzed in detail by Moran et al. (1999), Lira et al. (2002) and Jenkins et al. (2004), respectively. We used a simple model (absorbed vmekal + power-law) to fit the XMM-Newton spectrum. It provides an acceptable fit ( ) for our analysis. Jenkins et al. (2004) tentatively detected a Fe Kα emission line at ~ 6–7 keV. The higher S/N ratio data analyzed here clearly show an emission line at 6.60
 keV (Table 6). The energy of the line suggests that it is produced by ionized Fe, possibly related to supernovae activity. The upper limit for the EW of a neutral Fe Kα line at 6.4 keV is < 70 eV (Table 6). This low EW is not compatible with that expected from a luminous Compton-thick AGN.
Arp 299 (NGC 3690 and IC 694)
It is a luminous infrared (LIR = 6 × 10¹¹L⊙) merger system. It hosts one of the most powerful starbursts in local galaxies (Alonso-Herrero et al. 2009b). The X-ray emission below 10 keV is dominated by star formation, however a Compton-thick AGN is found in the system (Della Ceca et al. 2002). The hard X-ray spectrum of the nucleus of NGC 3690 indicates that the obscured AGN is probably located there (Zezas et al. 2003). Ballo et al. (2004) detected the Fe Kα emission feature in both system components NGC 3690 and IC 694. They found that the energy of the emission line in NGC 3690 is consistent with neutral iron, but in our fit the energy of the emission line is only poorly constrained (Table 6). The measured 6.4 keV Fe Kα flux is ~10 times higher than that expected from star formation suggesting the presence of an AGN in NGC 3690. The energy of the emission line in IC 694 is consistent with the Fe Kα from ionized iron that may be produced in highly ionized gas around the AGN or SN explosions (Ballo et al. 2004). For the fit we used a model consisting of an absorbed thermal plasma plus a power-law. We included a Gaussian profile to account for the Fe Kα emission lines.
MCG−03-34-064
This galaxy is classified as Seyfert 1.8. The soft X-ray spectrum is dominated by a thermal component likely produced by star formation and gas photoionized by the AGN. The AGN absorbed component dominates the spectrum in the hard X-ray range. An Fe Kα emission line is detected at 6.4 keV, consistent with neutral iron. A detailed analysis of the XMM-Newton data of this galaxy was presented by Miniutti et al. (2007).
IC 4518W
It is a Seyfert 2 galaxy. Its XMM-Newton and INTEGRAL observations are described by de Rosa et al. (2008). This is the only galaxy in the sample in which we detected two prominent emission lines in the hard X-ray spectrum, one at 6.39 ± 0.03 keV and a weaker emission line at 7.1 (Table 6). The former is compatible with Fe Kα emission from neutral Fe. The latter may be Fe Kα produced by highly ionized iron, Fe Kβ or these lines blended. Comastri et al. (2010) found the Fe Kβ line in some obscured AGN. However, the Fe Kβ/Fe Kα ratio from neutral iron is 0.12–0.17 (Palmeri et al. 2003) and the ratio between the 6.39 and the 7.1 keV emission lines in IC 4518W is larger (0.4). Accordingly there might be a contribution from the Fe xxvi Kα emission line.
MCG+04-48-002
This galaxy is classified as H II from optical spectroscopy, but its radio, hard X-ray emission, and mid-IR spectrum suggest the presence of an obscured AGN (Masetti et al. 2006; Pereira-Santaella et al. 2010). Suzaku observations of this galaxy were analyzed by Winter et al. (2009). We detected an emission line at 6.47 that is compatible with neutral Fe Kα. The high hydrogen column density (
 cm-2) toward the AGN and the powerful star-formation might explain why no AGN signatures are found in its optical spectrum.
NGC 7679
is a composite Seyfert 1/starburst galaxy. It is sometimes misclassified as Seyfert 2 (see Shi et al. 2010). The hard X-ray spectrum is well reproduced by a power-law model, but we had to add a soft thermal plasma component to account for the soft X-ray excess. Della Ceca et al. (2001) reported X-ray fluxes ~ 7 times higher in the soft and hard bands from the analysis of contemporaneous (1998) ASCA and BeppoSax observations of this galaxy. Previous X-ray observations of NGC 7679 are available with Einstein (1981) and ROSAT (1990). The fluxes in the 0.2–4 keV (Einstein) and 0.1–2.4 keV (ROSAT) bands are a factor of ~ 2 higher than those measured in the XMM-Newton data (Della Ceca et al. 2001). These flux variations reflect the long-term variability of the X-ray emission of this galaxy.
Appendix B: Optical classification
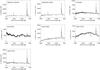 |
Fig. B.1
Observed optical spectra of seven LIRGs from the 6dFGS database. |
| Open with DEXTER | |
The optical spectra of seven galaxies in the parent sample of LIRGs (Alonso-Herrero et al. 2006, 2011) without a previous activity classification were obtained as part of the six-degree Field (6dF) Galaxy Survey (6dFGS DR3; Jones et al. 2004, 2009). Only four of these seven LIRGs are members of the subsample studied in this paper. However, we present the optical spectra of all of them because in Sect. 2 we compare the nuclear activity of both samples.
The optical spectra were obtained with the 6dF multi-object fibre spectrograph on the United Kingdom Schmidt Telescope (UKST) from 2001 to 2006. The fiber angular diameter is 6 7, which means that at the distance of these LIRGs it covers the central ~2 kpc of the galaxies (i.e., similar to the physical regions covered by the Veilleux et al. 1995 spectra of local LIRGs). Each object was observed with two gratings in the V (3900–5600 Å) and R (5400–7500 Å) bands for at least 1 h and 0.5 h, respectively. These two spectra were later spliced to obtain the final object spectrum. The spectral resolution is 5–6 Å in V and 9–12 Å in R. The spectra are not accurately flux-calibrated, but they can be used to calculate ratios of emission lines near in wavelength (see Lee et al. 2011). The spectra of the 7 LIRGs are shown in Fig. B.1.
We measured the Hβ, [O iii]λ5007 Å, Hα, and [N ii]λ6584 Å emission lines in the spectra by fitting a Gaussian to each emission line. The measured [N ii]/Hα and [O iii]/Hβ line ratios are listed in Table B.1. We did not correct Hβ for stellar absorption, so the calculated [O iii]/Hβ ratio should be considered as an upper limit.
To determine the nuclear activity of these galaxies, we used the standard optical diagnostic diagram [N ii]λ6584 Å/Hα vs. [O iii]λ5007 Å/Hβ (Baldwin et al. 1981). We adopted the boundaries between H II, AGN, and composite galaxies of Kewley et al. (2006). The diagram for these LIRGs is shown in Fig. B.2 and the adopted classifications are listed in Table B.1. Neither the Hβ nor the [O iii]λ5007 emission lines are detected in IC 4518E, therefore we do not plot this galaxy in Fig. B.2. We did not detect the [O iii]λ5007 Å emission line in the spectrum of IC 4280, so we plotted the upper limit of the [O iii]/Hβ ratio in Fig. B.2. This does not affect the H II activity classification of this galaxy (see Fig. B.2).
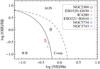 |
Fig. B.2
[N ii]λ6584/Hα versus [O iii]λ5007/Hβ diagnostic diagram for the nuclear spectra of six LIRGs. The black lines show the empirical separation between H II, AGN, and composite galaxies of Kewley et al. (2006). |
| Open with DEXTER | |
Observed optical emission line ratios and classification.
© ESO, 2011
Current usage metrics show cumulative count of Article Views (full-text article views including HTML views, PDF and ePub downloads, according to the available data) and Abstracts Views on Vision4Press platform.
Data correspond to usage on the plateform after 2015. The current usage metrics is available 48-96 hours after online publication and is updated daily on week days.
Initial download of the metrics may take a while.