| Issue |
A&A
Volume 532, August 2011
|
|
|---|---|---|
| Article Number | L6 | |
| Number of page(s) | 8 | |
| Section | Letters | |
| DOI | https://doi.org/10.1051/0004-6361/201117292 | |
| Published online | 21 July 2011 | |
Letter to the Editor
Discovery of the X-ray selected galaxy cluster XMMU J0338.8+0021 at z = 1.49
Indications of a young system with a brightest galaxy in formation⋆,⋆⋆
1
Max-Planck-Institut für extraterrestrische Physik (MPE), Giessenbachstrasse 1, 85748 Garching, Germany
e-mail: This email address is being protected from spambots. You need JavaScript enabled to view it.
2
Astrophysikalisches Institut Potsdam (AIP), An der Sternwarte 16, 14482 Potsdam, Germany
3
European Southern Observatory (ESO), Karl-Schwarzschild-Str. 2, 85748 Garching, Germany
4
Departamento de Astronomía y Astrofísica, Pontificia Universidad Católica de Chile, Casilla 306, Santiago 22, Chile
5
European Space Astronomy Centre (ESAC)/ESA, Madrid, Spain
Received: 19 May 2011
Accepted: 22 June 2011
Abstract
We report the discovery of a galaxy cluster at z = 1.490 originally selected as an extended X-ray source in the XMM-Newton Distant Cluster Project. Further observations carried out with the VLT-FORS2 spectrograph allowed the spectroscopic confirmation of seven secure cluster members, providing a median system redshift of z = 1.490 ± 0.009. The color-magnitude diagram of XMMU J0338.8+0021 reveals the presence of a well-populated red sequence with z − H ≈ 3, albeit with an apparent significant scatter in color. Since we do not detect indications of any strong star formation activity in these objects, the color spread could represent the different stellar ages of the member galaxies. In addition, we found the brightest cluster galaxy in a very active dynamical state, with an interacting, merging companion located at a physical projected distance of d ≈ 20 kpc. From the X-ray luminosity, we estimate a cluster mass of M200 ~ 1.2 × 10¹⁴ M⊙. The data appear to be consistent with a scenario in which XMMU J0338.8+0021 is a young system, possibly caught in a moment of active ongoing mass assembly.
Key words: galaxies: clusters: general / X-rays: general
Based on observations under programme ID 084.A-0844 collected at the European Organisation for Astronomical Research in the Southern Hemisphere, Chile, and observations collected at the Centro Astronómico Hispano Alemán at Calar Alto, operated jointly by the Max-Planck Institut für Astronomie and the Instituto de Astrofísica de Andalucía (CSIC).
Tables 1, 2 and Figs. 3–6 are available in electronic form at http://www.aanda.org
Guest astronomer at the MPE.
© ESO, 2011
1. Introduction
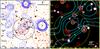 |
Fig. 1 Left: H-band image (4.5′ side length) of the environment of XMMU J0338.8+0021 at z = 1.490. The XMM-Newton detected X-ray emission is shown by the log-spaced blue contours, with the four lowest ones corresponding to significance levels of 2, 2.7, 3.6, 4.6σ above the mean background. The associated overdensity of color-selected red galaxies is displayed by the red contours, showing linearly spaced significance levels of 2–20σ. The large, black circles indicate the 0.5′/1′ radii around the X-ray center; the small black ones mark the spectroscopically confirmed cluster members, with the corresponding IDs. The image was smoothed with a 3 pixel (1.3″) Gaussian kernel. Right: z + H-band color composite image of the core region of the cluster. X-ray contours are displayed in cyan, red galaxies with 2.6 ≤ z − H ≤ 3.5 are marked by red dashed circles, spectroscopic members by white circles and interlopers (i.e. spectroscopically confirmed non-members) by green crosses. The 30″ radius from the X-ray center is indicated by the yellow circle. The white ruler represents the beam size (FWHM) of XMM-Newton at the observed off-axis angle of ~ 5.6′. |
The search for distant (z > 0.8) galaxy clusters has received a remarkble boost recently. By means of various selection methods, several clusters have been found in the redshift desert, at z ≥ 1.5. Papovich et al. (2010) and Tanaka et al. (2010) independently reported the detection of a new IRAC selected cluster at z = 1.62, characterized by a well-populated and tight red sequence. An additional multi-band analysis has revealed that the star formation activity in this cluster increases with the environment density, with star forming galaxies being mainly located at the center of the system (Tran et al. 2010). A similar trend has been observed in three other X-ray selected galaxy clusters, two newly confirmed at z = 1.56 (Fassbender et al. 2011) and z = 1.58 (Santos et al. 2011) and one at z = 1.46 (Hilton et al. 2009, 2010). However, the galaxy red-sequence of these systems has not yet been fully established yet, indicating that the members are still building their stellar mass via star formation activity. The situation is different in clusters found so far at z < 1.4, where active star-forming galaxies preferentially reside in the cluster outskirts (e.g. Balogh et al. 2004; Lidman et al. 2008; Patel et al. 2009). However, it is expected that more distant galaxy clusters contain a larger number of star-forming galaxies in their central regions (e.g. Hopkins et al. 2008; Rettura et al. 2010). In addition, early-type galaxies (ETGs) in clusters are known to have completed the formation of their stellar populations much more rapidly than ETGs in the field, and the red sequence is expected to start to disappear at z ≈ 2 toward higher redshift (Gobat et al. 2008). This last prediction is consistent with the results of Gobat et al. (2011), where the discovery of the most distant cluster known to date, at z = 2.07, is reported. In this system, the population of passive galaxies displays a very large intrinsic scatter in the Y − Ks color, with an apparent absence of an established red sequence. This suggests that as we acquire observations of increasingly high redshift, we are approaching the early stages of galaxy formation in the densest environments. All these new findings highlight the importance of detecting new distant galaxy clusters for a systematic investigation of the processes that drive galaxy evolution in different environments.
In this Letter, we report the discovery of an X-ray selected, spectroscopically confirmed galaxy cluster at z = 1.490, found within the XMM-Newton Distant Cluster Project (XDCP). We first present the X-ray data (Sect. 2.1) followed by a discussion of the near-infrared (NIR) imaging observations (Sect. 2.2) and the optical spectroscopy results (Sect. 3). In Sect. 4, we discuss the dynamical state of the system and its galaxy population. Our summary and conclusions are given in Sect. 5. For this paper, we assume a concordance ΛCDM cosmology, with (H0,ΩΛ,Ωm,w) = (70 km s-1, 0.7, 0.3, –1). For the given cluster redshift, the angular scale is 8.46 kpc/″. Magnitudes are in the Vega system.
2. Observations, data analysis, and results
The cluster XMMU J0338.8+0021 (hereafter X0338) was discovered within the XDCP, a serendipitous archival X-ray survey focussed on the identification of X-ray luminous systems at z > 0.8 (e.g. Mullis et al. 2005; Böhringer et al. 2005; Fassbender 2007; Fassbender et al. 2011).
2.1. X-ray selection with XMM-Newton
The X-ray source associated with the cluster X0338 was initially observed in 2002, in the XMM-Newton field with observation identification number (OBSID) 0036540101 and a nominal exposure time of 22.9 ks. It was detected as a weak source with SAS v6.5 at an off-axis angle of 5.6′, with a source significance of about 5σ and an extent significance of about 2.5σ. We reprocessed the field with SAS CMDv10.0 and, after applying a strict two-step flare-cleaning process, a clean net exposure time of 16.4/15.9 ks remained for the two EMOS cameras and 7.8 ks for the PN instrument. Figure 1 shows log-spaced X-ray contours (blue/cyan) of the cluster environment with significance levels of 2–16σ. For the flux measurement, we applied the growth curve analysis (GCA) method of Böhringer et al. (2000) in the soft 0.5–2 keV band and measured fX,500 ≃ (3.0 ± 1.8) × 10-15 erg s-1 cm-2 in a 40″ ( ≃ R500) aperture. At the cluster redshift, this translates into a 0.5–2 keV X-ray luminosity of LX,500 ≃ (4.1 ± 2.4) × 1043 erg/s. Owing to the faintness of the source at the limit of detectability, with ~ 33 net counts within an aperture of 24″, the determination of additional structural or spectral parameters is currently unfeasible and the extended nature of the source is tentative. However, based on the M − LX scaling relation in Pratt et al. (2009), with a modified redshift evolution (Fassbender et al. 2011; Reichert et al. 2011), a first rough estimate of the expected temperature ( ) and mass (M500) can be obtained, with
  keV and M500 ~ 0.8 × 10¹⁴ M⊙, corresponding to a total mass estimate of M200 ~ 1.2 × 10¹⁴ M⊙ under the assumption of a NFW profile. According to the above value, a bolometric luminosity
 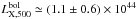 erg/s is finally estimated. We cannot rule out that part of the X-ray flux is due to contaminating point sources and, thus, the reported luminosities have to be taken as upper limits. All the estimated X-ray quantities are reported in Table 1.
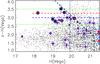 |
Fig. 2 Color–magnitude diagram of the cluster field. All galaxies with Dproj ≤ 30″ are displayed in red. The seven secure spectroscopic cluster members are marked by black squares (with blue dots for Dproj > 30″) and are all located within a color range 2.6 ≤ z − H ≤ 3.5 (green dotted lines), with an average color of z − H ~ 3. The interlopers found in the above color cut are marked by black crosses. Two simple stellar population (SSP) models for the cluster redshift are overplotted at z − H ~ 3, with solar metallicity and formation redshift of zf = 5 (red dashed line) or zf = 3 (blue dashed). The vertical dotted blue line indicates the apparent magnitude of an L* galaxy at z = 1.49, black dashed lines show the 50%-completeness limit. |
2.2. Near-infrared follow-up imaging
X0338 was photometrically confirmed as a significant overdensity of very red galaxies coinciding with its X-ray detection position, using the wide-field (15.4′ × 15.4′) NIR camera OMEGA2000 at the Calar Alto 3.5 m telescope. We obtained medium-deep H-band (50 min) and z-band (53 min) images of the X0338 field in 2006 under good, but non-photometric, conditions with a seeing of 1.2″. Re-observations with the z-filter were performed (5 min) in photometric conditions for the target and designated SDSS standard stars (Smith et al. 2002) for photometric calibration. The data were reduced with a designated OMEGA2000 NIR pipeline (Fassbender 2007). The Sextractor (Bertin & Arnouts 1996) photometry was calibrated to the Vega system using 2MASS point sources (Cutri et al. 2003) in H and SDSS standard stars in z. The limiting (Vega) magnitudes (50% completeness) were determined to be Hlim ~ 21.2 and zlim ~ 23.1, corresponding to absolute magnitudes of M∗ + 1.3 in H and M∗ in z for passively evolving galaxies at z ~ 1.5. Figure 1 (left) shows an H-band image of the cluster field with overlaid X-ray contours (blue), density contours of color selected galaxies with 2.6 ≤ z − H ≤ 3.5 (red), and marked spectroscopic cluster members as black circles. A zoom onto the core region is shown in Fig. 1, right. The z − H versus H color–magnitude diagram (CMD) of the field is shown in Fig. 2.
3. Spectroscopic analysis
3.1. Data reduction
X0338 was observed with FORS2-VLT on December 2009 (program ID:84.A-0844) with seeing conditions between 0.7″ and 1.1″. A single MXU slit-mask (field of view 6.8′ × 6.8′) with a total of 42 1″ width slits was used. The chosen instrument setup (300I grism without blocking filter) provides a wavelength coverage of 5800 − 10 500 Å, with a resolution of R = 660. The total net integration time was 8.4 ks. Raw data were reduced with a new FORS2 adaption of the VIMOS Interactive Pipeline Graphical Interface (VIPGI, Scodeggio et al. 2005), which includes all the standard reduction and wavelength calibration steps (Nastasi et al., in prep.). A total of 45 spectra were extracted, with a final calibration uncertainty of ~1 Å.
3.2. Redshift measurements
For the redshifts assessment, we firstly used the graphical VIPGI tools for a quick visual inspection and, then, the EZ software (Garilli et al. 2010) with a set of different galaxy spectra templates. The analysis confirmed the existence of seven galaxies in the redshift range 1.473 ≤ z ≤ 1.503 (Fig. 4), six of which have a projected distance from the X-ray emission peak of Dproj < 2′ and rest-frame velocity offsets of |Δv| < 2000 km s-1 with respect to the median redshift. This allows us to confirm the presence of a bound system of, at least, 7 galaxies with a median redshift of z = 1.490 ± 0.009. Using the biweight estimator (Beers et al. 1990), we obtain a crude velocity dispersion estimate of σv ≈ 670 km s-1 in the cluster rest frame, albeit with an associated large uncertainty owing to the poor quality of the statistics. The extracted spectra and the main properties of the confirmed members are shown in Fig. 4 and reported in Table 2, respectively. Several spectral features are identifiable, despite strong emission and absorption sky lines affecting the quality of the individual spectra. For the BCG, we extracted the spectra of both components ID:1-A and ID:1-B (Fig. 5), which are distinguishable in the 0.86″ seeing z-band preimage of Fig. 6. For ID:1-B, only a tentative redshift measurement of z = 1.5001 can be obtained owing to its low signal-to-noise ratio. To enhance the faintest features, an average, noise-weighted, spectrum of the seven members was created. The result is shown in Fig. 3 and compared with an LRG template spectrum (in red) typical of z ~ 0.5 luminous red galaxies (Eisenstein et al. 2003).
4. A young cluster in formation?
From the CMD in Fig. 2, we note that the red sequence of X0338 appears well populated. The eleven red galaxies, with colors 2.6 ≤ z − H ≤ 3.5 and brighter than the completeness limit, have a median (average) color of z − H = 2.9 mag (3.0 mag), which is consistent with the model prediction of z − H ≃ 3.0 mag for a stellar formation redshift of zf = 3, which represents an evolved red-sequence population, as seen in other distant clusters (XMMUJ1229, Santos et al. 2009; XMMUJ2235, Strazzullo et al. 2010). From the observed color spread of  mag, with an assumed flat slope and a Monte Carlo estimated contribution of the photometric errors of (0.16 ± 0.04) mag, we obtain a first order estimate of the intrinsic red-sequence scatter of
  ) mag. This is significantly larger than in the above cases, e.g. 0.08 for XMMUJ2235, but consistent with the findings of Hilton et al. (2009) for their z = 1.46 cluster. The estimated intrinsic scatter does not change if a non-flat slope (e.g. the one of XMMUJ2235 given by Strazzullo et al. 2010) for the fit is used. This larger scatter can be explained by stellar formation-age differences of the bright end of the red galaxy population of the order of 0.5–1 Gyr, as discussed in Hilton et al. (2009). The seven spectroscopic members show weak or no signs of ongoing star formation activity, with a measured equivalent width of the [OII] line in their spectra of |EW [OII]| ≤ 5 Å. Assuming that the above spectral features is a proxy of their star formation rate1, the measured values for EW [OII] indicate a very moderate intensity for such activity. The existence of a real, albeit weak, [OII] emission activity in the X0338 members is confirmed by the presence of such a spectral feature in the composite spectrum of Fig. 3. On the red sequence, we find a magnitude gap between the BCG and the second ranked member of Δm12 ≈ 0.8 mag. From the study of Smith et al. (2010) in the local universe, this indicates that the cluster is dinamically evolved, while the apparent offset of the BCG from the center of the X-ray emission (
 kpc) is a typical sign of a dynamically young clusters (Haarsma et al. 2010). This is in line with the cluster displaying indications of asymmetric X-ray emission with a low central surface brightness. A close-up study of the BCG, shown in Fig. 6, reveals a double-object morphology which indicates that the galaxy is actively assembling its mass after a merger event (implying that the aforementioned relatively large magnitude gap is a very recent feature). Because of the lack of detectable emission lines in ID:1-A and 1-B spectra, we conclude that this coalescence is likely to be a dry merger. The overall color and magnitude of the BCG are consistent with the ones found in red, passive, brightest galaxies residing in low-redshift clusters. The case of X0338 seems to suggest that we may be finally witnessing the active mass assembly epoch of BCGs, in contrast to the evolved counterparts observed at z ≲ 1.4 (e.g. Whiley et al. 2008; Collins et al. 2009). Our observations are consistent with a hierarchical assembly scenario for BCGs, albeit at a significantly earlier epoch than predicted from the cosmological simulation results of De Lucia & Blaizot (2007). The large scatter in the red sequence, the X-ray morphology, and the spatial distribution of color-selected red galaxies imply that this cluster is younger than e.g. XMMUJ2235, a scenario that will be critically tested by future deeper observations.
5. Summary and conclusion
We summarize our results as follows:
-
We have reported our study of a newly discovered galaxy clusterXMMU J0338.8+0021 at z = 1.490. This system was selected as an extended X-ray source serendipitously detected within the XDCP.
-
Spectroscopic follow-up has allowed us to confirm seven cluster members, six of which have Dproj < 1 Mpc and a rest-frame velocity offset |Δv| < 2000 km s-1 from the median redshift.
-
The H + z band data reveal the presence of a well-populated, albeit quite broadly spread, red sequence in the CMD, with a median color of z − H = 2.9 mag and an intrinsic color scatter of
 . Comparisons with SSP models suggest that the stellar populations of red sequence galaxies span formation epochs in the redshift range 3 ≲ zf ≲ 5.
 -
A BCG is clearly identifiable and found to be in an active mass assembly phase, likely via a dry merging process.
-
Our data overall suggest that X0338 is a young galaxy cluster that has not yet fully evolved, as the faint X-ray emission appears to be morphologically disturbed, and the large area over which its galaxies are found possibly indicates that these reside in infalling structures.
Our present interpretation is that X0338 has both features of an evolved cluster and at the same time of a dynamically young
system. More detailed studies are needed to help us perform a more complete characterization of this intriguing system and its components.
Online material
Main properties of XMMU J0338.8+0021.
Properties of spectroscopic members of XMMU J0338.8+0021.
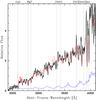 |
Fig. 3 Composite rest-frame spectrum of the seven member galaxies. The main features are marked by dotted lines and the total noise spectrum is shown in blue. An LRG template based on z ~ 0.5 luminous red galaxies (Eisenstein et al. 2003) is overplotted in red to show the good match with the low-z template. The spectrum is smoothed with a 7-pixel boxcar filter. |
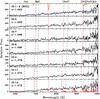 |
Fig. 4 One-dimensional spectra of the seven confirmed members of XMMU J0338.8+0021, smoothed with a 7 pixel boxcar filter. For each spectrum, an identification label (ID) and the measured redshift is reported. For the brightest component of the BCG (ID:1-A), the same LRG spectrum template used in Fig. 3 is overlaid in blue for comparison. In red, the sky features in absorption (top) and emission (bottom) are shown. The position of the main spectral features, shifted according to the corresponding redshift values, are marked by the vertical dashed lines. |
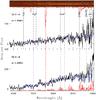 |
Fig. 5 Two-dimensional reduced spectra (top) and the one-dimensional extracted ones (bottom) for the two BCG components (ID: 1-A, 1-B). In the bottom panel, the ID number and the measured redshift for each spectrum is reported in the top left corner, and the corresponding best-fit LRG template is overlaid in blue. Because of the low signal-to-noise ratio of the data obtained for ID:1-B (whose spectrum is barely distinguishable in the top panel), its redshift value is only tentative. Both spectra have been smoothed with a 7 pixel boxcar filter. |
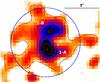 |
Fig. 6 Close-up z-band image of the BCG of XMMU J0338.8+0021, smoothed with a 0.7 arcsec Gaussian filter. The contours indicate the linearly spaced isophotes of the image cutout and the blue circle refers to an area of 3″ radius. The presence of a double-core system is clearly visible, indicating that the brightest galaxy is experiencing an ongoing assembly process. |
The presence of the [NeIII]λ3870 line for the ID:11 galaxy, however, suggests that it contains an obscured AGN.
Acknowledgments
The XMM-Newton project is an ESA Science Mission with instruments and contributions directly funded by ESA Member States and the USA (NASA). The XMM-Newton project is supported by the Bundesministerium für Wirtschaft und Technologie/Deutsches Zentrum für Luft- und Raumfahrt (BMWI/DLR, FKZ 50 OX 0001), the Max-Planck Society and the Heidenhain-Stiftung. This research has made use of the NASA/IPAC Extragalactic Database (NED) which is operated by the Jet Propulsion Laboratory, California Institute of Technology, under contract with the National Aeronautics and Space Administration. This work was supported by the Munich Excellence Cluster Origin and Structure of the Universe (www.universe-cluster.de), by the DFG under grants Schw536/24-1, Schw 536/24-2, BO 702/16-1,16-2,16-3, and the German DLR under grant 50 QR 0802. We thank the anonymous referee for its comments, which helped to improve this paper. We also thank Gabriel Pratt for its useful comments. A.N. would like also to thank Angela Bongiorno and Michele Cappetta for fruitful discussions and helpful comments.
References
- Balogh, M. L., Baldry, I. K., Nichol, R., et al. 2004, ApJ, 615, L101 [NASA ADS] [CrossRef] [Google Scholar]
- Beers, T. C., Flynn, K., & Gebhardt, K. 1990, AJ, 100, 32 [NASA ADS] [CrossRef] [Google Scholar]
- Bertin, E., & Arnouts, S. 1996, A&AS, 117, 393 [NASA ADS] [CrossRef] [EDP Sciences] [Google Scholar]
- Böhringer, H., Voges, W., Huchra, J. P., et al. 2000, ApJS, 129, 435 [NASA ADS] [CrossRef] [Google Scholar]
- Böhringer, H., Mullis, C. R., Rosati, P., et al. 2005, ESO Messenger, 120, 33 [Google Scholar]
- Collins, C. A., Stott, J. P., Hilton, M., et al. 2009, Nature, 458, 603 [NASA ADS] [CrossRef] [PubMed] [Google Scholar]
- Cutri, R. M., Skrutskie, M. F., van Dyk, S., et al. 2003, 2MASS All Sky Catalog of point sources, The IRSA 2MASS All-Sky Point Source Catalog, NASA/IPAC Infrared Science Archiv) [Google Scholar]
- De Lucia, G., & Blaizot, J. 2007, MNRAS, 375, 2 [NASA ADS] [CrossRef] [Google Scholar]
- Eisenstein, D. J., Hogg, D. W., Fukugita, M., et al. 2003, ApJ, 585, 694 [NASA ADS] [CrossRef] [Google Scholar]
- Fassbender, R. 2007, Ph.D. Thesis, Ludwig-Maximilians-Unversität München [arXiv:0806.0861] [Google Scholar]
- Fassbender, R., Nastasi, A., Böhringer, H., et al. 2011, A&A, 527, A10 [NASA ADS] [CrossRef] [EDP Sciences] [Google Scholar]
- Garilli, B., Fumana, M., Franzetti, P., et al. 2010, PASP, 122, 827 [NASA ADS] [CrossRef] [Google Scholar]
- Gobat, R., Rosati, P., Strazzullo, V., et al. 2008, A&A, 488, 853 [NASA ADS] [CrossRef] [EDP Sciences] [Google Scholar]
- Gobat, R., Daddi, E., Onodera, M., et al. 2011, A&A, 526, A133 [NASA ADS] [CrossRef] [EDP Sciences] [Google Scholar]
- Haarsma, D. B., Leisman, L., Donahue, M., et al. 2010, ApJ, 713, 1037 [NASA ADS] [CrossRef] [Google Scholar]
- Hilton, M., Stanford, S. A., Stott, J. P., et al. 2009, ApJ, 697, 436 [NASA ADS] [CrossRef] [Google Scholar]
- Hilton, M., Lloyd-Davies, E., Stanford, S. A., et al. 2010, ApJ, 718, 133 [NASA ADS] [CrossRef] [Google Scholar]
- Hopkins, P. F., Cox, T. J., Kereš, D., & Hernquist, L. 2008, ApJS, 175, 390 [NASA ADS] [CrossRef] [MathSciNet] [Google Scholar]
- Lidman, C., Rosati, P., Tanaka, M., et al. 2008, A&A, 489, 981 [NASA ADS] [CrossRef] [EDP Sciences] [Google Scholar]
- Mullis, C. R., Rosati, P., Lamer, G., et al. 2005, ApJ, 623, L85 [NASA ADS] [CrossRef] [Google Scholar]
- Papovich, C., Momcheva, I., Willmer, C. N. A., et al. 2010, ApJ, 716, 1503 [NASA ADS] [CrossRef] [Google Scholar]
- Patel, S. G., Holden, B. P., Kelson, D. D., Illingworth, G. D., & Franx, M. 2009, ApJ, 705, L67 [NASA ADS] [CrossRef] [Google Scholar]
- Pratt, G. W., Croston, J. H., Arnaud, M., & Böhringer, H. 2009, A&A, 498, 361 [NASA ADS] [CrossRef] [EDP Sciences] [Google Scholar]
- Reichert, A., Boehringer, H., Fassbender, R., & Muehlegger, M. 2011, A&A, submitted [Google Scholar]
- Rettura, A., Rosati, P., Nonino, M., et al. 2010, ApJ, 709, 512 [NASA ADS] [CrossRef] [Google Scholar]
- Santos, J. S., Rosati, P., Gobat, R., et al. 2009, A&A, 501, 49 [NASA ADS] [CrossRef] [EDP Sciences] [Google Scholar]
- Santos, J. S., Fassbender, R., Nastasi, A., et al. 2011, A&A, 531, L15 [NASA ADS] [CrossRef] [EDP Sciences] [Google Scholar]
- Scodeggio, M., Franzetti, P., Garilli, B., et al. 2005, PASP, 117, 1284 [NASA ADS] [CrossRef] [Google Scholar]
- Smith, J. A., Tucker, D. L., Kent, S., et al. 2002, AJ, 123, 2121 [Google Scholar]
- Smith, G. P., Khosroshahi, H. G., Dariush, A., et al. 2010, MNRAS, 409, 169 [NASA ADS] [CrossRef] [Google Scholar]
- Strazzullo, V., Rosati, P., Pannella, M., et al. 2010, A&A, 524, A17 [NASA ADS] [CrossRef] [EDP Sciences] [Google Scholar]
- Tanaka, M., Finoguenov, A., & Ueda, Y. 2010, ApJ, 716, L152 [NASA ADS] [CrossRef] [Google Scholar]
- Tran, K., Papovich, C., Saintonge, A., et al. 2010, ApJ, 719, L126 [CrossRef] [Google Scholar]
- Whiley, I. M., Aragón-Salamanca, A., De Lucia, G., et al. 2008, MNRAS, 387, 1253 [NASA ADS] [CrossRef] [Google Scholar]
All Tables
All Figures
|
Fig. 1 Left: H-band image (4.5′ side length) of the environment of XMMU J0338.8+0021 at z = 1.490. The XMM-Newton detected X-ray emission is shown by the log-spaced blue contours, with the four lowest ones corresponding to significance levels of 2, 2.7, 3.6, 4.6σ above the mean background. The associated overdensity of color-selected red galaxies is displayed by the red contours, showing linearly spaced significance levels of 2–20σ. The large, black circles indicate the 0.5′/1′ radii around the X-ray center; the small black ones mark the spectroscopically confirmed cluster members, with the corresponding IDs. The image was smoothed with a 3 pixel (1.3″) Gaussian kernel. Right: z + H-band color composite image of the core region of the cluster. X-ray contours are displayed in cyan, red galaxies with 2.6 ≤ z − H ≤ 3.5 are marked by red dashed circles, spectroscopic members by white circles and interlopers (i.e. spectroscopically confirmed non-members) by green crosses. The 30″ radius from the X-ray center is indicated by the yellow circle. The white ruler represents the beam size (FWHM) of XMM-Newton at the observed off-axis angle of ~ 5.6′. |
| In the text | |
|
Fig. 2 Color–magnitude diagram of the cluster field. All galaxies with Dproj ≤ 30″ are displayed in red. The seven secure spectroscopic cluster members are marked by black squares (with blue dots for Dproj > 30″) and are all located within a color range 2.6 ≤ z − H ≤ 3.5 (green dotted lines), with an average color of z − H ~ 3. The interlopers found in the above color cut are marked by black crosses. Two simple stellar population (SSP) models for the cluster redshift are overplotted at z − H ~ 3, with solar metallicity and formation redshift of zf = 5 (red dashed line) or zf = 3 (blue dashed). The vertical dotted blue line indicates the apparent magnitude of an L* galaxy at z = 1.49, black dashed lines show the 50%-completeness limit. |
| In the text | |
|
Fig. 3 Composite rest-frame spectrum of the seven member galaxies. The main features are marked by dotted lines and the total noise spectrum is shown in blue. An LRG template based on z ~ 0.5 luminous red galaxies (Eisenstein et al. 2003) is overplotted in red to show the good match with the low-z template. The spectrum is smoothed with a 7-pixel boxcar filter. |
| In the text | |
|
Fig. 4 One-dimensional spectra of the seven confirmed members of XMMU J0338.8+0021, smoothed with a 7 pixel boxcar filter. For each spectrum, an identification label (ID) and the measured redshift is reported. For the brightest component of the BCG (ID:1-A), the same LRG spectrum template used in Fig. 3 is overlaid in blue for comparison. In red, the sky features in absorption (top) and emission (bottom) are shown. The position of the main spectral features, shifted according to the corresponding redshift values, are marked by the vertical dashed lines. |
| In the text | |
|
Fig. 5 Two-dimensional reduced spectra (top) and the one-dimensional extracted ones (bottom) for the two BCG components (ID: 1-A, 1-B). In the bottom panel, the ID number and the measured redshift for each spectrum is reported in the top left corner, and the corresponding best-fit LRG template is overlaid in blue. Because of the low signal-to-noise ratio of the data obtained for ID:1-B (whose spectrum is barely distinguishable in the top panel), its redshift value is only tentative. Both spectra have been smoothed with a 7 pixel boxcar filter. |
| In the text | |
|
Fig. 6 Close-up z-band image of the BCG of XMMU J0338.8+0021, smoothed with a 0.7 arcsec Gaussian filter. The contours indicate the linearly spaced isophotes of the image cutout and the blue circle refers to an area of 3″ radius. The presence of a double-core system is clearly visible, indicating that the brightest galaxy is experiencing an ongoing assembly process. |
| In the text | |
Current usage metrics show cumulative count of Article Views (full-text article views including HTML views, PDF and ePub downloads, according to the available data) and Abstracts Views on Vision4Press platform.
Data correspond to usage on the plateform after 2015. The current usage metrics is available 48-96 hours after online publication and is updated daily on week days.
Initial download of the metrics may take a while.