Fig. 5
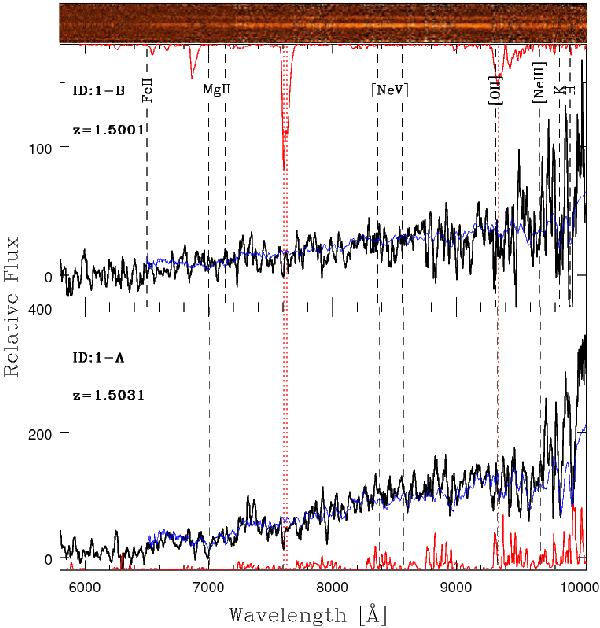
Two-dimensional reduced spectra (top) and the one-dimensional extracted ones (bottom) for the two BCG components (ID: 1-A, 1-B). In the bottom panel, the ID number and the measured redshift for each spectrum is reported in the top left corner, and the corresponding best-fit LRG template is overlaid in blue. Because of the low signal-to-noise ratio of the data obtained for ID:1-B (whose spectrum is barely distinguishable in the top panel), its redshift value is only tentative. Both spectra have been smoothed with a 7 pixel boxcar filter.
Current usage metrics show cumulative count of Article Views (full-text article views including HTML views, PDF and ePub downloads, according to the available data) and Abstracts Views on Vision4Press platform.
Data correspond to usage on the plateform after 2015. The current usage metrics is available 48-96 hours after online publication and is updated daily on week days.
Initial download of the metrics may take a while.