Fig. 2
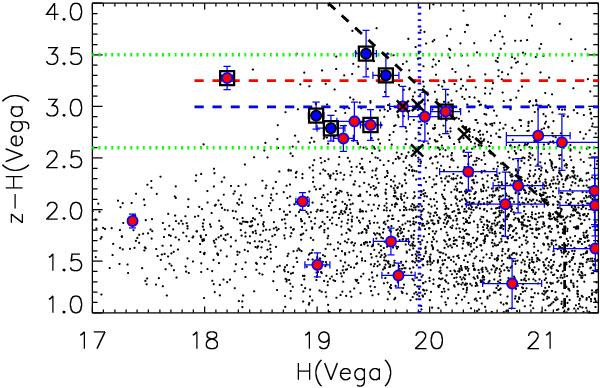
Color–magnitude diagram of the cluster field. All galaxies with Dproj ≤ 30″ are displayed in red. The seven secure spectroscopic cluster members are marked by black squares (with blue dots for Dproj > 30″) and are all located within a color range 2.6 ≤ z − H ≤ 3.5 (green dotted lines), with an average color of z − H ~ 3. The interlopers found in the above color cut are marked by black crosses. Two simple stellar population (SSP) models for the cluster redshift are overplotted at z − H ~ 3, with solar metallicity and formation redshift of zf = 5 (red dashed line) or zf = 3 (blue dashed). The vertical dotted blue line indicates the apparent magnitude of an L* galaxy at z = 1.49, black dashed lines show the 50%-completeness limit.
Current usage metrics show cumulative count of Article Views (full-text article views including HTML views, PDF and ePub downloads, according to the available data) and Abstracts Views on Vision4Press platform.
Data correspond to usage on the plateform after 2015. The current usage metrics is available 48-96 hours after online publication and is updated daily on week days.
Initial download of the metrics may take a while.