Fig. 1
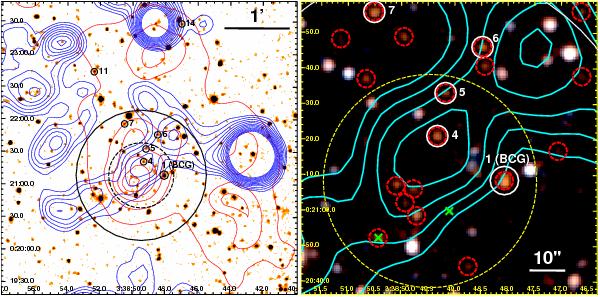
Left: H-band image (4.5′ side length) of the environment of XMMU J0338.8+0021 at z = 1.490. The XMM-Newton detected X-ray emission is shown by the log-spaced blue contours, with the four lowest ones corresponding to significance levels of 2, 2.7, 3.6, 4.6σ above the mean background. The associated overdensity of color-selected red galaxies is displayed by the red contours, showing linearly spaced significance levels of 2–20σ. The large, black circles indicate the 0.5′/1′ radii around the X-ray center; the small black ones mark the spectroscopically confirmed cluster members, with the corresponding IDs. The image was smoothed with a 3 pixel (1.3″) Gaussian kernel. Right: z + H-band color composite image of the core region of the cluster. X-ray contours are displayed in cyan, red galaxies with 2.6 ≤ z − H ≤ 3.5 are marked by red dashed circles, spectroscopic members by white circles and interlopers (i.e. spectroscopically confirmed non-members) by green crosses. The 30″ radius from the X-ray center is indicated by the yellow circle. The white ruler represents the beam size (FWHM) of XMM-Newton at the observed off-axis angle of ~ 5.6′.
Current usage metrics show cumulative count of Article Views (full-text article views including HTML views, PDF and ePub downloads, according to the available data) and Abstracts Views on Vision4Press platform.
Data correspond to usage on the plateform after 2015. The current usage metrics is available 48-96 hours after online publication and is updated daily on week days.
Initial download of the metrics may take a while.