| Issue |
A&A
Volume 530, June 2011
|
|
|---|---|---|
| Article Number | A135 | |
| Number of page(s) | 11 | |
| Section | Stellar structure and evolution | |
| DOI | https://doi.org/10.1051/0004-6361/201116736 | |
| Published online | 25 May 2011 | |
MOST observations of the roAp stars HD 9289, HD 99563, and HD 134214⋆
1
University of Vienna, Institute for Astronomy (IfA), Türkenschanzstrasse 17, 1180 Vienna, Austria
e-mail: This email address is being protected from spambots. You need JavaScript enabled to view it.
; This email address is being protected from spambots. You need JavaScript enabled to view it.
2
Department of Astronomy and Physics, Saint Mary’s University, Halifax, NS B3H 3C3, Canada
e-mail: This email address is being protected from spambots. You need JavaScript enabled to view it.
, This email address is being protected from spambots. You need JavaScript enabled to view it.
3 Sydney Institute for Astronomy (SIfA), School of Physics, University of Sydney, NSW 2006, Australia
e-mail: This email address is being protected from spambots. You need JavaScript enabled to view it.
4
Department of Physics and Astronomy, University of British Columbia, 6224 Agricultural Road, Vancouver, BC V6T 1Z1, Canada
e-mail: This email address is being protected from spambots. You need JavaScript enabled to view it.
; This email address is being protected from spambots. You need JavaScript enabled to view it.
5
Départment de physique, Université de Montréal, CP 6128, Succ. Centre-Ville, Montréal, QC H3C 3J7, Canada
e-mail: This email address is being protected from spambots. You need JavaScript enabled to view it.
6
NASA Ames Research Center, Moffett Field, CA 94035, USA
e-mail: This email address is being protected from spambots. You need JavaScript enabled to view it.
7
Department of Astronomy & Physics, University of Toronto, 50 St. George Street, Toronto, ON M5S 3H4, Canada
e-mail: This email address is being protected from spambots. You need JavaScript enabled to view it.
8
Harvard-Smithsonian Center for Astrophysics, 60 Garden Street, Cambridge, MA 02138, USA
e-mail: This email address is being protected from spambots. You need JavaScript enabled to view it.
9
Institute of Telecommunications, Vienna University of Technology, Gusshausstrasse 25/389, 1040 Vienna, Austria
e-mail: This email address is being protected from spambots. You need JavaScript enabled to view it.
Received: 16 February 2011
Accepted: 11 April 2011
Abstract
We report on the analysis of high-precision space-based photometry of the roAp (rapidly oscillating Ap) stars HD 9289, HD 99563, and HD 134214. All three stars were observed by the MOST satellite for more than 25 days, allowing unprecedented views of their pulsation. We find previously unknown candidate frequencies in all three stars. We establish the rotation period of HD 9289 (8.5 d) for the first time and show that the star is pulsating in two modes that show different mode geometries. We present a detailed analysis of HD 99563’s mode multiplet and find a new candidate frequency that appears to be independent of the previously known mode. Finally, we report on 11 detected pulsation frequencies in HD 134214, nine of which have never before been detected in photometry, and three of which are completely new detections. Thanks to the unprecedentedly small frequency uncertainties, the p-mode spectrum of HD 134214 can be seen to have a well-defined large frequency spacing similar to the well-studied roAp star HD 24712 (HR 1217).
Key words: stars: oscillations / stars: chemically peculiar / stars: magnetic field / stars: rotation
Based on data from the MOST satellite, a Canadian Space Agency mission, jointly operated by Dynacon Inc., the University of Toronto Institute for Aerospace Studies and the University of British Columbia, with the assistance of the University of Vienna.
© ESO, 2011
1. Introduction
Rapidly oscillating Ap (roAp) stars are cool magnetic, chemically peculiar stars with spectral types from early A to F0, luminosity class V. They were discovered by Kurtz (1982) and pulsate with low amplitudes (<13 mmag) at periods between 5 to 21 min. These pulsations are consistent with high-overtone (n > 15), non-radial p modes. The oblique pulsator model (hereafter OPM) as described by Kurtz (1982) has been, to a large extent, a very applicable explanation of their observed amplitude variability. It predicts that the pulsation axis is aligned with the magnetic axis, which itself is oblique to the rotation axis of the star. The OPM has since been refined to include additional effects like the Coriolis force (Bigot & Dziembowski 2002). For reviews of the primarily observational aspects of roAp stars, we refer to Kurtz & Martinez (2000) and Kochukhov (2007), and for the theoretical aspects, to Shibahashi (2003) and Cunha (2005).
The roAp stars offer strong potential for asteroseismology. This potential is difficult to achieve due to the small number of roAp stars known, their short pulsation periods and low amplitudes, and (apparently) very few observable modes. Recent investigations with the WIRE, MOST, and Kepler satellites, as well as ground-based high-resolution spectroscopy, have allowed us to study these objects with an unprecedented level of detail.
Encouraged by the success of previous MOST observations of roAp stars γ Equ (Gruberbauer et al. 2008) and 10 Aql (Huber et al. 2008), new observations of other roAp stars accessible to MOST were planned and performed with the primary goal of detecting additional frequencies. In this paper we report our findings on the targets HD 9289, HD 99563, and HD 134214.
HD 9289 (V ≈ 9.4) was originally classified as ApScEu by Bidelman & MacConnell (1973) and is now considered to be an A3p star (see Ochsenbein et al. 1981, and references therein). It was discovered to be a rapidly oscillating Ap star by Kurtz et al. (1994). The authors observed HD 9289 on 22 nights, spanning several months from 1993 to 1994, and identified three individual frequencies around ~1550 μHz. The latest results for this star were obtained spectroscopically by Ryabchikova et al. (2007), who were able to refine the values of some of its fundamental parameters. Most notably, they were able to estimate vsini = 10.5 km s-1 and ⟨ BP ⟩ = 2.0 kG for the first time.
The first discovery of roAp pulsation in HD 99563 was reported by Dorokhova & Dorokhov (1998). The star was later studied extensively using long-timebase, ground-based photometry (Handler et al. 2006), as well as spectroscopy (Freyhammer et al. 2009). HD 99563 is particularly interesting for the latter type of study because its pulsation shows large radial velocity amplitudes compared to other objects of this class. In all studies conducted so far it was found to pulsate in a single intrinsic pulsation mode which is split into a multiplet due to the effects predicted by the OPM.
HD 134214 was initially recognised to be a roAp star in 1985. A first thorough frequency analysis resulted in a single prominent mode with an amplitude of several mmag, at a frequency of 2949.6 μHz (Kreidl & Kurtz 1986). No signs of rotational multiplets were detected. Subsequent observations did not reveal additional frequencies, but indicated that the frequency of the mode was periodically changing with a period of about 250 days (Kreidl et al. 1994). More than a decade later, time-resolved high-resolution spectroscopy of several roAp stars revealed signatures of previously unseen frequencies in almost all the stars in the sample, including HD 134214 (Kurtz et al. 2006). This new variability was only observed in specific lines in the upper stellar atmosphere. Apparently, their amplitudes were too small for them to be detected with previous ground-based photometric observations. A 10-h run with the MOST satellite could not confirm any of the newly reported signals, but it set an upper 2-σ detection limit of 0.36 mmag for the corresponding amplitudes in the MOST bandpass (Cameron et al. 2006). A later spectroscopic run dedicated to HD 134214 (Kurtz et al. 2007), was intended to clarify the values of the newly seen frequencies. Due to the relatively short duration of the observations, and the apparent dependence of the frequency solution on the used spectral lines, no general list of new modes could be given. Nonetheless the general properties of the previously detected signals was confirmed and one of the additional frequencies detected in photometric observations.
2. Observations and data reduction
MOST (Microvariability and Oscillation of STars) is a Canadian microsatellite designed for the rapid-cadence observation of stellar photometric variability on a level of a few parts-per-million (ppm). The satellite is in a sun-synchronous polar orbit, above the terminator, and has an orbital period of 101 min. It is able to observe bright stars in its continuous viewing zone (CVZ) for up to 2 months. It houses a Maksutov telescope with an aperture of 15 cm, a custom broadband filter (3500 − 7000 Å), and two CCDs. One CCD was originally designed to be exclusively employed for satellite guiding (Tracking CCD), while the other CCD should collect the scientific observations (Science CCD). To accomplish its task more accurately, the latter is equipped with a Fabry-lens array covering a small part of the detector area. When observing stars in the upper brightness range of the instrument, the Fabry lenses are used to reduce the jitter of the image that is caused by pointing instabilities and to avoid saturation by spreading the light over a very large number of pixels. In contrast, dimmer programme stars and guide stars are observed in the open field (Direct Imaging – DI). A more detailed description of the early mission is given by Walker et al. (2003). In 2006 the Tracking CCD stopped working, and the Science-CCD software was modified to additionally provide the information for the attitude control system (ACS). Since the ACS constantly needs information about the satellite pointing, stars are observed with short exposure times, but the individual exposures are stacked to reach and improve upon the original levels of photometric precision achieved by MOST.
As explained by Reegen et al. (2006), MOST suffers varying amounts of stray light as it orbits about the partially illuminated Earth, which causes artificial signal at multiples of the MOST orbital frequency. In addition, this non-stellar signal is modulated throughout an observational run because of changes in the average albedo of the illuminated limb of the Earth as seen from the position of the satellite. This modulation occurs on timescales comparable to a sidereal day. Longer-term instrumental drifts are sometimes also present, but MOST has shown instrumental stability of about 1 mmag over intervals of years. The MOST team has become very familiar with these effects, and photometric reduction pipelines for the different MOST observing modes (Reegen et al. 2006; Rowe et al. 2006; Huber & Reegen 2008; Hareter et al. 2008) effectively filter the artifacts in many cases while leaving the stellar signals intact.
All three roAp stars discussed in this paper have been observed using the DI mode. The general properties of these data sets are summarised in Table 1. This table also includes what we call the “effective duty cycle”  (1)where ⟨ Δt ⟩ is the median time stamp difference between two adjacent data points, N is the total number of observations, and
  is the total time baseline of the resulting time series. The median is not very sensitive to outliers, and so closely reflects the effective sampling of the time series, even if sporadic under-sampling occurs due to larger gaps.
Summary of the MOST data sets of HD 9289, HD 99563, and HD 134214.
One can also define an effective sampling frequency  (2)similar to the definition of the Nyquist frequency. This, in combination with the window function, is a good measure of the actual sampling quality of the data.
2.1. HD 9289
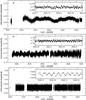 |
Fig. 1 Reduced MOST light curves of a) HD 9289, b) HD 99563 and c) HD 134214. The inserts show a small portion of a version of the light curve where any variability not due to roAp pulsation has been subtracted. For the insert in panel a), a 5-point running average is displayed instead of the unbinned data, in order to enhance the clarity of the weaker pulsation signature. Note that JD2000 = 2 451 545.0. |
MOST observed HD 9289 for about 22 of the 26 days during September 27 to October 23, 2007. After the first day of observation a 4-day gap occurred, and during the first 16.4 days of observation MOST alternated between two fields of view. During this setup HD 9289 was monitored for 4 consecutive orbits, after which MOST switched to the other primary target for the duration of 1 orbit, and then back to HD 9289. For the remaining 10.6 days, however, HD 9289 was observed without interruption. The vast majority (>99%) of the measurements consisted of image stacks of 20 exposures each, with a total exposure time of 32.13 s.
The data were reduced with the DI-pipeline developed by Huber & Reegen (2008). Different pipeline parameters were set to produce two versions of the light curve: the “final light curve” version, where instrumental effects are suppressed as far as possible, and the “consistency check” version that underwent a less invasive treatment and more closely reflects the raw data. For each version of the reduction, about 4200 frames (about 10% of the total number in the time series) were rejected during the initial stages of the reduction process because of heavy stray light pollution, and/or excessive cosmic-ray incidence in the proximity of the southern Atlantic anomaly (SAA). The values cited in Table 1 refer to the light curve with the smallest instrumental contributions. Apart from increased scatter at high-stray light orbit phases and possible long-term trends, no obvious instrumental effects are present in the final light curve (see Fig. 1). It shows a regular double-hump variation with a period of about 8.5 days which has been tracked for almost 3 cycles. This is actually rotational modulation of the mean stellar brightness, probably due to spots. It is the first time that such a signature has been detected for HD 9289. The insert in panel a of Fig. 1 also demonstrates the presence of the short-period roAp pulsations.
2.2. HD 99563
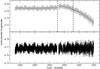 |
Fig. 2 Light curve of HD 99563 after processing with the reduction pipeline (top) and after subtraction the instrumental long-term trends (bottom). The dashed vertical lines separate the individually fitted subsets of the time series. |
MOST monitored HD 99563 for about 26 days during February 25 to March 23, 2008. However, the first day of observation did not yield any usable data. A second target was observed in a different field, hence MOST was re-oriented every 3rd orbit for about 50 min, decreasing the duty cycle. Almost all of the remaining frames consist of 15 stacked exposures, with a total integration time of 32.32 s. With respect to the reduction, the same steps were performed as for HD 9289. However, due to a change in the observation setup at JD − JD2000 ≈ 2992.5 (JD2000 = 2 451 545.0) there is a half-day gap in the time series. The data obtained beyond this gap are of slightly lower quality due to an increase in stray light, and a long-term instrumental trend, which is also reflected in the board temperature telemetry1. To improve the situation the latter parts of the light curve were treated separately using different parameters for the reduction pipeline. The data set was then homogenised by fitting and subtracting polynomials of second order to the two parts (see Fig. 2). The final light curve is shown in Fig. 1b. There is obvious variability on timescales much longer than what is expected from the pulsation alone. Some of the variability is caused by the OPM effect, which modulates the pulsation amplitude over one stellar rotation cycle. A second variability component is due to rotational modulation of the mean stellar brightness, which has already been detected in previous studies (e.g., Handler et al. 2006). Because of the broad MOST bandpass (about 350 − 700 nm) and the wavelength dependence of Ap rotational modulation, this signal is much weaker than what Handler et al. found in the ground-based data with a standard blue filter. It is also less pronounced than the spot effects in HD 9289. A third component is purely instrumental and caused by complex onboard temperature variations due to the target switching. We did not attempt to remove this component during the reduction process in order to not distort the intrinsic rotational effects on the pulsation.
2.3. HD 134214
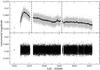 |
Fig. 3 Same as Fig. 2 but for HD 134214. On top of the long-subset polynomial fits the top panel also shows a 200 pt running average used as a high-pass filter. |
HD 134214 was observed for about 26 days during April 18 to May 14, 2008. Each MOST orbit was shared equally between this star and another science target field throughout the run, reducing the duty cycle to about 50 per cent. The majority of images are stacks of 19 exposures (total integration time: 30.2 s). Again, we used the same steps to reduce the data as in the analysis of HD 9289, yielding two versions of the light curve. The only difference is that, after reduction, long-term trends, which correlate with board temperature variation, are still visible in the data. These have been removed from the light curve (see Fig. 3) in two ways. First we fitted and subtracted fourth order polynomials from three distinct subsets of the light curve clearly separated by larger gaps. However, we also noticed a modulation of the board temperature on short time scales due to the target switching. Due to the absence of any obvious rotational signature, we therefore also used a high-pass filter, removing any variations on time-scales longer than the MOST orbital period. The latter approach produced fewer instrumental artefacts, and the result is referred to as the “final light curve” for HD 134214. However, we repeated all further analysis steps also for the less intrusive approach to make sure that we did not actually introduce any fake signal. The final light curve is dominated by the roAp pulsation and does not show any significant long-term variability after removing the instrumental trends.
3. Frequency analysis
The final light curves were analysed using the latest version of SigSpec (Reegen 2007). SigSpec 2.0 performs an iterative multi-cosine fit to time-series data, based on the “spectral significance” (or sig) as a significance criterion. The sig is defined as the negative logarithm of the probability that a periodic signal of the form acos(2πνt − θ) (where a is the amplitude, ν is the frequency, and θ is usually called the phase) is caused by white noise. SigSpec starts by computing the sig for a given range in frequency and finding the frequency, amplitude, and phase that correspond to the smallest false-alarm probability. It then refines the solution by performing a least-squares fit in the time domain. Subsequently, the solution is subtracted from the time-series, and the sig is computed for the residuals. This continues iteratively, each time adding another component to the least squares multi-cosine fit, until no signal is found with a sig above a certain threshold. Formally, an amplitude-to-noise ratio of 4, which is generally assumed to be a conservative lower limit, corresponds to sig ≈ 5.46. Self-evidently, the definition of the sig is only truly valid in the case of a single sinusoidal signal in the presence of white noise. The results therefore have to be interpreted with care, and often a higher threshold than 5.46 is sensible.
Even when data reduction is performed thoroughly, a number of significant instrumental signals due to stray light or target field switches can remain in MOST time series. Any gaps due to target switching and/or outlier removal during high stray light phases make it imperative to correctly pre-whiten these signals together with the intrinsic frequencies. To properly take this into account in the analysis of the three roAp stars we proceeded as follows.
In the first step, SigSpec was used to calculate the most probable multi-cosine solution down to a sig threshold of 5.46 for each reduced light curve. The upper limit in frequency for the SigSpec analysis was set for each star so we could detect a possible harmonic to the main pulsation frequency. The same calculation was performed for time series composed of the mean background measurements, and also board temperature measurements, as provided by the reduction pipeline. For each star, the resulting frequencies of all time series were then compared and put into one of three categories.
-
1.
Instrumental artefacts. (a) Identifiable in boththe stellar photometry and in either background or temperaturetelemetry; and/or (b) obviously related to aharmonic of the MOST orbital frequency(≈ 14.19 d-1). Their amplitudes vary drastically in the stellar time series when different pipeline parameters are used.
-
2.
Intrinsic low-frequency variability. Any highly significant signals at lower frequencies (i.e., due to rotational modulation caused by spots) and found in both reduced light curves but not in the background/telemetry.
-
3.
Intrinsic pulsation (candidates). Possible pulsation frequencies, in particular signals in the range associated with roAp oscillations, that are found in the more and the less invasively reduced light curves but not in the background/telemetry.
Frequencies in categories 2 and 3 were checked for consistency with Period04 (Lenz & Breger 2005). For further time-resolved analysis of the pulsation candidates, all signals except those in category 3 were subtracted from the light curves. The uncertainties for frequencies, amplitudes, and phases are analytical lower limits calculated with Period04. We cross-checked these values with the SigSpec results using the heuristic relations from Kallinger et al. (2008). The latter provide a reliable upper limit in the uncertainties. Interpreting these as 4σ confidence limits we find both results to be highly consistent.
3.1. HD 9289
The results of the frequency analysis for HD 9289 are presented in Table 2. The MOST data reveal the presence of 6 intrinsic significant frequencies between 1570 and 1590 μHz. In the low-frequency range, we can also find signals corresponding to the rotational modulation. However, in contrast to the high frequency signals, the exact values of these low frequencies depend on the reduction procedure used. This reflects the fact that it is very difficult to preserve the exact nature of long-term trends in space photometry due to the lack of calibration sources and procedures. This can lead to problems with analyses using the discrete Fourier transform (DFT), which expects a periodic harmonic behaviour of the variations that are analysed.
Since we can assume that the rotational modulation of roAp stars, caused by spots, is stable across many cycles, any deviations are likely instrumental. We can therefore apply the phase dispersion minimization technique (PDM, Stellingwerf 1978) to obtain an estimate of the rotation frequency based on the periodicity of the signal, more independent of the exact preservation of its shape. We used the PDM technique on the two reduced light curve versions, as well as on a raw data version that was filtered as to best preserve the intrinsic long term variations. We then calculated the mean and standard deviation of the resulting rotation frequencies, noted as νrot,PDM in Table 2. Luckily, this crude estimate can be improved upon, since there are other ways to get a less reduction-dependent estimate of the rotation frequency, νrot,puls, as discussed in Sect. 4.1.
A large number of additional weak signals with frequencies below 10 d-1 are present as well, but a comparison with the background and board temperature reveals that most of them are instrumental. We conclude that we cannot reliably assess the intrinsic nature of any additional low-frequency variability. Figure 4 compares the amplitude spectrum before and after pre-whitening all signals that are members of category 1 and 2. Figure 7 shows a schematic spectrum of the pulsation multiplets.
Frequency analysis results for HD 9289.
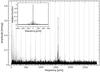 |
Fig. 4 DFT of the HD 9289 data without any pre-whitening (grey) and after pre-whitening of all category 1 and 2 signals as defined in Sect. 3 (black). The insert shows the window function of the data set. Vertical dotted lines show the MOST orbital frequency and its integer mulitples. |
3.2. HD 99563
As presented in Fig. 5, a large number of instrumental artefacts with substantial amplitudes can be identified in the low-frequency regime. This stems from target switching, as discussed in Sect. 2.2. Nonetheless, we can identify what seems to be the stellar rotation frequency and one of its harmonics. However, the value found for the “fundamental” is 3.902(5) μHz, which is inconsistent with the precise value given by Handler et al. (2006). The second frequency interpreted to be the first harmonic found at 7.970(3) μHz is in better agreement with the previously published value, but it is still too far off given the formal uncertainties, and incompatible with our value of the “fundamental”. A PDM analysis of the least noisy parts of the data yields a value of 3.95 μHz, but the result is not well constrained due to the small amplitude of the variation. We thus conclude that we cannot improve the accuracy of the rotation period using the mean light variation.
Concerning pulsation frequency candidates, we treated HD 99563 in a special way, since its main (and hitherto only) pulsation frequency is already so well studied. We first performed our unbiased, unconditioned analysis as explained at the beginning of the section. The results for this approach are presented in Table 3. As expected, we find 7 more or less equally spaced frequencies centred at ≈ 1557.7 μHz. We also find a second group of frequencies composed of integer multiples (commonly called “harmonics”) and linear combinations of the septuplet frequencies. The broad picture is mostly consistent with previous observations. We do detect the (− 2, +2) components that Handler et al. could not find in their ground-based data. However, we cannot find the outermost (− 4, +4) nonuplet components that Freyhammer et al. report. A closer look reveals additional discrepancies. The frequency value for the central component of the septuplet differs by almost 3σ. We also find a number of additional significant frequencies in between the septuplet. These candidates are labeled ν8 to ν12 in Table 3.
Most of the remaining frequencies found are consistent with well-known stray light artefacts, situated at multiples of the MOST orbital frequency. What is left can be explained through another effect: modulation of the stellar signal with the MOST orbital frequency νMOST. We find formally significant frequencies at ν2 ± nνMOST and ν3 ± nνMOST, where n is an integer up to n = 3. This is not aliasing, as one might think when looking at the window function of the data set, but rather an actual instrumental modulation of the measured stellar signal. These effects cannot be easily corrected for, but they can easily be identified in the course of the frequency analysis.
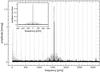 |
Fig. 5 Same as Fig. 4 but for HD 99563. Notice the presence of a small signal “hump” due to the harmonic to the main pulsation frequency, and combination frequencies, at about 3110 μHz. Another small hump at about 2380 μHz is caused by aliasing. |
The rotation period of HD 99563 can’t be determined to high accuracy from the light modulation signal in the MOST time series. But it can be obtained independently, and in an unbiased way, from the average spacing of the OPM multiplet. We find ⟨ νrot ⟩ = 3.985(7) μHz, which is compatible with the literature, but obviously not precise enough to be considered an improvement.
We also chose a second approach that would more closely reflect our prior knowledge of HD 99563’s pulsation and rotation. Handler et al. give a quite precise value for the rotation frequency of the star νrot,Handler = 3.9749(1) μHz. Using this value, we forced a fit to a nonuplet with the corresponding spacing, looking for whatever frequency gave the best results. The fitting procedure was carried out using Period04, after all category 1 and 2 signals had already been subtracted. The result is νp = 1557.67(1) μHz, which is closer to what Handler et al. found for their data set. If this value is changed to the exact previously known value, the residuals to the fit show no significant change. Therefore, we also fixed the pulsation frequency to νp = 1557.6529 μHz. We then proceeded with a pre-whitening sequence to look for additional frequencies. After each iteration we allowed the multi-sine fit to improve the frequencies, amplitudes, and phases for any additional signal found, as well as amplitudes and phases of all nonuplet frequencies. I.e., we kept νp and νrot fixed to the values matching the results of Handler et al.. The outcome of this analysis is presented in Table 4 and a comparison of the forced and the unconditional solutions is shown Fig. 7.
Unconditional multi-frequency fit results for HD 99563.
Multi-frequency fit results for HD 99563, forcing the frequency solution to match νrot given in Handler et al. (2006).
3.3. HD 134214
The case of HD 134214 is more straightforward, since we can rule out rotational modulation on timescales of our observations. As shown in Fig. 6, the data reveal a main pulsation frequency at 2949.5 μHz with a large amplitude of 1.8 mmag. Due to the strength of this signal the same instrumental modulation effect as in HD 99563 can be observed to even higher integer multiples. To be most conservative in our analysis, we therefore excluded any other signal that is close to ν1 ± nνMOST for any n. Naturally, we also excluded the usual integer multiples of the MOST orbital frequencies as well. Applying these criteria to the whole range considered (down to zero and up to 6000 μHz), we retain 10 significant frequencies below 3000 μHz. These are shown in Fig. 8. Their values are listed in Table 5.
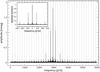 |
Fig. 6 Same as Fig. 4 but for HD 134214. Notice that the harmonic to the main frequency can be seen as a small peak at 5900 μHz. |
Frequency analysis results for HD 134214.
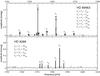 |
Fig. 7 Schematic pulsation spectrum of HD 99563 (top) and HD 9289 (bottom). Labels indicate multiplet frequencies and corresponding combinations. The thin lines show the residual amplitude spectra after pre-whitening of the identified frequencies. The top panel shows both the unconditional (black circles) and forced (grey squares) solutions for HD 99563. Note the different scales for both panels. |
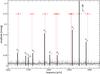 |
Fig. 8 Schematic pulsation spectrum of HD 134214. Squares indicate the frequencies reported in Kurtz et al. (2007). The error bars show our estimated upper limits for their uncertainties derived from their data set length. The arrow in the upper right corner indicates that the main pulsation frequency has a much higher amplitude (≈2 mmag) which would explode the scaling of the figure. The residual amplitude spectrum after pre-whitening of the identified frequencies, and a 50-point running average, is also shown. |
4. Discussion
4.1. The pulsation of HD 9289
The results presented here for HD 9289 are inconsistent with the findings of Kurtz et al. (1994). Their analysis yielded three frequencies, νK,1 = 1585.06(1) μHz, νK,2 = 1554.79(1) μHz, and νK,3 = 1605.39(1) μHz. The authors acknowledged, however, that due to severe 1 d-1 aliasing the frequencies might have been confused with their aliases. A comparison to Table 2 shows that the primary frequency is similar in both data sets but the exact values do not agree within the uncertainties. We do not find any frequencies that have values close to νK,2 or νK,3, and we do not expect any instrumental artefacts that would possibly complicate the detection of these frequencies. However, νK,3 is consistent with an alias of ν2, with νK,3 = ν2 + 2c within the uncertainties. Here, c ≈ 11.574 is the conversion factor from d-1 to μHz. A possible match for νK,2 ≈ ν6 − 2c is much more strenuous and the disagreement is too great to reconcile it with the uncertainties. In any case, it is plausible that the results from Kurtz et al. (1994) suffered a misidentification due to aliasing. It is not impossible, however, that the different results stem from an intrinsic change in HD 9289’s pulsation behaviour.
We know from the rotational modulation of the light curve that vrot ≈ 1.35 μHz. Thus, the spacing in the main “triplet” (ν1, ν2, ν3) appears to be twice the rotation frequency. Similarly, the second multiplet (ν4, ν5, ν6) also contains information about the rotation in its spacings. Whatever the nature of these modes is, if our interpretation is correct, this allows us to obtain an estimate of the rotation frequency which is independent of the mean variations induced by spots. Using  as weights, where σν are the 1σ frequency uncertainties derived as described in Sect. 3, we calculated the weighted average of the spacings of adjacent peaks in the multiplets. Note that this corresponds to a weighting with the spectral significance (or the square of the SNR), since
 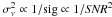 (Kallinger et al. 2008). The result is νrot,puls = 1.361(7) μHz, corresponding to a period Prot = 8.50(4) d. This estimate is more precise than the estimate from PDM. Therefore, invoking the OPM, we actually observe components of (at least) a quintuplet with two components undetected (ν1 + νrot and ν1 − νrot). Hence, under this assumption the mode cannot be described by a pure dipole. The question that remains is whether the undetected components are actually missing, or whether they are simply too small to be significant in the MOST data.
Figure 9 shows a time-resolved analysis of HD 9289’s pulsation. We fitted a cosine with fixed frequency ν1 but free amplitude and phase to small subsets of the light curve after pre-whitening of all frequencies not related to the main triplet. A subset length of 1 d, analysed in steps of 0.1 d, was chosen as the best compromise between reducing the uncertainties of the fitted parameters and increasing the time resolution. The result is that the pulsation amplitude is modulated twice per rotation cycle, while the pulsation phase remains roughly constant throughout. Given the large uncertainties at epochs of low pulsation amplitude, there might be changes in phase that simply cannot be reliably detected with the current data. A strong dipole component, showing two amplitude maxima per rotation cycle connected to the two pulsation poles, would produce a phase shift of π at quadrature. The fact that we do not see a phase shift but a clear amplitude modulation, is consistent with HD 9289 being dominated by a quadrupolar (ℓ = 2, m = 0) pulsation mode.
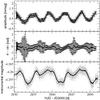 |
Fig. 9 Time-resolved analysis of HD 9289’s main pulsation multiplet. The variation of the mean stellar brightness is shown in the bottom panel for comparison. |
The second mode can also be explained through its spacing as a multiplet with undetected components. Assuming the simplest solution, a quintuplet, the two “missing” components are the central component νc and νc + νrot. Another possibility is a septuplet centred on ν4 (or alternatively ν4 + 2νrot, which we could not detect) with four components missing. In any case, while still consistent with the OPM, explaining this multiplet requires a strong departure from the usual “distorted dipole” picture. Using νrot,puls derived above as an estimated value for νrot, and calculating the position of the central (missing) frequency from a weighted mean based on the measured values of the detected multiplet components, the actual pulsation mode would have a frequency νc = 1574.55(2) μHz2.
We repeated the time-resolved analysis by fitting a cosine at fixed frequency νc, after subtracting all frequencies related to the main pulsation multiplet. The results are presented in Fig. 10. Due to the large uncertainties, the behaviour of the amplitude is not well defined, but it appears to be somewhat larger around the minimum in mean light. The phase changes continuously and linearly with time and jumps by 2π after about 1 rotation period. From the point of view of frequency analysis, this is due to the presence of ν4 and the actual absence of νc. The time-resolved analysis essentially tries to compensate for picking the “wrong” frequency by shifting the phase continuously. However, if the physical mode frequency is νc, the continuous change in phase is real. Alternatively, we could choose ν4 as the physical mode frequency, thus requiring a septuplet with missing components. In this scenario, the phase does not show any jumps and remains rather constant while the amplitude modulation looks the same. We summarise that the SNR is too low for a conclusive time-resolved analysis of the second multiplet.
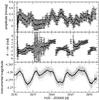 |
Fig. 10 Time-resolved analysis of HD 9289’s secondary pulsation multiplet, assuming that the real mode has νc = 1574.55 μHz. The variation of the mean stellar brightness is shown in the bottom panel for comparison. |
If both modes are considered quintuplets, a principle interpretation is that both modes are dominated by (ℓ = 2, m = 0). However, in this case they should show similar relative amplitudes (or amplitude ratios) for the various components. This is clearly not the case. Different pulsation axes might explain this observation, but we refrain from speculation at this point. Several roAp stars recently observed with the Kepler satellite show comparable multiplet structures, and strong rotational modulation due to surface features (Balona et al. 2011, in press), or even give direct evidence for different pulsation axes (Kurtz et al. 2011, in press). Hopefully, these more detailed observations will help us to also improve our understanding of HD 9289.
4.2. The pulsation of HD 99563 – a new candidate frequency
Figure 11 shows a time-resolved analysis of the main pulsation mode of HD 99563 after transforming the pulsation phase and defining the rotation phase so that a comparison with Fig. 6 from Handler et al. (2006) is feasible. As can be seen, the result is virtually indistinguishable. The difference in the two amplitude maxima is marginal, and the behaviour of the pulsation phase is exactly the same. This result does not depend on which of the two solutions for the exact frequency derived in Sect. 3.2 we chose. Also, the harmonics and linear combinations above 3000 μHz are the same within the error bars for both solutions.
However, there are differences in the amplitudes of the most significant multiplet components between the forced and the unconditional solution. This is due to the change in phase that comes with a change in frequency. As the relative phases of the components must change with a change in frequency, their relative amplitudes must also change in order to reproduce the light curve behaviour. Since the change in residuals between the forced and unconditional solution are negligible, there is no strong preference for either solution. However, if the values and uncertainties given in Handler et al. (2006) are correct, and assuming that HD 99563 has not changed and that the OPM is applicable, the forced solution is to be preferred. Concerning the multiplet, the remaining difference between our results and those by Handler et al. (2006), in particular the relative amplitudes, are expected due to the different bandpasses used the in photometric observations. Just as the amplitude of the rotational modulation varies from filter to filter, so does the amplitude modulation of the distorted dipole. The deviations from Freyhammer et al. (2009) are also not surprising, since the radial velocities generally show different relative amplitudes from photometry. One should be careful when using the amplitude ratios and phases to infer the general geometry of the oblique pulsator through, e.g., the technique of Kurtz (1992). In particular, one needs to take into account how uncertainties and instrumental properties affect the results.
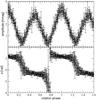 |
Fig. 11 Time-resolved analysis of HD 99563’s main pulsation mode, choosing the frequency value displayed in Table 4. Note that the phase θ (as in cos(ωt − θ)) has been transformed to φ (as in sin(ωt + φ)) for comparison to Handler et al. (2006). |
Concerning any additional frequencies independent from the main multiplet, a number of such candidate signals were formally significant in both frequency solutions. Most of the candidates in the unconditional solution cannot be exactly reproduced by the forced solution, but instead, other significant frequencies with similar but different values emerge. The only exceptions are ν12 (unconditional) and ν13 (forced), which match in frequency, amplitude, and phase. Thus, this seems to be a signal which is independent of the exact form of the main multiplet. We therefore conclude that there is an additional candidate frequency at νcand = 1555.84(4) μHz. It is plausible that this frequency could not be detected by Handler et al., since its amplitude is comparable to that of νp − 2 and νp + 2 which they were also unable to detect. We have no explanation for the remaining signals, formally significant but different in each solution, but we can speculate that they are artefacts caused by either an intrinsic or instrumental long-term modulation of the main pulsation frequency. This would explain why their exact values are affected by the choice of the frequency solution, while νcand is unaffected. The fact that no modulation was observed by Handler et al. increases the probability of an instrumental origin. Finally, in the forced solution, the outermost components of the nonuplet are not significant with a SNR of 1.1 and below. We can therefore not substantiate the claim of a nonuplet by Freyhammer et al. (2009).
4.3. The pulsation of HD 134214 – a twin of HD 24712?
As presented in Fig. 8, our results of a very conservative analysis for HD 134214 show that we can confirm most frequencies reported by Kurtz et al. (2007). There is a more or less regular frequency spacing that can be found throughout the region between 2600 and 3000 μHz. Only two of the frequencies we found do not fit this regular pattern: ν3 and ν10. To extract the most probable frequency spacing, we created a synthetic amplitude spectrum in which each frequency was represented by a Gaussian. The width of the Gaussians was determined using the estimated frequency uncertainties. The auto-correlation of this spectrum shows several peaks, but the most prominent peaks are a double peak at 33.80 ± 0.05 μHz, and a single broad peak at 67.63 ± 0.03 μHz. Interpreting the latter as the large frequency separation, we created the Echelle diagram shown in Fig. 12. It immediately reveals the striking regularity in the spacing of the frequencies. Most of the frequencies line up at ν mod 67.63 μHz ≈ 10 μHz, but the primary frequency ν1 does not! Considering only the frequencies that are consistent with Kurtz et al. (2007), ν1 is the only mode that clearly seems to relate to a different spherical degree from the remaining frequencies. Moreover, two of the new candidate frequencies seem to continue the ridge of ν1 towards lower frequencies. This strongly suggests that HD 134214 pulsates in at least two different dominant spherical degrees. Kurtz et al. (2007) could not yet decide between stable and unstable frequencies, and why most of them could not be observed in ground-based photometry. However, from the point of view of the long-timebase MOST observations, the frequencies seem to be stable, and HD 134214 reveals an impressive p-mode spectrum.
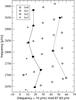 |
Fig. 12 Echelle diagram for the frequencies extracted from the MOST data of HD 134214. Frequencies consistent with prior observations of Kurtz et al. (2007) are shown as filled black circles. New candidate frequencies are shown as shaded grey circles. Other symbols correspond to a reference model (see text) with l defined as in Saio et al. (2010). The frequency uncertainties are smaller than the symbols used. Lines are visual aids to help separate the two possible mode ridges. |
To put this result into context, the value found for the large frequency separation is very similar to that of the well-studied roAp star HD 24712 (see, e.g., Saio et al. 2010). Moreover, the frequency region of pulsation is also approximately the same. Taking the estimate of the stars’ fundamental parameters from Ryabchikova et al. (2007), both are furthermore comparable in terms of magnetic field and effective temperature. However, HD 24712 does not exhibit such large differences in amplitudes between its individual modes, shows rotational signature in its pulsation spectrum, and is found to have a higher vsini.
Putting these bits of information together allows for an interesting interpretation of the pulsation in HD 134214. At higher magnetic field strengths the pulsation amplitude distribution for different modes can become quite complex (e.g., see Fig. 12 in Gruberbauer et al. 2008). This can affect our ability to detect such modes. Therefore, different dominant spherical degree components (as can be inferred from Fig. 12) and a very small inclination angle and/or obliquity (as can be inferred from the absence of rotational features and the comparison with HD 24712) could conspire to produce the large contrast in the mode amplitudes. If the mode geometry of ν1 is strongly dipolar and concentrates most of its pulsation power very close to the rotation axis, a low inclination would result in a large observed pulsation amplitude. On the other hand, if the pulsation of the modes on the left ridge in Fig. 12 is restricted to the mid-latitudes or the stellar equator, low inclinations will make those more difficult to detect. The pulsation amplitude maxima would be observed near the stellar limbs, and, due to their non-dipolar nature, they would also be subject to cancellation. This would also explain why Kurtz et al. find the pulsation amplitudes to increase towards lines which are higher up in the atmosphere, since those are more dominant towards the stellar limbs.
As a reference, Fig. 12 also shows a magnetic model produced by H. Saio (priv. comm.) using the method outlined in Saio et al. (2010). The model parameters are M = 1.65 M⊙, log R = 0.2694, log Teff = 3.8584, log L = 0.9250, X = 0.70, Z = 0.02 and Bp = 4.1 kG. Although the model does not exactly correspond to our “two ridge” hypothesis, it supports the similarity to HD 24712. It also identifies the main mode as being dominated by l = 1, while most other modes are dominated by higher-degree spherical harmonics. In the case of small inclination and small obliquity, this is in support of our explanation for the large amplitude difference between ν1 and the other modes.
However, there are two problems with the picture presented above. Firstly, it cannot explain the strong amplitude contrast between ν1 and the other two frequencies on the right ridge, ν7 and ν9. The mode spectrum of HD 24712 reveals that, over two radial orders, the amplitudes of modes of the same dominant degree can decrease by about a factor of 5. This is not enough to explain our amplitude ratios of ~ 35. Therefore, even invoking our hypothesis, there is still need for rather large differences in the intrinsic amplitudes and/or different dominant components. Secondly, current models suggest that for a star like HD 24712, the amplitude of the radiative flux variation due to pulsation has its maximum at the magnetic poles, regardless of the dominant value of l (see Fig. 12 in Saio et al. 2010). Therefore, the observed amplitudes should not have a large dependency on l, assuming comparable intrinsic amplitudes. If both stars are indeed very similar, and under the assumption that the models are applicable, the scenario given above is therefore unlikely to be true.
Whether or not our interpretation of HD 134214 is correct, the situation offers exciting potential to further study the similarities and differences between HD 134214 and HD 24712. As a first step, asteroseismic modelling of HD 134214 will hopefully allow us to constrain the different mode geometries from a theoretical perspective. This will be presented in an upcoming paper (Saio et al., in preparation).
5. Conclusions
In this paper we have presented three data sets of roAp stars obtained with the MOST satellite. All three data sets have revealed previously unknown features, or helped to clarify ambiguities that could not be resolved from the ground.
-
HD 9289:
We were able to derive the star’s ro-tation period for the first time withProt = 8.50(4) d.
-
At the time of observation, HD 9289 pulsated in two modes, and showed strong amplitude variations resulting in frequency multiplets consistent with the OPM.
-
Both modes have different multiplet structure, hinting at different mode geometries.
-
HD 99563:
The MOST observations present a picture mostly consistentwith previous results. However, we identified a newcandidate frequency independent of the primary multiplet.
-
We were unable to confirm the presence of a nonuplet as claimed by Freyhammer et al. (2009).
-
HD 134214:
MOST reveals a rich spectrum of p modesconsistent with findings by Kurtzet al. (2007). Their stabilitywas established, and the frequencies are now known to muchhigher precision. This turns HD 134214into one of the most promisingroAp candidates for asteroseismology.
-
MOST also detected three new candidate frequencies, of which two fall nicely into a well-defined p-mode pattern.
-
HD 134214 was found to show pulsation frequencies and a large frequency spacing similar to the well-studied star HD 24712 (HR 1217).
The CCD focal plane temperature is kept constant to within 0.1 K, but the rest of the satellite temperature can vary by about 2 K during each MOST orbit. This effect can be more pronounced if MOST is switching between two different, widely separated fields during each orbit.
Using νrot,PDM instead, the central frequency of the second quintuplet would be νc = 1574.48(2) μHz.
Acknowledgments
The authors dedicate this work to the memory of our dear friend and colleague Dr. Piet Reegen, who will be greatly missed by us all. The authors would like to thank Hideyuki Saio (Tohoku University) for contributing his models and valuable discussion. M.G., D.B.G., A.F.J.M., J.M.M., and S.R. acknowledge funding from the Natural Sciences & Engineering Research Council (NSERC) Canada, and W.W. from the Austrian Science Funds (P 22691-N16).
References
- Balona, L. A., Cunha, M. S., Gruberbauer, M., et al. 2011, MNRAS, in press [Google Scholar]
- Bidelman, W. P., & MacConnell, D. J. 1973, AJ, 78, 687 [NASA ADS] [CrossRef] [Google Scholar]
- Bigot, L., & Dziembowski, W. A. 2002, A&A, 391, 235 [NASA ADS] [CrossRef] [EDP Sciences] [Google Scholar]
- Cameron, C., Matthews, J. M., Rowe, J. F., et al. 2006, Commun. Asteroseismol., 148, 57 [NASA ADS] [CrossRef] [Google Scholar]
- Cunha, M. S. 2005, JApA, 26, 213 [NASA ADS] [CrossRef] [Google Scholar]
- Dorokhova, T. N., & Dorokhov, N. I. 1998, Contributions of the Astronomical Observatory Skalnate Pleso, 27, 338 [NASA ADS] [Google Scholar]
- Freyhammer, L. M., Kurtz, D. W., Elkin, V. G., et al. 2009, MNRAS, 396, 325 [NASA ADS] [CrossRef] [Google Scholar]
- Gruberbauer, M., Saio, H., Huber, D., et al. 2008, A&A, 480, 223 [NASA ADS] [CrossRef] [EDP Sciences] [Google Scholar]
- Handler, G., Weiss, W. W., Shobbrook, R. R., et al. 2006, MNRAS, 366, 257 [NASA ADS] [CrossRef] [Google Scholar]
- Hareter, M., Reegen, P., Kuschnig, R., et al. 2008, Commun. Asteroseismol., 156, 48 [Google Scholar]
- Huber, D., & Reegen, P. 2008, Commun. Asteroseismol., 152, 77 [NASA ADS] [CrossRef] [Google Scholar]
- Huber, D., Saio, H., Gruberbauer, M., et al. 2008, A&A, 483, 239 [NASA ADS] [CrossRef] [EDP Sciences] [Google Scholar]
- Kallinger, T., Reegen, P., & Weiss, W. W. 2008, A&A, 481, 571 [NASA ADS] [CrossRef] [EDP Sciences] [Google Scholar]
- Kochukhov, O. 2007, Commun. Asteroseismol., 150, 39 [NASA ADS] [CrossRef] [Google Scholar]
- Kreidl, T. J., & Kurtz, D. W. 1986, MNRAS, 220, 313 [NASA ADS] [Google Scholar]
- Kreidl, T. J., Kurtz, D. W., Schneider, H., et al. 1994, MNRAS, 270, 115 [NASA ADS] [Google Scholar]
- Kurtz, D. W. 1982, MNRAS, 200, 807 [NASA ADS] [CrossRef] [Google Scholar]
- Kurtz, D. W. 1992, MNRAS, 259, 701 [NASA ADS] [CrossRef] [Google Scholar]
- Kurtz, D. W., & Martinez, P. 2000, Baltic Astron., 9, 253 [Google Scholar]
- Kurtz, D. W., Martinez, P., & Tripe, P. 1994, MNRAS, 271, 421 [NASA ADS] [Google Scholar]
- Kurtz, D. W., Elkin, V. G., & Mathys, G. 2006, MNRAS, 370, 1274 [NASA ADS] [CrossRef] [Google Scholar]
- Kurtz, D. W., Elkin, V. G., Mathys, G., & van Wyk, F. 2007, MNRAS, 381, 1301 [NASA ADS] [CrossRef] [Google Scholar]
- Kurtz, D. W., Cunha, M. S., Saio, H., et al. 2011, MNRAS, in press [Google Scholar]
- Lenz, P., & Breger, M. 2005, Commun. Asteroseismol., 146, 53 [NASA ADS] [CrossRef] [Google Scholar]
- Ochsenbein, F., Bischoff, M., & Egret, D. 1981, A&AS, 43, 259 [NASA ADS] [Google Scholar]
- Reegen, P. 2007, A&A, 467, 1353 [NASA ADS] [CrossRef] [EDP Sciences] [Google Scholar]
- Reegen, P., Kallinger, T., Frast, D., et al. 2006, MNRAS, 367, 1417 [NASA ADS] [CrossRef] [Google Scholar]
- Rowe, J. F., Matthews, J. M., Kuschnig, R., et al. 2006, Mem. Soc. Astron. Italiana, 77, 282 [Google Scholar]
- Ryabchikova, T., Sachkov, M., Kochukhov, O., & Lyashko, D. 2007, A&A, 473, 907 [NASA ADS] [CrossRef] [EDP Sciences] [Google Scholar]
- Saio, H., Ryabchikova, T., & Sachkov, M. 2010, MNRAS, 403, 1729 [NASA ADS] [CrossRef] [Google Scholar]
- Shibahashi, H. 2003, in ASP Conf. Ser. 305, ed. L. A. Balona, H. F. Henrichs, & R. Medupe, 55 [Google Scholar]
- Stellingwerf, R. F. 1978, ApJ, 224, 953 [NASA ADS] [CrossRef] [Google Scholar]
- Walker, G., Matthews, J., Kuschnig, R., et al. 2003, PASP, 115, 1023 [NASA ADS] [CrossRef] [Google Scholar]
All Tables
Multi-frequency fit results for HD 99563, forcing the frequency solution to match νrot given in Handler et al. (2006).
All Figures
|
Fig. 1 Reduced MOST light curves of a) HD 9289, b) HD 99563 and c) HD 134214. The inserts show a small portion of a version of the light curve where any variability not due to roAp pulsation has been subtracted. For the insert in panel a), a 5-point running average is displayed instead of the unbinned data, in order to enhance the clarity of the weaker pulsation signature. Note that JD2000 = 2 451 545.0. |
| In the text | |
|
Fig. 2 Light curve of HD 99563 after processing with the reduction pipeline (top) and after subtraction the instrumental long-term trends (bottom). The dashed vertical lines separate the individually fitted subsets of the time series. |
| In the text | |
|
Fig. 3 Same as Fig. 2 but for HD 134214. On top of the long-subset polynomial fits the top panel also shows a 200 pt running average used as a high-pass filter. |
| In the text | |
|
Fig. 4 DFT of the HD 9289 data without any pre-whitening (grey) and after pre-whitening of all category 1 and 2 signals as defined in Sect. 3 (black). The insert shows the window function of the data set. Vertical dotted lines show the MOST orbital frequency and its integer mulitples. |
| In the text | |
|
Fig. 5 Same as Fig. 4 but for HD 99563. Notice the presence of a small signal “hump” due to the harmonic to the main pulsation frequency, and combination frequencies, at about 3110 μHz. Another small hump at about 2380 μHz is caused by aliasing. |
| In the text | |
|
Fig. 6 Same as Fig. 4 but for HD 134214. Notice that the harmonic to the main frequency can be seen as a small peak at 5900 μHz. |
| In the text | |
|
Fig. 7 Schematic pulsation spectrum of HD 99563 (top) and HD 9289 (bottom). Labels indicate multiplet frequencies and corresponding combinations. The thin lines show the residual amplitude spectra after pre-whitening of the identified frequencies. The top panel shows both the unconditional (black circles) and forced (grey squares) solutions for HD 99563. Note the different scales for both panels. |
| In the text | |
|
Fig. 8 Schematic pulsation spectrum of HD 134214. Squares indicate the frequencies reported in Kurtz et al. (2007). The error bars show our estimated upper limits for their uncertainties derived from their data set length. The arrow in the upper right corner indicates that the main pulsation frequency has a much higher amplitude (≈2 mmag) which would explode the scaling of the figure. The residual amplitude spectrum after pre-whitening of the identified frequencies, and a 50-point running average, is also shown. |
| In the text | |
|
Fig. 9 Time-resolved analysis of HD 9289’s main pulsation multiplet. The variation of the mean stellar brightness is shown in the bottom panel for comparison. |
| In the text | |
|
Fig. 10 Time-resolved analysis of HD 9289’s secondary pulsation multiplet, assuming that the real mode has νc = 1574.55 μHz. The variation of the mean stellar brightness is shown in the bottom panel for comparison. |
| In the text | |
|
Fig. 11 Time-resolved analysis of HD 99563’s main pulsation mode, choosing the frequency value displayed in Table 4. Note that the phase θ (as in cos(ωt − θ)) has been transformed to φ (as in sin(ωt + φ)) for comparison to Handler et al. (2006). |
| In the text | |
|
Fig. 12 Echelle diagram for the frequencies extracted from the MOST data of HD 134214. Frequencies consistent with prior observations of Kurtz et al. (2007) are shown as filled black circles. New candidate frequencies are shown as shaded grey circles. Other symbols correspond to a reference model (see text) with l defined as in Saio et al. (2010). The frequency uncertainties are smaller than the symbols used. Lines are visual aids to help separate the two possible mode ridges. |
| In the text | |
Current usage metrics show cumulative count of Article Views (full-text article views including HTML views, PDF and ePub downloads, according to the available data) and Abstracts Views on Vision4Press platform.
Data correspond to usage on the plateform after 2015. The current usage metrics is available 48-96 hours after online publication and is updated daily on week days.
Initial download of the metrics may take a while.