Fig. 12
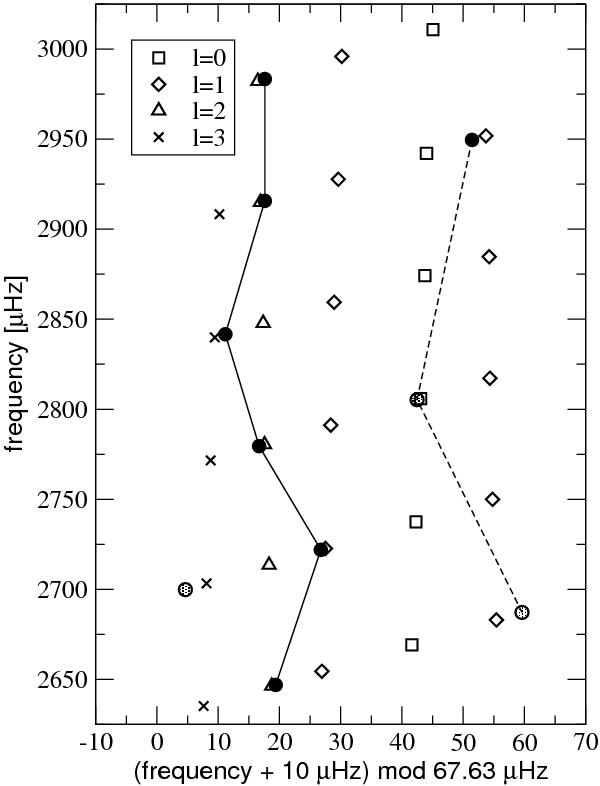
Echelle diagram for the frequencies extracted from the MOST data of HD 134214. Frequencies consistent with prior observations of Kurtz et al. (2007) are shown as filled black circles. New candidate frequencies are shown as shaded grey circles. Other symbols correspond to a reference model (see text) with l defined as in Saio et al. (2010). The frequency uncertainties are smaller than the symbols used. Lines are visual aids to help separate the two possible mode ridges.
Current usage metrics show cumulative count of Article Views (full-text article views including HTML views, PDF and ePub downloads, according to the available data) and Abstracts Views on Vision4Press platform.
Data correspond to usage on the plateform after 2015. The current usage metrics is available 48-96 hours after online publication and is updated daily on week days.
Initial download of the metrics may take a while.