Fig. 8
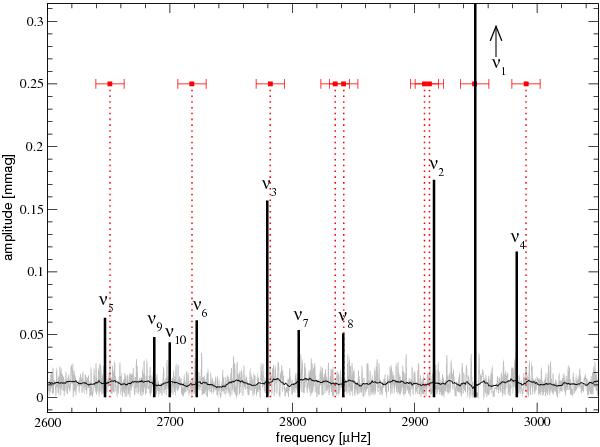
Schematic pulsation spectrum of HD 134214. Squares indicate the frequencies reported in Kurtz et al. (2007). The error bars show our estimated upper limits for their uncertainties derived from their data set length. The arrow in the upper right corner indicates that the main pulsation frequency has a much higher amplitude (≈2 mmag) which would explode the scaling of the figure. The residual amplitude spectrum after pre-whitening of the identified frequencies, and a 50-point running average, is also shown.
Current usage metrics show cumulative count of Article Views (full-text article views including HTML views, PDF and ePub downloads, according to the available data) and Abstracts Views on Vision4Press platform.
Data correspond to usage on the plateform after 2015. The current usage metrics is available 48-96 hours after online publication and is updated daily on week days.
Initial download of the metrics may take a while.