Fig. 1
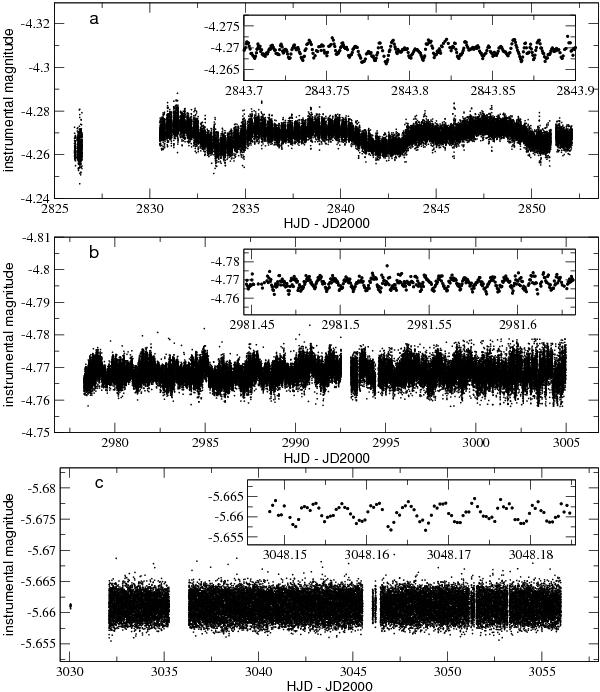
Reduced MOST light curves of a) HD 9289, b) HD 99563 and c) HD 134214. The inserts show a small portion of a version of the light curve where any variability not due to roAp pulsation has been subtracted. For the insert in panel a), a 5-point running average is displayed instead of the unbinned data, in order to enhance the clarity of the weaker pulsation signature. Note that JD2000 = 2 451 545.0.
Current usage metrics show cumulative count of Article Views (full-text article views including HTML views, PDF and ePub downloads, according to the available data) and Abstracts Views on Vision4Press platform.
Data correspond to usage on the plateform after 2015. The current usage metrics is available 48-96 hours after online publication and is updated daily on week days.
Initial download of the metrics may take a while.