Free Access
Fig. 2
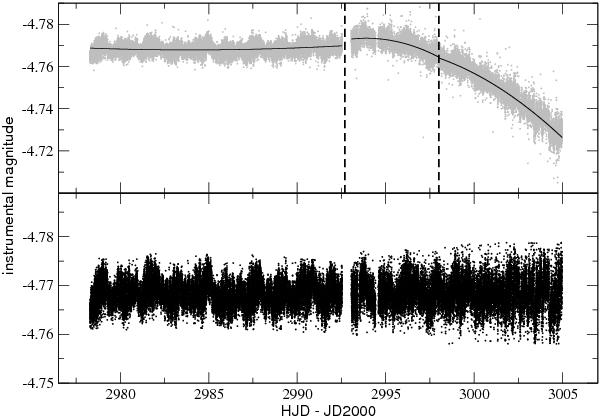
Light curve of HD 99563 after processing with the reduction pipeline (top) and after subtraction the instrumental long-term trends (bottom). The dashed vertical lines separate the individually fitted subsets of the time series.
Current usage metrics show cumulative count of Article Views (full-text article views including HTML views, PDF and ePub downloads, according to the available data) and Abstracts Views on Vision4Press platform.
Data correspond to usage on the plateform after 2015. The current usage metrics is available 48-96 hours after online publication and is updated daily on week days.
Initial download of the metrics may take a while.