| Issue |
A&A
Volume 526, February 2011
|
|
|---|---|---|
| Article Number | A129 | |
| Number of page(s) | 15 | |
| Section | Interstellar and circumstellar matter | |
| DOI | https://doi.org/10.1051/0004-6361/201015505 | |
| Published online | 11 January 2011 | |
Effects of non-uniform interstellar magnetic field on synchrotron X-ray and inverse-Compton γ-ray morphology of supernova remnants
1
INAF – Osservatorio Astronomico di Palermo “G.S. Vaiana”,
Piazza del Parlamento 1,
90134
Palermo, Italy
e-mail: This email address is being protected from spambots. You need JavaScript enabled to view it.
2
Institute for Applied Problems in Mechanics and
Mathematics, Naukova St.
3-b
Lviv
79060,
Ukraine
3
Astronomical Observatory, National University,
Kyryla and Methodia St. 8
Lviv
79008,
Ukraine
4
Dip. di Scienze Fisiche & Astronomiche, Univ. di Palermo,
Piazza del Parlamento 1, 90134
Palermo,
Italy
Received:
30
July
2010
Accepted:
9
November
2010
Abstract
Context. Observations of SuperNova Remnants (SNRs) in X-ray and γ-ray bands promise to contribute important information to our understanding of the kinematics of charged particles and magnetic fields in the vicinity of strong non-relativistic shocks and, therefore, the nature of Galactic cosmic rays. The accurate analysis of SNR images collected in different energy bands requires theoretical modeling of synchrotron and inverse Compton emission from SNRs.
Aims. We develop a numerical code (remlight) to synthesize, from MHD simulations, the synchrotron radio, X-ray, and inverse Compton γ-ray emission originating in SNRs expanding in a non-uniform interstellar medium (ISM) and/or non-uniform interstellar magnetic field (ISMF). As a first application, the code is used to investigate the effects of non-uniform ISMF on the SNR morphology in the non-thermal X-ray and γ-ray bands.
Methods. We perform 3D MHD simulations of a spherical SNR shock expanding through a magnetized ISM with a gradient of ambient magnetic field strength. The model includes an approximate treatment of upstream magnetic field amplification and the effect of shock modification due to the back reaction of accelerated cosmic rays, assuming both effects to be isotropic. From the simulations, we synthesize the synchrotron radio, X-ray, and inverse Compton γ-ray emission with the synthesis code remlight, making different assumptions about the details of acceleration and the injection of relativistic electrons.
Results. A gradient in the ambient magnetic field strength induces asymmetric morphologies in radio, hard X-ray, and γ-ray bands independently of the model of electron injection if the gradient has a component perpendicular to the line-of-sight (LoS). The degree of asymmetry of the remnant morphology depends on the details of the electron injection and acceleration and is different in the radio, hard X-ray, and γ-ray bands. In general, the non-thermal X-ray morphology is the most sensitive to the gradient, showing the highest degree of asymmetry. The IC γ-ray emission is weakly sensitive to the non-uniform ISMF, the degree of asymmetry of the remnant morphology being the lowest in this band.
Key words: magnetohydrodynamics (MHD) / radiation mechanisms: non-thermal / shock waves / ISM: supernova remnants / gamma rays: ISM / X-rays: ISM
© ESO, 2011
1. Introduction
It is largely accepted in the literature that the hard X-ray emission detected in many young shell-type SuperNova Remnants (SNRs) is synchrotron emission from electrons accelerated to energies of tens of TeV (e.g. Koyama et al. 1995) by means of the diffusive shock acceleration process. In addition, inverse Compton (IC) collisions of these high energy electrons with low energy photons from the ambient radiation field (e.g. the cosmic microwave background; hereafter CMB) are expected, thus leading to very-high-energy (VHE; >100 GeV) γ-ray emission too. In regions of high mass density, ions in the shell are likely to have been accelerated to similar energies, and γ-rays may be due to neutral pion decay from proton-proton interactions. The nature of the TeV emission, therefore, is related to a combination of X-ray synchrotron emitting electrons and very energetic ions; it is unclear, at the present time, which of the two contributes the most to the detected VHE γ-rays. The spectral analysis of multiwavelength data of several shell-type SNRs (Cas A, Aharonian et al. 2001; Albert et al. 2007; RX J1713.7-3946, Muraishi et al. 2000; Enomoto et al. 2002; Aharonian et al. 2007a; Berezhko & Völk 2008; RX J0852.0-4622, Katagiri et al. 2005; Aharonian et al. 2005, 2007b; Enomoto et al. 2006; and RCW 86, Hoppe & Lemoine-Goumard 2008) permits both a leptonic and hadronic origin of VHE γ-rays.
The study of SNRs as particle accelerators has received a strong impulse thanks to the new γ-ray observations of SNRs with the instruments of the High Energy Spectroscopic System (HESS), the Major Atmospheric Gamma-ray Imaging Cherenkov (MAGIC) experiments, and the Fermi Gamma-ray Space Telescope. The analysis of multiwavelength observations, from radio, to hard X-rays, to γ-rays, promises to improve our understanding of the kinematics of charged particles and magnetic fields in the vicinity of strong non-relativistic shocks and the possible role of SNRs in producing Galactic cosmic rays (CRs). In this context, a very important source of information could be the distribution of surface brightness observed in SNRs in several bands. For instance, the properties of the brightness distribution have been crucial to improving our understanding of the acceleration and injection of relativistic electrons by SNR shocks (e.g. the criterion of Rothenflug et al. 2004, versus the azimuthal profile comparison in Petruk et al. 2009c). Petruk et al. (2010a) compared synthetic distributions of surface brightness predicted for SN 1006 in different bands with observations, deriving important observational constraints on the modeling of SN 1006. The correlations of brightness in radio, X-rays, and γ-rays claimed in RX J1713.7-3946 (Acero et al. 2009) and some other SNRs (e.g. Aharonian et al. 2006) may also indicate that electrons are responsible for producing VHE γ-rays in these SNRs.
The analysis of the brightness distributions observed in different energy bands needs to be supported by an accurate comparison of the observed distributions with those predicted by detailed MHD models. For instance, a number of SNRs have a bilateral structure (BSNRs; Kesteven & Caswell 1987; Fulbright & Reynolds 1990; Gaensler 1998) and it is not clear how to “translate” this 2D information into a 3D morphology of the emission over the SNR shell. The two competing cases traditionally invoked are equatorial-belt and polar-caps, which are related to the model of the injection of relativistic electrons (isotropic or quasi-perpendicular in the former case and quasi-parallel in the latter case). Establishing the 3D morphology of SNRs, therefore, may provide some important insights into the acceleration theory.
The surface brightness distribution of synchrotron emission in SNRs expanding through a uniform interstellar medium (ISM) and uniform interstellar magnetic field (ISMF) has been extensively investigated, by means of numerical modeling, in both the radio (Fulbright & Reynolds 1990) and X-ray (Reynolds 1998, 2004) bands; in particular, the dependence of the brightness distributions on the efficiency of the acceleration process has been explored by considering different injection models. First IC γ-ray maps of SNRs in a uniform ISM and ISMF were presented by Petruk et al. (2009a) who investigated the properties of brightness distributions in VHE γ-rays and compared them to the distributions in the radio band (see also Petruk et al. 2010b). Petruk et al. (2009b) proposed a method to predict IC γ-ray images of SNRs starting from observed synchrotron radio maps and spatially resolved X-ray spectral analysis (e.g. Miceli et al. 2009) of SNRs.
In Orlando et al. (2007, hereafter Paper I), we investigated the origin of asymmetries in the radio morphology of BSNRs by applying a model of a SNR expanding through either a non-uniform ISM or a non-uniform ISMF. In this paper, we extend our analysis to the non-thermal X-ray and IC γ-ray emission. In particular, we develop a numerical code (remlight) to synthesize the synchrotron radio, X-ray, and IC γ-ray emission from 3D MHD simulations; we then couple the synthesis code with the MHD model introduced in Paper I, extended to include a simple treatment of upstream magnetic field amplification and the effect of shock modification due to the back reaction of accelerated CRs. We finally investigate the effects of a non-uniform ISMF on the morphology of the remnant in the hard X-ray and γ-ray bands. Though remnants of type Ia supernovae are expected to expand in an almost uniform ISMF, here we show that even a very small gradient in the ISMF can significantly influence the non-thermal remnant morphology.
In Sect. 2, we describe the MHD model and the numerical setup; in Sect. 3, we describe the computation of synchrotron X-ray and IC γ-ray emission, including model of relativistic electron behavior; in Sect. 4, we discuss the results; and, finally, in Sect. 5 we draw our conclusions.
2. MHD modeling and numerical setup
We adopt the MHD model introduced in Paper I, which describes the propagation of a SNR shock through a magnetized ambient medium. The shock propagation is modeled by numerically solving the time-dependent ideal MHD equations of mass, momentum, and energy conservation in a 3D Cartesian coordinate system (x,y,z) (see Paper I for details). The model does not consistently include the effects on shock dynamics caused by the back reaction of accelerated CRs. However, we approach the effect of shock modification by considering different values of the adiabatic index γ, which is expected to drop from the value of an ideal monoatomic gas; in particular, we consider the cases of γ = 5/3 (for an ideal monoatomic gas), γ = 4/3 (for a gas dominated by relativistic particles), and γ = 1.1 (for a large energy drain from the shock region caused by the escape of high energy CRs). In addition, we account for upstream magnetic field amplification due to the back reaction of accelerated protons, by amplifying the (pre-shock) ambient magnetic field in the neighborhoods of the remnant. These effects, namely shock modification and magnetic field amplification, might depend on the obliquity angle (i.e. the angle between the external magnetic field and the normal to the shock); for instance, they could follow the same dependence of the injection efficiency (i.e. the fraction of accelerated electrons). However, at the present time, the dependence of these effects on the obliquity angle is poorly understood and, therefore, we consider the simplest case of isotropic shock modification and magnetic field amplification (i.e. assuming no additional obliquity-dependent magnetic-field amplification). On the other hand, this choice simplifies our analysis of non-thermal images, which are already influenced by the obliquity dependence of other processes (e.g. injection efficiency, magnetic field compression, maximum energy of electrons; see Sect. 3). The simulations are performed using the flash code (Fryxell et al. 2000), an adaptive mesh refinement multiphysics code for astrophysical plasmas.
As initial conditions, we adopt parameters appropriate to reproducing the SNR SN 1006 after 1000 yr of evolution: we assume an initial spherical remnant with radius r0snr = 0.5 pc, originating in a progenitor star with mass of 1.4 Msun, and propagating through an unperturbed magneto-static medium. The initial total energy E0 is set to a value leading to a remnant radius rsnr ≈ 9 pc at t = 1000 yr (E0 ranges between ≈1.3 and 1.8 × 1051 erg, depending on γ) and is partitioned so that most of the SN energy is kinetic. The remnant expands through a homogeneous isothermal medium of particle number density n = 0.05 cm-3 and temperature T = 104 K. We consider three different configurations of the unperturbed ambient magnetic field: 1) a uniform ambient magnetic field (runs Unif-g1, Unif-g2, and Unif-g3); 2) an ambient magnetic field with a non-zero gradient of its strength perpendicular to the average magnetic field (runs Grad-BZ-g1, Grad-BZ-g2, and Grad-BZ-g3); and 3) an ambient magnetic field with a non-zero gradient of its strength aligned with the average magnetic field (runs Grad-BX-g1, Grad-BX-g2, Grad-BX-g3).
In the case of a uniform ISMF, we assume that the field is oriented parallel to the x axis. In the other two cases, the ambient magnetic field is assumed to be dipolar1. The dipole is oriented parallel to the x axis and located either on the z axis (x = y = 0) at z = −100 pc (Grad-BZ-g1, Grad-BZ-g2, Grad-BZ-g3) or on the x axis (y = z = 0) at x = −100 pc (Grad-BX-g1, Grad-BX-g2, Grad-BX-g3). In all cases, we assume the magnetic field strength to be B0 = 30 μG at the center of the SN explosion (x = y = z = 0), roughly an order of magnitude higher than the Galactic ISMF expected at the location of SN 1006. This high value has been chosen to mimic the effects of upstream magnetic field amplification (see discussion above). In this way, the post-shock ambient magnetic field is expected to be on the order of a few hundred μG according to the observations. In the configurations with non-uniform ISMF, the field strength varies by a factor ~6 over 60 pc: in the direction either perpendicular to the average ambient field ⟨ B ⟩ (Grad-BZ-g1, Grad-BZ-g2, Grad-BZ-g3) or parallel to ⟨ B ⟩ (Grad-BX-g1, Grad-BX-g2, Grad-BX-g3). We follow the expansion of the remnant for 1000 yr. Table 1 summarizes the physical parameters characterizing the simulations considered here.
Relevant initial parameters of the simulations.
The SN explosion is at the center (x,y,z) = (0,0,0) of the computational domain, which extends between −10 and 10 pc in all directions. At the coarsest resolution, the adaptive mesh algorithm used in the flash code (paramesh; MacNeice et al. 2000) uniformly covers the 3D computational domain with a mesh of 83 blocks, each with 83 cells. We allow for five additional nested levels of refinement during the first 100 yr of evolution with resolution increasing twice at each refinement level; the number of nested levels then progressively decreases down to two at t = 1000 yr as the remnant radius increases following the expansion of the remnant through the magnetized medium. The refinement criterion adopted (Löhner 1987) follows the changes in density and temperature. This grid configuration yields an effective resolution of ≈0.0098 pc at the finest level during the first 100 yr of evolution (when the radius of the remnant was <2 pc) and ≈0.078 pc at the end of the simulation, corresponding to an equivalent uniform mesh of 20483 and 2563 grid points, respectively. We assume zero-gradient conditions at all boundaries.
The model does not include the radiative cooling, describing only the free and adiabatic
expansion phases of the remnant. The transition time from adiabatic to radiative phase for a
SNR is (e.g. Blondin et al. 1998; Petruk 2005) 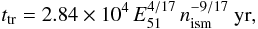 (1)where
E51 = E0/(1051 erg)
and nism is the particle number density of the ISM. In our set
of simulations, ttr > 105 yr,
which is much longer than the time covered by our simulations. Our modeled SNRs therefore
never reach the radiative phase. On the other hand, here we aim to describe young SNRs (i.e.
those that are still in the adiabatic expansion phase) from which non-thermal X-ray and
γ-ray emission is commonly detected.
(1)where
E51 = E0/(1051 erg)
and nism is the particle number density of the ISM. In our set
of simulations, ttr > 105 yr,
which is much longer than the time covered by our simulations. Our modeled SNRs therefore
never reach the radiative phase. On the other hand, here we aim to describe young SNRs (i.e.
those that are still in the adiabatic expansion phase) from which non-thermal X-ray and
γ-ray emission is commonly detected.
3. Synchrotron X-ray and inverse-Compton γ-ray emission (REMLIGHT)
From the model results, we synthesize synchrotron radio, X-ray, and IC γ-ray emission, by generalizing the approach of Reynolds (1998) to cases of non-uniform ISM and/or non-uniform ISMF. In Paper I, we already discussed the synthesis of synchrotron radio emission and we refer the reader to that paper for the details of calculation. Here we discuss the synthesis of X-ray and IC γ-ray emission as implemented in the synthesis code remlight.
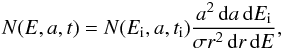
One could assume that the synchrotron X-ray or IC γ-ray radiation is
produced by relativistic electrons distributed with an energy spectrum
N(E) = KE−sexp(−E/Emax) electrons cm-3 erg s-1
(e.g. Gaisser et al. 1998), where E
is the electron energy, N(E) is the number of electrons
per unit volume with arbitrary directions of motion and with energies in the interval
[E,E + dE] , K is the normalization
of the electron distribution, s the power law index, and
Emax the maximum energy of electrons accelerated by the
shock2. Nevertheless, some observations suggest that
the cut-off could be broader than a pure exponent (e.g. Ellison et al. 2000, 2001; Uchiyama et al. 2003; Lazendic et al. 2004). Therefore, we assume that the energy spectrum of the
electrons is given by ![Mathematical equation: \begin{equation} N(E) = KE^{-s} \exp\left[ -{\left(\frac{E}{E\rs{max}}\right)^{\alpha}}\right], \label{el-distr} \end{equation}](/articles/aa/full_html/2011/02/aa15505-10/aa15505-10-eq51.png) (2)where
α ≤ 1 is the parameter regulating the broadening of the high-energy end of
electron spectrum3.
(2)where
α ≤ 1 is the parameter regulating the broadening of the high-energy end of
electron spectrum3.
The volume emissivity of the synchrotron or IC radiation can be expressed as 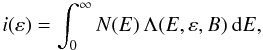 (3)where
Λ(E,ε,B) is the radiation power of a single electron with
energy E, and ε is the photon energy. The emissivity,
i(ε), depends on the magnetic field strength,
B, only in the synchrotron emission process. We compute the surface
brightness of the SNR at a given energy ε, by integrating the emissivity
i(ε) at each point along each LoS in a raster scan
(assuming that the source is optically thin).
(3)where
Λ(E,ε,B) is the radiation power of a single electron with
energy E, and ε is the photon energy. The emissivity,
i(ε), depends on the magnetic field strength,
B, only in the synchrotron emission process. We compute the surface
brightness of the SNR at a given energy ε, by integrating the emissivity
i(ε) at each point along each LoS in a raster scan
(assuming that the source is optically thin).
In the case of synchrotron emissivity in the X-ray band,
iX(ε), the spectral distribution of radiation
power of a single electron with energy E in the magnetic
field B is
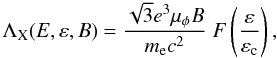 (4)where
εc = hνc = hc1μφBE2,
h is the Planck constant, νc is the critical
frequency, φ the angle between the magnetic field and the LoS,
μφ is either
μφ = sinφ for the case of
ordered magnetic field or
μφ = ⟨ sinφ ⟩ = π/4
for disordered magnetic field,
(4)where
εc = hνc = hc1μφBE2,
h is the Planck constant, νc is the critical
frequency, φ the angle between the magnetic field and the LoS,
μφ is either
μφ = sinφ for the case of
ordered magnetic field or
μφ = ⟨ sinφ ⟩ = π/4
for disordered magnetic field,  , e and
me are the charge and mass of electron, respectively, and
c is the speed of light. The special function
F(w) can be approximated as (e.g. Rybicki & Lightman 1985; Wallis
1959)
, e and
me are the charge and mass of electron, respectively, and
c is the speed of light. The special function
F(w) can be approximated as (e.g. Rybicki & Lightman 1985; Wallis
1959) 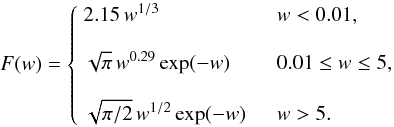 (5)We
found the above approximation to be quite accurate with discrepancies
(5)We
found the above approximation to be quite accurate with discrepancies
 4%
from the exact value. In addition,
4%
from the exact value. In addition,  , while
the exact value is
, while
the exact value is  .
.
For the γ-ray emissivity produced by the IC process,
iIC, the spectral distribution
ΛIC(E,ε) of the radiation power of a single electron in a
black-body photon field in Eq. (3) is (see
also Petruk et al. 2009a)
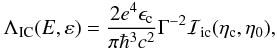 (6)where Γ is the Lorenz
factor of electron,
ϵc = kTCMBR,
TCMBR is the temperature of the cosmic microwave background
radiation (CMBR) assumed to be TCMBR = 2.75 K,
(6)where Γ is the Lorenz
factor of electron,
ϵc = kTCMBR,
TCMBR is the temperature of the cosmic microwave background
radiation (CMBR) assumed to be TCMBR = 2.75 K,
 (7)and the special
function
ℐic(ηc,η0)
can be accurately approximated as (Petruk 2009)
(7)and the special
function
ℐic(ηc,η0)
can be accurately approximated as (Petruk 2009)
![Mathematical equation: \begin{eqnarray} \lefteqn{\displaystyle {\cal{I}}\rs{ic}(\eta\rs{c},\eta\rs{0}) \approx \frac{\pi^2}{6}\eta\rs{c} \left\{\exp\left[ -\frac{5}{4}\left(\frac{\eta\rs{0}}{\eta\rs{c}}\right)^{1/2}\right]\right. } \nonumber \\ & & ~~~~~~~~~~~~~ \left. + 2\eta\rs{0} \exp \left[-\frac{5}{7}\left(\frac{\eta\rs{0}}{\eta\rs{c}}\right)^{0.7}\right] \right\} \exp\left[-\frac{2}{3}\left(\frac{\eta\rs{0}}{\eta\rs{c}}\right) \right]\cdot \end{eqnarray}](/articles/aa/full_html/2011/02/aa15505-10/aa15505-10-eq87.png) (8)This
approximation represents
ℐic(ηc,η0)
in any regime, from Thomson to extreme Klein-Nishina. The approximation is exact in the
Thomson limit. It restores detailed calculations with a maximum error of 30% in the range of
parameters, which gives a non-negligible contribution to emission.
(8)This
approximation represents
ℐic(ηc,η0)
in any regime, from Thomson to extreme Klein-Nishina. The approximation is exact in the
Thomson limit. It restores detailed calculations with a maximum error of 30% in the range of
parameters, which gives a non-negligible contribution to emission.
3.1. Maximum energy of electrons
We follow the approach of Reynolds (1998) for the
description of time evolution and surface variation of Emax,
generalizing his approach to cases of non-uniform ISM and/or non-uniform ISMF. Reynolds (1998) considered three alternatives for time
and spatial dependence of Emax. In particular, the maximum
accelerated energy maybe determined by: 1) the electron radiative losses (due to
synchrotron and IC processes); 2) the limited time of acceleration (due to the finite age
of the remnant); and 3) the properties of micro-physics when the scattering of electrons
with E > Emax becomes
less efficient and the electrons freely escape from the region of acceleration4. The maximum energy is given by 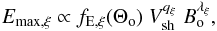 (9)where Θo
is the obliquity angle, fE,ξ(Θo)
is a function describing smooth variations in Emax versus
obliquity, Vsh is the shock velocity,
Bo is the pre-shock ISMF strength, and
ξ = 1,2,3 corresponds, respectively,
to loss-limited, time-limited, and escape-limited models of
Emax. The values of q and
λ are q1 = 1,
q2 = q3 = 0, and
λ1 = −1/2,
λ2 = λ3 = 1 (Reynolds 1998). We note that we assume
q2 = 0 because: 1) Emax rises
quite slowly with time when it is determined by the finite time of acceleration (Reynolds 1998), even in the nonuniform ISM; and 2) most
emission originates downstream in regions close to the shock; therefore, the variation in
Emax caused by the velocity variation is negligible in the
(thin) emitting region. From Eq. (9), we
express the surface variation in Emax as
(9)where Θo
is the obliquity angle, fE,ξ(Θo)
is a function describing smooth variations in Emax versus
obliquity, Vsh is the shock velocity,
Bo is the pre-shock ISMF strength, and
ξ = 1,2,3 corresponds, respectively,
to loss-limited, time-limited, and escape-limited models of
Emax. The values of q and
λ are q1 = 1,
q2 = q3 = 0, and
λ1 = −1/2,
λ2 = λ3 = 1 (Reynolds 1998). We note that we assume
q2 = 0 because: 1) Emax rises
quite slowly with time when it is determined by the finite time of acceleration (Reynolds 1998), even in the nonuniform ISM; and 2) most
emission originates downstream in regions close to the shock; therefore, the variation in
Emax caused by the velocity variation is negligible in the
(thin) emitting region. From Eq. (9), we
express the surface variation in Emax as 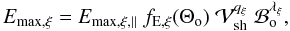 (10)where
Emax,ξ,∥ is a free parameter,
representing the maximum energy at a point p on the SNR surface where the
ISMF is parallel to the shock normal, and
(10)where
Emax,ξ,∥ is a free parameter,
representing the maximum energy at a point p on the SNR surface where the
ISMF is parallel to the shock normal, and  ,
and
ℬo = Bo/Bo,∥,
where Vsh,∥ and
Bo,∥ are the shock velocity and
pre-shock ISMF strength at the point p, respectively.
,
and
ℬo = Bo/Bo,∥,
where Vsh,∥ and
Bo,∥ are the shock velocity and
pre-shock ISMF strength at the point p, respectively.
A detailed theoretical framework providing the obliquity dependence of
Emax was presented by Reynolds (1998) and is based on the prescription for diffusion by Jokipii (1987). However, this theory is limited to the
test-particle regime, assuming no magnetic field amplification. On the other hand, at the
present time, a more general theory describing the obliquity dependence of
Emax is still lacking. For the sake of generality, we adopt
here some arbitrary smooth variations in Emax versus obliquity
with the goal of seeing how different trends in the obliquity dependence of
Emax influence the visible morphology of SNRs. The remnant
morphology – once we are not interested in a precise comparison with observations – is
indeed mainly affected by the contrast  and not by the exact form of the dependence on obliquity, once the latter is assumed to be
smooth.
and not by the exact form of the dependence on obliquity, once the latter is assumed to be
smooth.
Our strategy is to consider smooth variations in Emax versus
obliquity that correspond to the loss-limited, time-limited, and escape-limited models of
Emax in the theoretical framework of Reynolds (1998). Since, in general, the mechanism limiting electron
acceleration (i.e. loss-limited, time-limited, and escape-limited) may differ at different
shock obliquity angles, we calculate the value of Emax
appropriate for each limitation mechanism at each point, by considering
Emax = min [Emax,1,Emax,2,Emax,3]
(where the indices 1,2, and 3 correspond, respectively,
to loss-limited, time-limited, and escape-limited models). This way of computing
Emax is adopted in Sects. 4.2, 4.3, and 4.6, where we also assume that we are at the Bohm limit (i.e.
gyrofactor5 η = 1) in the
test-particle regime. In particular, in Sect. 4.2, we
introduce a reference case for which the adopted set of parameters (see Sect. 4.1) leads to  .
We note that the adopted parameters make this case suitable for comparison with young
non-thermal SNRs as, for instance, SN 1006. In addition, for the sake of generality, in
Sects. 4.4 and 4.5, we explore the effects on the remnant morphology of various obliquity
dependencies of Emax, by also considering cases for which the
contrast
.
We note that the adopted parameters make this case suitable for comparison with young
non-thermal SNRs as, for instance, SN 1006. In addition, for the sake of generality, in
Sects. 4.4 and 4.5, we explore the effects on the remnant morphology of various obliquity
dependencies of Emax, by also considering cases for which the
contrast  is <1.
3.2. Post-shock evolution of the electron distribution
As in Reynolds (1998), we assume that relativistic
electrons are confined to the fluid elements that advect them from the region of
acceleration. A fluid element with Lagrangian coordinates
a ≡ R(ti)
was shocked at time ti, where R is the radius
of the shock. At that time, the electron distribution on the shock was
![Mathematical equation: \begin{equation} N(E\rs{i}, t\rs{i}) = K\rs{s}(a,t\rs{i})E\rs{i}^{-s}\exp \left[-\left(\frac{E\rs{i}}{E\rs{max}(t\rs{i})}\right)^{\alpha}\right], \end{equation}](/articles/aa/full_html/2011/02/aa15505-10/aa15505-10-eq119.png) (11)where
Ei is the electron energy at time
ti, Ks is the normalization of
the electron distribution immediately after the shock (in the following, index “s” refers
to the immediately post-shock values), and s is the power law index. At
variance with Paper I, we are interested here in synchrotron X-ray and
IC γ-ray emission. In this case, the evolution of the electron
distribution has to account for energy losses of electrons due to both adiabatic expansion
and radiative losses caused by synchrotron and IC processes. At time
ti, the energy of the electron confined in the fluid element
with Lagrangian coordinates
a ≡ R(ti)
was (cf. Eq. (26) in Reynolds 1998)
(11)where
Ei is the electron energy at time
ti, Ks is the normalization of
the electron distribution immediately after the shock (in the following, index “s” refers
to the immediately post-shock values), and s is the power law index. At
variance with Paper I, we are interested here in synchrotron X-ray and
IC γ-ray emission. In this case, the evolution of the electron
distribution has to account for energy losses of electrons due to both adiabatic expansion
and radiative losses caused by synchrotron and IC processes. At time
ti, the energy of the electron confined in the fluid element
with Lagrangian coordinates
a ≡ R(ti)
was (cf. Eq. (26) in Reynolds 1998)
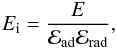 (12)where E
is the electron energy at the present time t, ℰad is a term
accounting for the energy losses of electrons due to adiabatic expansion
(12)where E
is the electron energy at the present time t, ℰad is a term
accounting for the energy losses of electrons due to adiabatic expansion
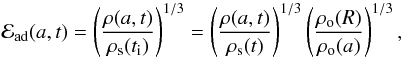 (13)ρ
is the mass density (in the following, index “o” refers to the pre-shock values),
ℰrad is a term accounting for the radiative losses of electrons
(13)ρ
is the mass density (in the following, index “o” refers to the pre-shock values),
ℰrad is a term accounting for the radiative losses of electrons 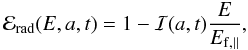 (14)
(14)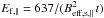 erg is the fiducial energy at
parallel shock (Reynolds 1998),
erg is the fiducial energy at
parallel shock (Reynolds 1998),
 is an
“effective” magnetic field at parallel shock accounting energy losses due to IC
scatterings on the photons of CMB,
BCMB = 3.27 μG is the magnetic field
strength with energy density equal to that in the CMB, t is the time, and
ℐ(a,t) is an integral independent of E, which is
calculated in Appendix A. The electron energy
losses in a given fluid element are mainly due to radiative losses if
Ef < Emax
and to adiabatic expansion if
Ef ≳ Emax.
is an
“effective” magnetic field at parallel shock accounting energy losses due to IC
scatterings on the photons of CMB,
BCMB = 3.27 μG is the magnetic field
strength with energy density equal to that in the CMB, t is the time, and
ℐ(a,t) is an integral independent of E, which is
calculated in Appendix A. The electron energy
losses in a given fluid element are mainly due to radiative losses if
Ef < Emax
and to adiabatic expansion if
Ef ≳ Emax.
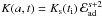
At time ti, the shock was able to accelerate an electron
confined in the fluid element with Lagrangian coordinate a to
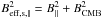
Emax(ti). From Eq. (9), we find that 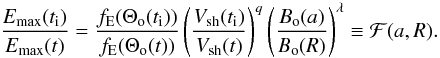 (15)The ratio,
Vsh(ti)/Vsh(t),
may be expressed in terms of pressure, P, and density, ρ
(Hnatyk & Petruk 1999)
(15)The ratio,
Vsh(ti)/Vsh(t),
may be expressed in terms of pressure, P, and density, ρ
(Hnatyk & Petruk 1999)
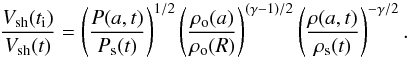 (16)The conservation law for
the number of particles per unit volume per unit energy interval
(16)The conservation law for
the number of particles per unit volume per unit energy interval
 (17)where
σ = (γ + 1)/(γ − 1)
is the shock compression ratio and r is the Eulerian coordinate, together
with the continuity equation
ρo(a)a2da = ρ(a,t)r2dr
and the derivative
(17)where
σ = (γ + 1)/(γ − 1)
is the shock compression ratio and r is the Eulerian coordinate, together
with the continuity equation
ρo(a)a2da = ρ(a,t)r2dr
and the derivative 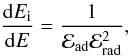 (18)implies that downstream
![Mathematical equation: \begin{eqnarray} \lefteqn{N(E,a,t) = K(a,t)E^{-s}{\cal{E}}\rs{rad}^{s-2}} \nonumber \\ \label{deriv_distrib} & & ~~~~~~~~~~~~~~~ \times \exp\left[-\left(\frac{E}{E\rs{max}(t,\Theta\rs{o})\,{\cal{F}}(a,R)\, \cal{E}\rs{ad}\cal{E}\rs{rad}} \right)^{\alpha}\right], \end{eqnarray}](/articles/aa/full_html/2011/02/aa15505-10/aa15505-10-eq147.png) (19)where
(19)where
 , and
Emax(t,Θo) is given by
Eq. (10) and taken into account
Eq. (15). Assuming that
Ks ∝ ρsVsh(t)−b,
i.e. it varies with the shock velocity Vsh(t)
and, in the case of a non-uniform ISM, with the immediately post-shock value of mass
density, ρs, the downstream variation in
K(a,t) is described by the relation (see Paper I)
, and
Emax(t,Θo) is given by
Eq. (10) and taken into account
Eq. (15). Assuming that
Ks ∝ ρsVsh(t)−b,
i.e. it varies with the shock velocity Vsh(t)
and, in the case of a non-uniform ISM, with the immediately post-shock value of mass
density, ρs, the downstream variation in
K(a,t) is described by the relation (see Paper I)
 (20)where
fς(Θo) is the obliquity
dependence of the injection efficiency ς (the fraction of accelerated
electrons). Again, because of the lack of theoretical dependence of the injection
efficiency on obliquity in the case of efficient acceleration, we consider a number of
smooth functions for fς(Θo),
exploring either increasing or decreasing injection. This approach, which considers
different contrasts of either
fς∥/fς ⊥ > 1
or <1 was realized in Petruk
et al. (2009a); there, we demonstrated how the change in the injection contrast
influences non-thermal images of SNRs in uniform ISM and uniform ISMF. In the present
paper, for simplicity and in order to see the effects from nonuniformity of ISMF, we limit
our considerations to three contrasts of injection. In particular, following Reynolds (1998), we consider the models quasi-parallel
(fς(Θo) = cos2Θs),
isotropic (fς(Θo) = 1), and
quasi-perpendicular
(fς(Θo) = sin2Θs),
where Θs is related to Θo by the expression
(20)where
fς(Θo) is the obliquity
dependence of the injection efficiency ς (the fraction of accelerated
electrons). Again, because of the lack of theoretical dependence of the injection
efficiency on obliquity in the case of efficient acceleration, we consider a number of
smooth functions for fς(Θo),
exploring either increasing or decreasing injection. This approach, which considers
different contrasts of either
fς∥/fς ⊥ > 1
or <1 was realized in Petruk
et al. (2009a); there, we demonstrated how the change in the injection contrast
influences non-thermal images of SNRs in uniform ISM and uniform ISMF. In the present
paper, for simplicity and in order to see the effects from nonuniformity of ISMF, we limit
our considerations to three contrasts of injection. In particular, following Reynolds (1998), we consider the models quasi-parallel
(fς(Θo) = cos2Θs),
isotropic (fς(Θo) = 1), and
quasi-perpendicular
(fς(Θo) = sin2Θs),
where Θs is related to Θo by the expression
 . The first injection
model leads to a three-dimensional polar-caps structure of the remnant, whereas the latter
two produce a three-dimensional equatorial-belt structure of the remnant.
. The first injection
model leads to a three-dimensional polar-caps structure of the remnant, whereas the latter
two produce a three-dimensional equatorial-belt structure of the remnant.
Radiative losses of electrons Ė ∝ E2 are mostly effective in modifying the distribution N(E,a,t) around E ~ Emax (Reynolds 1998). This can be seen in Eq. (19). The variation in the energy distribution N(E,a,t) of electrons with energy E ≪ Emax (in this case also E ≪ Ef, leading to ℰrad → 1), i.e. electrons with negligible radiative losses, is given by N(E,a,t)/Ns(E,R,t) = K(a,t)/Ks(R,t), where Ns(E,R,t) is the energy distribution of electrons immediately after the shock. This expression does not depend on energy E and we used this expression in Paper I to investigate the properties of the surface brightness distribution of SNRs emitting radio frequencies. In contrast, the modification of the distribution N(E,a,t) due to effective electron radiation is given by the two last multipliers in Eq. (19). The radiative losses of electrons are therefore important to the surface brightness distributions of SNRs in X-ray and γ-rays.
4. Synchrotron and IC images of SNRs expanding through a non-uniform ISMF
The evolution of the remnant expanding through the non-uniform ISMF has been described in Paper I where the reader is referred to for more details. Figure 1 shows the 3D rendering of the mass density at t = 1000 yr in the three cases of γ considered for uniform ISMF. The main effect of γ on the shock dynamics is to change its compression ratio and the distance of the contact discontinuity from the blast wave position (see also Fraschetti et al. 2010, for the effects of accelerated CRs on the development of the Rayleigh-Taylor structures); no dependence on the obliquity angle is present, γ being uniform in each simulation. The value of γ is expected therefore to influence the absolute values of emission in the radio, X-ray, and γ-ray bands but not the large-scale morphology of the remnant to which this paper is focused on. In the following, we first discuss the effects of non-uniform ISMF on the synchrotron and IC emission adopting, as reference, the case of γ = 5/3, allowing the direct comparison of our results with those available in the literature; in Sect. 4.3, we then discuss the effect of γ on the morphology of the non-thermal emission.
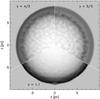 |
Fig. 1 3D rendering of the mass density at t = 1000 yr for a remnant expanding through a uniform ISMF for three cases of γ = 5/3, 4/3, and 1.1 (runs Unif-g1, Unif-g2, and Unif-g3, see Table 1). |
In all the synthetic images presented below, we introduce the procedure of magnetic field
disordering (with randomly oriented magnetic field vector in each point) downstream of the
shock (see Paper I), according to observations showing a low degree of polarization (10–15%;
e.g. Tycho, Dickel et al. 1991, SN 1006, Reynolds & Gilmore 1993). We note that the
obliquity angle Θs is derived from Θo by means of the conversion
formula given in Sect. 3.2 and, therefore, does not take into account the magnetic
field disordering; as discussed by Fulbright &
Reynolds (1990), this corresponds to the assumption that the disordering process
takes place over a longer timescale than the electron injection that occurs in the close
proximity of the shock.
In all the simulations, we assume that the (average) unperturbed ISMF ⟨ B ⟩ is oriented along the x axis. In the two magnetic field configurations explored in this paper, the gradient of ISMF strength is either normal (runs Grad-BZ-g1, Grad-BZ-g2, Grad-BZ-g3; ∇| ⟨ B ⟩ | along z) or aligned (runs Grad-BX-g1, Grad-BX-g2, Grad-BX-g3; ∇| ⟨ B ⟩ | along x) with ⟨ B ⟩ . Since we analyze the remnant morphology as it would be observed from different points of view, we define two angles to describe the orientation of ⟨ B ⟩ and ∇| ⟨ B ⟩ | in the space (see Fig. 2): φB is the angle between ⟨ B ⟩ and the LoS, and φ∇B is the angle between ∇| ⟨ B ⟩ | and the normal to the ISMF in the plane of the sky (axis Av in Fig. 2). The first angle is the aspect angle commonly used in the literature. The definition of the second angle allows us to explore the remnant morphology for various aspect angles and for fixed φ∇B, ∇| ⟨ B ⟩ | lying on a cone with angle φ∇B (see Fig. 2). In cases in which the gradient ∇B is aligned with the average ISMF (runs Grad-BX-g1, Grad-BX-g2, Grad-BX-g3) φ∇B = 90° by definition. In Grad-BZ models, the angle between ⟨ B ⟩ and ∇| ⟨ B ⟩ | is always 90°. In the following, the images are calculated for various values of the angles defined above and with a resolution of 256 × 256 pixels.
4.1. Parameter space
The prescriptions for the electron energy distribution at any point inside the remnant and for the synthesis of synchrotron and IC emission discussed in Sect. 3 are characterized by several parameters regulating the energy spectrum of relativistic electrons, the injection efficiency, the time and spatial dependence of Emax, etc. In the following, we limit the model parameter space by adopting some assumptions that allow us to fix some of the parameters.
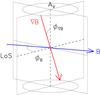 |
Fig. 2 Relevant angles describing the orientation of the ISMF and the gradient of ISMF strength with respect to the observer: φB is the angle between the (average) unperturbed ISMF and the LoS, and φ∇B is the angle between the gradient of the ISMF strength and the vertical line passing through the center of the remnant AV. |
In particular, we assume that the power law index in Eq. (2) is s = 2, as suggested by many observations of BSNRs (e.g. for SN 1006; Miceli et al. 2009). In the test-particle regime, the index should be related to the shock compression ratio through s = (2 + σ)/(σ − 1) with σ = (γ + 1)/(γ − 1). For efficient shock acceleration, the electron energy distribution is curved. The value of s that should be used in an approximation such as Eq. (2) is a mean radio-to-X-ray spectral index whose value is around 2 (e.g. Allen et al. 2008), independent of the local slopes of the electron spectrum. As for the curvature of the spectrum around Emax, we assume that α = 0.5 in Eq. (2). This may be true in SN 1006 and G347.3-0.5 where a number of models suggest that α ≈ 0.5 (Ellison et al. 2000, 2001; Uchiyama et al. 2003; Lazendic et al. 2004).
The maximum energy at parallel shock
Emax,∥ is a free parameter in Eq. (10) that we assume to be
Emax,∥ = 26 TeV in most of our
calculations. This parameter has to be compared with the fiducial energy at parallel shock
defined as erg (Reynolds 1998); for the cases considered here, we have
Ef,∥ = 14 TeV in models with uniform
ISMF, Ef,∥ = 12 TeV in Grad-BZ models and
Ef,∥ = 2 TeV in Grad-BX models6. In all these cases, therefore,
Ef < Emax
for a significant portion of the remnant and the electron energy losses are mainly due to
radiative losses (see discussion in Sect. 3.2). In
Sect. 4.6, we investigate the dependence of the
non-thermal emission on Emax,∥, by
exploring cases for which
Emax < Ef
and the electron energy losses are mainly due to adiabatic expansion.
The parameter b in Eq. (20) is a constant and determines how the injection efficiency depends on the shock properties; we assumed that Ks ∝ ρsVsh(t)−b (see Sect. 3.2 and Paper I). On theoretical grounds, b might be expected to be negative, reflecting an expectation that injection efficiency may behave in a way similar to acceleration efficiency: stronger shocks might inject particles more effectively. Reynolds (1998) considered three empirical alternatives for b as a free parameter, namely, b = 0,−1,−2. In particular, b = −2 is commonly assumed in many areas of astrophysics such as gamma-ray bursts and prompt radio and X-ray emission from SNe. However, Bandiera & Petruk (2010) showed that models where a constant fraction of the shock energy is transferred into CRs (i.e. b = −2) are rejected by statistical analysis of two SNR samples. In addition, Petruk et al. (2010a) compared their model results with experimental data of the remnant SN 1006 and found that b has a value between 0 and −1. Petruk et al. (2010b) showed that the smaller b, the thicker the radial profiles of the surface brightness in all bands, an effect that is most prominent in the radio band. Since no effect on the pattern of asymmetries induced by a non-uniform ISMF is expected (see Paper I), we assume that b = 0 in all our calculations, this being the most neutral case.
The synthetic images are expected to depend on the remnant age (Reynolds 1998). To reduce the number of model parameters, we focus on a remnant that is 1 kyr old, as in the case of SN 1006. Finally, radio, X-ray, and γ-ray images are synthesized at 1 GHz, 3 keV, and 1 TeV, respectively. We emphasize that all the above parameters are not expected to influence the pattern of the asymmetries induced by a non-uniform ISMF on which the present paper is focused (see, also, Sect. 4.6 for a discussion of the influence of Emax,∥ on the remnant morphology).
4.2. Asymmetries in the remnant morphology: the reference case
In Paper I, we analyzed the asymmetries induced by a non-uniform ISMF in the radio
morphology of the remnant. In particular, we found that asymmetric BSNRs are produced if a
gradient in the ambient magnetic field strength ∇B is not aligned with
the LoS. In this section, we extend our analysis to non-thermal X-rays and
IC γ-rays. To this end, we synthesize the synchrotron and IC emission,
considering each of the three cases of variations in electron injection efficiency with
shock obliquity (quasi-perpendicular, isotropic, and quasi-parallel particle injection).
We also assume the adiabatic index to be γ = 5/3; the
effects of lower γ values on the remnant morphology are explored in
Sect. 4.3. Here the maximum energy of electrons is
calculated at each point as
Emax = min [Emax,1,Emax,2,Emax,3]
(where the indices 1,2, and 3 correspond, respectively,
to loss-limited, time-limited, and escape-limited models; see discussion in Sect. 3.1). For the set of parameters chosen for our
simulations, the loss-limited model is found to be dominant at all obliquity angles, thus
simplifying the analysis of non-thermal images in this section. Figure 3 shows Emax versus the
azimuthal angle (the azimuth is measured counterclockwise from the “north” of the remnant)
for runs Grad-BZ-g1 and Grad-BX-g1. In both cases, Emax is
characterized by two maxima where the ISMF is parallel to the shock normal
(around 90° and 270°); thus the contrast of
Emax is  .
The strength of the unperturbed ISMF is greatest at 180° (90°) and
least at 360° (270°) in run Grad-BZ-g1 (Grad-BX-g1) because of the
magnetic field gradient. The gradient determines the asymmetries in the azimuthal profile
of Emax: in run Grad-BZ-g1, the two maxima converge on the
side where the field is the most intense, the gradient being perpendicular to the average
magnetic field; in run Grad-BX-g1, the two maxima have different intensities (the greatest
occurring where the magnetic field is at its lowest7), the gradient being parallel to the average magnetic field.
.
The strength of the unperturbed ISMF is greatest at 180° (90°) and
least at 360° (270°) in run Grad-BZ-g1 (Grad-BX-g1) because of the
magnetic field gradient. The gradient determines the asymmetries in the azimuthal profile
of Emax: in run Grad-BZ-g1, the two maxima converge on the
side where the field is the most intense, the gradient being perpendicular to the average
magnetic field; in run Grad-BX-g1, the two maxima have different intensities (the greatest
occurring where the magnetic field is at its lowest7), the gradient being parallel to the average magnetic field.
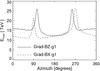 |
Fig. 3 Azimuthal profiles of the maximum energy Emax computed
in run Grad-BZ-g1 (solid line) and Grad-BX-g1 (dashed line) when the aspect angle is
φB = 90° and the gradient of magnetic field
strength lies in the plane of the sky
(φ∇B = 0° in run Grad-BZ-g1 and
φ∇B = 90° in run Grad-BX-g1). The shock is
parallel around 90° and 270° and perpendicular around
180° and 360°. In both models, the contrast
|
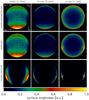 |
Fig. 4 Maps of synchrotron radio (left), X-ray (center), and IC γ-ray (right) surface brightness (normalized to the maximum of each map) at t = 1 kyr synthesized from run Grad-BZ-g1, assuming randomized internal magnetic field. The relevant angles are φB = 90° and φ∇B = 0°. The figure shows the quasi-perpendicular (top), isotropic (middle), and quasi-parallel (bottom) particle injection models. The adiabatic index is γ = 5/3. The average ambient magnetic field is aligned along the horizontal axis; the gradient in magnetic field strength along the vertical axis. |
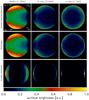 |
Fig. 5 As in Fig. 4 for run Grad-BX-g1. Both the average ambient magnetic field and the gradient of magnetic field strength are along the horizontal axis. The relevant angles are φB = 90° and φ∇B = 90°. |
As an example, Figs. 4 and 5 show the maps of synchrotron radio, X-ray, and IC γ-ray surface brightness at t = 1 kyr, in each of the three injection models (quasi-perpendicular, isotropic, and quasi-parallel). The aspect angle is φB = 90° in all images, i.e. the ambient magnetic field is perpendicular to the LoS. The angle φ∇B is 0° for run Grad-BZ-g1 and 90° for Grad-BX-g1.
The main factors affecting the azimuthal variations in surface brightness are the variations in: injection efficiency fς(Θo) and magnetic field Bs(Θo) in the radio band; fς(Θo), Bs(Θo), and maximum energy Emax(Θo) in the X-ray band; fς(Θo) and Emax(Θo) in the IC γ-ray band. Therefore, the morphology of the remnant in the three bands can differ considerably in appearance. In the radio and X-ray bands, the remnant shows two lobes located at perpendicular shocks in the quasi-perpendicular and isotropic models (i.e. where the magnetic field is stronger), and at parallel shocks in the quasi-parallel model (i.e. where emitting electrons reside). The lobes are much thinner in X-rays than in radio because of the large radiative losses at the highest energies that ensure the X-ray emission is dominated by radii closest to the shock. In the γ-ray band, the remnant morphology changes significantly in the three injection models: it is almost ring-like (with two faint minima at parallel shocks) when the injection is quasi-perpendicular; the remnant displays two lobes located at parallel shocks when the injection is isotropic, at variance with the lobes in radio and X-rays that are located at perpendicular shocks (i.e. bright γ-ray lobes correspond to dark radio and X-ray areas); the morphology is characterized by two narrow bright lobes almost superimposed on those in radio and X-rays when the injection is quasi-parallel. A ring-like γ-ray morphology is compatible with those found by HESS in the SNRs RX J1713.7-3946 (Aharonian et al. 2006) and RX J0852.0-4622 (Vela Jr.; Aharonian et al. 2007b) where γ-rays are detected virtually throughout the whole remnant and the emission is found to resemble a shell structure. On the other hand, the bipolar γ-ray morphology of SN 1006 revealed by HESS (Acero et al. 2010), with the bright lobes strongly correlated with non-thermal X-rays, may be easily reproduced in the polar-caps scenario (quasi-parallel injection).
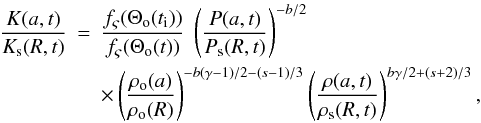
The effects of the non-uniform ISMF on the remnant morphology in the X-ray band are similar to those discussed in Paper I for the radio band: remnants with two non-thermal X-ray lobes of different brightness (upper and middle panels in Fig. 4 and lower panels in Fig. 5) are produced if a gradient in the ambient magnetic field strength is perpendicular to the lobes; remnants with converging similar non-thermal X-ray lobes (lower panels in Fig. 4 and upper and middle panels in Fig. 5) are produced if the gradient runs between the two lobes. Analogous asymmetries are found in the γ-ray morphology of the remnant, although the degree of asymmetry is less evident. However, in the case of isotropic injection, the γ-ray lobes converge on one side when radio and X-ray lobes are characterized by different brightness (see middle panels in Fig. 4). This is a consequence of the “limb-inverse” property in γ-rays8 (Petruk et al. 2009a). In general, this property is valid not only for isotropic injection; this type of injection is just the more prominent case. The critical quantities determining the “limb-inverse” property are the contrasts between electron injection, ISMF, and model of Emax. For instance, in the case of uniform ISMF, the azimuthal contrast in IC γ-ray brightness is roughly
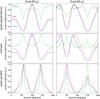 |
Fig. 6 Azimuthal profiles of the synchrotron radio (red), X-ray (blue), and IC γ-ray (green) surface brightness synthesized from runs Grad-BZ-g1 (left; the relevant angles are φB = 90° and φ∇B = 0°) and Grad-BX-g1 (right; φB = 90° and φ∇B = 90°), assuming quasi-perpendicular (top), isotropic (middle), and quasi-parallel (bottom) injection models. The adiabatic index is γ = 5/3. The azimuth is measured counterclockwise from the north (see Figs. 4 and 5). The corresponding azimuthal profiles of Emax used to derive the curves of this figure are in Fig. 3. |
![Mathematical equation: \begin{equation} \begin{array}{rl} \displaystyle \frac{S\rs{\parallel}}{S\rs{\perp}} & \displaystyle \propto \frac{\rm injection\rs{\parallel}}{\rm injection\rs{\perp} } \exp\left[-E\rs{m}\left(\frac{1}{E\rs{max,\parallel}} - \frac{1}{E\rs{max,\perp}}\right)\right] \\ \\ & \displaystyle = \frac{\rm injection\rs{\parallel}}{\rm injection\rs{\perp}} \exp\left[-\frac{E\rs{m}}{E\rs{max,\parallel}} \left(1-\frac{E\rs{max,\parallel}}{E\rs{max,\perp}}\right)\right]\\ \end{array}, \end{equation}](/articles/aa/full_html/2011/02/aa15505-10/aa15505-10-eq211.png) (21)where
Em is the electron energy corresponding to the maximum
contribution to IC emission at a considered frequency and subscripts refer to positions
along the limb where the ambient magnetic field is either parallel (∥) or perpendicular
(⊥) to the shock normal. Even in the case of quasi-parallel injection
(injection∥/injection⊥ > 1),
the contrast
S∥/S⊥
depends on the contrast of Emax: the ratio
(21)where
Em is the electron energy corresponding to the maximum
contribution to IC emission at a considered frequency and subscripts refer to positions
along the limb where the ambient magnetic field is either parallel (∥) or perpendicular
(⊥) to the shock normal. Even in the case of quasi-parallel injection
(injection∥/injection⊥ > 1),
the contrast
S∥/S⊥
depends on the contrast of Emax: the ratio
 may lead to an exponential term that is either >1 or
<1, leading to either
S∥/S⊥ > 1
or <1.
may lead to an exponential term that is either >1 or
<1, leading to either
S∥/S⊥ > 1
or <1.
Another interesting characteristic of the IC γ-ray morphology of the
remnant is the inversion of the asymmetry when the two lobes have different brightness
(i.e. a gradient in the magnetic field strength is perpendicular to the lobes). This can
be seen in the upper panels of Fig. 4 and the lower
panels of Fig. 5: the brightest
γ-ray lobe is located where both the radio and the X-ray lobes are
fainter. As discussed in detail below in Sect. 4.4,
this is because, in the synthetic images presented in this section,
Emax depends inversely on the pre-shock ambient magnetic
field strength (see Eq. (10) and
Fig. 3) and its contrast is
.
Figure 6 shows the azimuthal profiles of the synchrotron radio, X-ray, and IC γ-ray surface brightness synthesized from runs Grad-BZ-g1 and Grad-BX-g1 for the three injection models when the relevant angles are φB = 90° and φ∇B = 0° for run Grad-BZ-g1 and φ∇B = 90° for Grad-BX-g1. In the quasi-parallel scenario, the non-thermal lobes are rather narrow azimuthally. We note the “limb-inverse” property in γ-rays evident for isotropic injection as discussed by Petruk et al. (2009a), and the “asymmetry-inverse” property in γ-rays when the two lobes have different brightness. In general, we find that the degree of asymmetry (regardless of the pattern of asymmetry – the lobes being of either different brightness or convergence) induced by ∇B in the remnant morphology is different in the three bands (see Sect. 4.5 for a discussion about the degree of asymmetry of the remnant in the different bands); in particular, the IC γ-ray emission appears to be the least sensitive to the gradient.
Useful parameters for quantifying the degree of asymmetry of the remnant are those defined in Paper I: the azimuthal intensity ratio Rmax ≥ 1, i.e. the ratio of the maxima of intensity of the two lobes derived from the azimuthal intensity profiles (a measure of different brightness of the lobes; Rmax > 1 in the case of asymmetry), and the azimuthal distance θD, i.e. the distance in degrees of the two maxima (a measure of the convergence of the lobes; θD < 180° in the case of asymmetry). For instance, in the case of quasi-parallel injection in Fig. 6 (lower panels), we find that the azimuthal distance θD ranges from 148° in both γ-rays and X-rays to 134° in radio for run Grad-BZ-g1, and the azimuthal intensity ratio Rmax ranges from 1.4 in γ-rays to 1.8 in both radio and X-rays for run Grad-BX-g1.
4.3. Dependence on the adiabatic index
Petruk et al. (2010b) analyzed the effect of γ on non-thermal images of SNR expanding through a homogeneous ISM and uniform ISMF. They showed that by decreasing the value of γ, the synchrotron brightness of the remnant is modified by the larger radiative losses of the emitting electrons due to increased compression of B, which results in thinner radial profiles of brightness. Figure 7 shows maps of synchrotron radio, X-ray, and IC γ-ray emission for the case of ISMF characterized by a gradient in field strength perpendicular to the average magnetic field and different values of the adiabatic index γ (runs Grad-BZ-g1, Grad-BZ-g2, and Grad-BZ-g3). As expected, the index γ determines both the shock compression ratio σ and the distance of the contact discontinuity from the blast wave position Dcd (see also Fig. 1 in the case of uniform ISMF): the smaller γ, the larger σ (and the larger the radiative losses of emitting electrons) and the shorter Dcd. As shown in the figure, the main effect of smaller γ is to decrease the thickness of the lobes emitting synchrotron emission in the three bands. In particular, in the extreme case of γ = 1.1, the lobes are so thin that they are largely perturbed by the hydrodynamic instabilities forming at the contact discontinuity, the typical size of the instabilities being comparable with Dcd. The adiabatic index also slightly influences the azimuthal thickness of the lobes, especially in the quasi-parallel case: the smaller γ, the narrower this thickness. Nevertheless, the adiabatic index significantly changes neither the degree nor the pattern of asymmetry of the remnant morphology caused by the gradient in magnetic field strength.
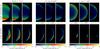 |
Fig. 7 As in Fig. 4 for runs Grad-BZ-g1 (γ = 5/3), Grad-BZ-g2 (γ = 4/3), and Grad-BZ-g3 (γ = 1.1). The figure shows synchrotron radio (left panels), X-ray (center panels), and IC γ-ray (right panels), assuming either quasi-perpendicular (upper panels) or quasi-parallel (lower panels) injection models. Each panel shows only one half of the remnant, which is symmetric with respect to the vertical axis. |
4.4. Dependence on the maximum energy
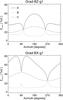 |
Fig. 8 As in Fig. 3 but for three different models of
Emax characterized by smooth variations with obliquity
angle. The azimuth is measured counterclockwise from the “north” of the remnant. The
shock is parallel around 90° and 270° and perpendicular around
180° and 360°. In model A (solid line), the contrast of
Emax is |
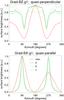 |
Fig. 9 Azimuthal profiles of the synchrotron radio (red lines) and IC γ-ray surface brightness (green) synthesized from run Grad-BZ-g1 with quasi-perpendicular injection (top), and from run Grad-BX-g1 with quasi-parallel injection (bottom); the aspect angle is φB = 90°. The models of Emax adopted to synthesize the non-thermal emission are those shown in Fig. 8: model A (solid line), B (dotted), and C (dashed). |
In Sect. 4.2, we have presented the remnant
morphology for a reference case in which Emax is calculated at
each point as
Emax = min [Emax,1,Emax,2,Emax,3]
(where the indices 1,2, and 3 correspond, respectively,
to loss-limited, time-limited, and escape-limited models; see discussion in Sect. 3.1) is characterized by a contrast
.
Here we generalize our study by considering some arbitrary smooth variations in
Emax versus obliquity with the goal of observing how
different trends in the obliquity dependence of Emax influence
the visible morphology of SNRs. That is, we do not use in this section the prescriptions
for Emax given in Sect. 3.1, but simply assume that the acceleration physics is able to operate to
produce an Emax of the prescribed properties. The model of
Emax and its obliquity dependence may affect both the degree
and the pattern of asymmetry of the remnant morphology. It is important to consider
whether Emax depends directly or inversely on the magnetic
field strength. Moreover the remnant morphology in the various bands can be characterized
by different features depending on whether the contrast is either
 or <1. As an example, Fig. 8 shows the azimuthal profiles of three arbitrary models
of Emax that depend differently on the obliquity angle: in
model A, Emax ∝ B and its contrast is
or <1. As an example, Fig. 8 shows the azimuthal profiles of three arbitrary models
of Emax that depend differently on the obliquity angle: in
model A, Emax ∝ B and its contrast is
 (solid line); in model B,
Emax ∝ B−1/2
and
(dotted); in model C, Emax ∝ B and
on the side of the remnant with the strongest ISMF strength and
>1 on the side with the lowest field strength. We note that
model B coincides with the model of Emax computed for the
reference case in Sect. 4.2 (see Fig. 3). The asymmetries on the profiles of
Emax are introduced by the gradient in the ambient magnetic
field, as discussed in Sect. 4.2.
(solid line); in model B,
Emax ∝ B−1/2
and
(dotted); in model C, Emax ∝ B and
on the side of the remnant with the strongest ISMF strength and
>1 on the side with the lowest field strength. We note that
model B coincides with the model of Emax computed for the
reference case in Sect. 4.2 (see Fig. 3). The asymmetries on the profiles of
Emax are introduced by the gradient in the ambient magnetic
field, as discussed in Sect. 4.2.
From the models of Emax shown in Fig. 8, we synthesized maps of synchrotron radio, X-ray, and IC γ-ray emission. We find that the remnant morphology is very sensitive to the model of Emax when a gradient in the magnetic field strength is perpendicular to the lobes and the latter are characterized by different brightnesses. The asymmetry between the two lobes can decrease in the X-ray band or even be inverted in the IC γ-ray band when Emax depends inversely on the pre-shock ambient magnetic field strength, namely in the case of model B in Fig. 8. In particular, this model of Emax leads to the “asymmetry-inverse” property in γ-rays already discussed in Sect. 4.2 for our reference case (see upper right panel in Fig. 4 and lower right panel in Fig. 5).
Figure 9 shows the azimuthal profiles of the IC γ-ray surface brightness synthesized from runs Grad-BZ-g1 and Grad-BX-g1 in which the lobes have different brightness, for the three models of Emax reported in Fig. 8. For the IC surface brightness, the asymmetry-inverse property is evident when Emax reaches its highest value where the magnetic field strength is its lowest (see model B in Fig. 8). This happens because the IC emissivity i(ϵ) depends weakly on B. In the case of the non-thermal X-ray surface brightness, the inverse dependence of Emax on B partially contrasts with the dependence of the non-thermal X-ray i(ϵ) on B, reducing the degree of asymmetry between the lobes. We note that, if Emax is high enough in regions of weak magnetic field, then the inversion of asymmetry may be present even in the X-ray band.
On the other hand, we also found that when the non-uniform ISMF leads to non-thermal lobes converging on one side (i.e. when there is a non-zero gradient of ISMF between the lobes) the model of Emax does not significantly affect the degree and the pattern of asymmetry of the remnant morphology.
4.5. Dependence on the orientation of ISMF gradient
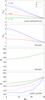 |
Fig. 10 Azimuthal intensity ratio Rmax (i.e. the ratio of the maxima of intensity of the two lobes around the shell) and azimuthal distance θD (i.e. the distance in degrees of the two maxima of intensity around the shell) versus the angle between ∇B and the vertical line passing through the remnant center φ∇B, for an aspect angle φB = 90°, and for the three models of Emax shown in Fig. 8. The run is Grad-BZ-g1. For isotropic injection, curves for Rmax in γ-rays and curves for θD in radio and X-rays are not shown, the values being Rmax = 1 and θD = 180°, respectively at all φ∇B. |
As expected, the degree of asymmetry of the remnant morphology depends on the orientation
of ∇B with respect to the plane of the sky. In the case of run
Grad-BZ-g1, Fig. 10 shows the azimuthal intensity
ratio Rmax and the azimuthal distance
θD versus the angle φ∇B, for an
aspect angle φB = 90° and for different trends in
the obliquity dependence of Emax (exploring the contrasts of
either
or <1; see Fig. 8). The
asymmetries are largest when ∇B lies in the plane of the sky (i.e.
φ∇B = 0°), whereas no asymmetries are present
when ∇B is aligned along the LoS (i.e.
φ∇B = 90°). In all the intermediate cases, the
degree of asymmetry is determined by the component of ∇B lying in the
plane of the sky. We note that the remnant morphology has only one kind of asymmetry when
the injection is quasi-perpendicular or quasi-parallel and the aspect angle is
φB = 90°. On the other hand, the lobes have
different brightnesses in radio and non-thermal X-rays and converge in
IC γ-rays when the injection is isotropic due to the “limb-inverse”
property.
In general, we find that the degree of asymmetry (regardless of the pattern of asymmetry
– lobes either of different brightness or convergence) induced by ∇B in
the remnant morphology differs in the three bands: the non-thermal X-ray
(IC γ-ray) emission appears to be the most (least) sensitive to the
gradient. This happens because the emissivity i(ϵ)
depends directly on the magnetic field strength (see Eq. (3)) only for the synchrotron emission process (not for the IC process).
Consequently, the IC γ-ray emission shows a weaker dependence on
∇B. The IC brightness indeed depends indirectly on
B, through radiative losses of electrons: a stronger
B causes the number of electrons emitting
IC γ-rays to decrease. We note that the sensitivity on
∇B also depends on the energy of photons, and the lower fiducial energy
Ef, which measures the efficiency of radiative losses in
modifying the downstream evolution of emitting electrons. We also note that the degree of
asymmetry of the remnant morphology can be significantly lower when the
Emax contrast is
(e.g. model B in Fig. 8). The asymmetry reduction is
mainly due to the dependence of Emax on the magnetic field
strength. As discussed in Sect. 4.4, the asymmetries
in the remnant morphology can be lower or even inverted when
Emax depends inversely on the pre-shock ambient magnetic
field strength (which is the case in model B).
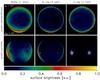 |
Fig. 11 Maps of synchrotron radio (left), X-ray (center), and IC γ-ray (right) surface brightness synthesized from run Grad-BZ-g1, assuming quasi-perpendicular (top), and quasi-parallel (bottom) injection models. The adiabatic index is γ = 5/3. The maps have been synthesized adopting model B of Emax shown in Fig. 8. The relevant angles are φB = 45° and φ∇B = 45°. The angle between ⟨ B ⟩ and ∇| ⟨ B ⟩ | is 90°. |
When the ∇B is not aligned with the average ambient magnetic field (for instance in run Grad-BZ-g1), the projection of the ∇B in the plane of the sky has (for generic values of φB and φ∇B) a component perpendicular to the projected lobes and one running between them. Both kind of asymmetries (lobes converging on one side and with different brightness) are then expected in the remnant morphology. As an example, Fig. 11 shows the synchrotron radio, X-ray, and IC γ-ray images synthesized from run Grad-BZ-g1, for different injection models. The relevant angles are φB = 45° and φ∇B = 45°.
4.6. Dependence on the value of Emax,∥
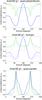 |
Fig. 12 As in Fig. 6, for the azimuthal profiles of the synchrotron X-ray (blue) and IC γ-ray (green) surface brightness synthesized from run Grad-BZ-g1, for Emax,∥ = 26 TeV (solid), 5 TeV (dotted), and 1 TeV (dashed). The surface brightness is synthesized deriving the maximum energy Emax as described in Sect. 4.2; its azimuthal profile is similar to that shown in Fig. 3 (solid line) but has a different value of Emax,∥. In all cases, Ef,∥ = 12 TeV. |
The calculations presented above assume that the free parameter Emax,∥ = 26 TeV is higher than the fiducial energy Ef,∥ = 12 TeV, implying that the electron energy losses are mainly due to radiative losses (see Sect. 3.2). The variation in the energy distribution N(E,a,t) of electrons in Eq. (19) is influenced by radiative losses of electrons that are, therefore, important to the surface brightness distribution of the remnant in X-rays and γ-rays. Consequently, the choice of Emax,∥ may influence both the degree and pattern of asymmetry of the remnant morphology. In particular, when Emax < Ef, we expect that ℰrad → ∞ (i.e. electrons have negligible radiative losses) and the electron energy losses are mainly due to adiabatic expansion. This is now investigated by considering the reference case discussed in Sect. 4.2 and two additional cases for which Emax < Ef, namely Emax,∥ = 5 TeV and Emax,∥ = 1 TeV. Figure 12 shows the azimuthal profiles of the synchrotron X-ray and IC γ-ray surface brightness synthesized from run Grad-BZ-g1, for these values of Emax,∥ together with the case of Emax,∥ = 26 TeV (the reference case). We note that Emax is calculated at each point of the domain as described in Sect. 4.2 but for different values of Emax,∥ (see also Sect. 3.1). The figure shows that for decreasing values of Emax,∥, the contrast in the emission increases, the effect being the greatest for IC γ-ray emission than for synchrotron X-rays. Nevertheless, the degree and pattern of asymmetry of the remnant morphology induced by the gradient in ISMF are only slightly influenced by the value of Emax,∥.
5. Summary and conclusions
We have developed a numerical code (remlight) to synthesize the synchrotron radio, X-ray, and IC γ-ray emission from MHD simulations, in the general case of a remnant expanding through a non-uniform ISM and/or a non-uniform ISMF. As a first application of remlight, we have coupled the synthesis code to the MHD model discussed in Paper I (extended to include an approximate treatment of upstream magnetic field amplification and the effect of shock modification due to the back reaction of accelerated CRs) and investigated the effects of a non-uniform ISMF on the remnant morphology in the X-ray and γ-ray bands. Our findings lead to several conclusions:
-
A gradient in the ISMF strength induces asymmetries in both the X-ray and γ-ray morphology of the remnant if the gradient has a component perpendicular to the LoS. In general, the asymmetries are analogous to those found in Paper I in the radio band, independently of the models of electron injection and maximum energy of electrons accelerated by the shock. In the γ-ray band, the asymmetry in the remnant morphology is inverted with respect to those in the radio and X-ray bands if the model of Emax depends inversely on the pre-shock magnetic field strength and its contrast is
(e.g. model B in Fig. 8): the brightest
γ-ray lobe is located where both the radio and the X-ray lobes are
their faintest. -
The non-thermal lobes have different brightnesses when a gradient in the ISMF strength is perpendicular to the lobes; they converge on one side when a gradient in the ISMF is aligned between them. In the general case of a gradient with components parallel and perpendicular to the lobes, both kinds of asymmetry may affect the remnant morphology.
-
The non-thermal X-ray emission is confined to very thin limbs because of the large radiative losses at high energy and, in general, is the most sensitive to a non-uniform ISMF. The remnant morphology in this band displays the highest degree of asymmetry among the images synthesized in the three bands of interest (i.e. radio, X-ray, and γ-ray), except when Emax depends inversely on the pre-shock magnetic field strength. In this last case, the degree of asymmetry in the X-ray band can be significantly lower than in cases for which Emax depends directly on the pre-shock field strength.
-
The IC γ-ray emission is weakly sensitive to the non-uniform ISMF, the degree of asymmetry being the lowest in the three bands considered. The remnant morphology is almost ring-like for quasi-perpendicular injection, shows the “limb-inverse” property discussed by Petruk et al. (2009a) for isotropic injection (i.e. bright γ-ray lobes correspond to both dark radio and X-ray areas), and is bilateral for quasi-parallel injection. The “limb-inverse” property implies, for instance, that γ-ray lobes are symmetric and converge on one side when radio and X-ray lobes have different brightnesses (see Fig. 4). When Emax depends inversely on the pre-shock ambient magnetic field strength, the asymmetries in the IC γ-ray morphology can be inverted in space; for instance, the brightest γ-ray lobe can be located where both the radio and X-ray lobes are fainter (see lower right panel in Fig. 6). We note that the γ-ray morphology of the SNRs RX J1713.7-3946 (Aharonian et al. 2006) and RX J0852.0-4622 (Aharonian et al. 2007b) could be reproduced by the equatorial-belt scenario (in which the injection is either quasi-perpendicular or isotropic), whereas the morphology of SN 1006 (Acero et al. 2010) is compatible with that predicted in the polar-caps scenario (quasi-parallel injection).
Although the MHD model presented here does not self-consistently include shock modification and magnetic field amplification, we have adopted an approximate treatment of both processes. Magnetic field amplification could result from streaming instability excited by the accelerated particles upstream of the shock or, alternatively, the magnetic fields could be amplified in a purely hydrodynamic way in the downstream plasma (Giacalone & Jokipii 2007). In both cases, the shock is expected to be modified by the dynamical reaction of the amplified magnetic field (see, for instance, Ferrand et al. 2010, for an example of hydrodynamic model including the back reaction of accelerated CRs). In this paper, we have approached the effect of shock modification by considering different values of the adiabatic index γ (namely, 5/3, 4/3, and 1.1) and the effect of upstream magnetic field amplification by considering the ambient magnetic field strength enhanced by a factor of ten in the neighborhoods of the remnant (the unperturbed field strength commonly expected is a few μG). The main effect of γ is to change both the shock compression ratio and the distance of the contact discontinuity from the blast wave position. In the simplest case considered here, the modification of γ and the upstream magnetic field amplification are both isotropic and do not depend on the obliquity angle. We then found that the modified γ and the amplified field influence mainly the absolute values of non-thermal emission but not either the large-scale morphology of the remnant or the pattern of asymmetries induced by a non-uniform ISMF. The results presented here, therefore, are only valid in this case. In contrast, we expect a significant effect of the modified γ as well as of the amplified field on the remnant morphology if the shock modification and/or upstream magnetic field amplification depend on the obliquity, a topic that deserves further investigation in future studies.
We emphasize that the calculations provided in this paper (and implemented in the remlight code) to synthesize the non-thermal emission from MHD simulations consider a generic adiabatic index γ. The remlight code therefore can be easily coupled with a model including the back reaction of accelerated CRs and synthesize the non-thermal emission consistently if the value of an “effective” γ is provided at each point of the spatial domain9.
We note that the MHD model adopted here follows the evolution of the remnant during the adiabatic phase and, therefore, its applicability is limited to this evolutionary stage. In the radiative phase, the high degree of compression suggested by radiative shocks leads to an increase in the synchrotron emission brightness owing to the compression of the ambient magnetic field and the electrons. Since our model neglects the radiative cooling of the shocked gas, it is limited to compression ratios derived from γ and, therefore, is unable to simulate this limb brightening. Nevertheless, the model is appropriate to describing young SNRs such as those from which non-thermal emission is commonly detected.
This idealized situation is adopted here mainly to ensure magnetostaticity of the non-uniform field.
Note that the distribution of electrons N(E) in the case of synchrotron radio emission is expressed as N(E) = KE−s electrons cm-3 erg s-1 (see, for instance, Paper I).
Note however that Kang & Ryu (2010) suggest that α > 1.
For the escape case, it is commonly assumed that MHD waves responsible for the scattering are much weaker above some wavelength, λmax, and Emax is approximately the energy of particles with that gyroradius (e.g. Reynolds 1998).
The “gyrofactor” is defined as the ratio of the mean free path, λ∥, along the magnetic field to the gyroradius, rg (see Reynolds 1998). In general it is expected that the mean free path can be no shorter than rg, so that η ≥ 1; the equality corresponds to the Bohm limit, i.e. a level of turbulence leading to wave amplitudes comparable to the stationary magnetic field strength.
Note that Ef,∥ depends on the magnetic field strength at parallel shock, which is different in the three configurations of unperturbed ISMF explored here because of the magnetic field gradient (in all the cases, we fix the magnetic field strength to be that at the center of the SN explosion).
In the loss-limited model Emax ∝ B−1/2, see Sect. 3.1.
The “limb-inverse” property in γ-rays is determined for isotropic injection because the magnetic field affects the downstream distribution of IC γ-ray emitting electrons, which is steeper where the magnetic field is stronger. The reader is referred to Petruk et al. (2009a) for more details.
See, for instance, Ferrand et al. (2010) for an hydrodynamic model calculating the “effective” γ in each point of the spatial domain (see also Ellison et al. 2004).
The approximation (A.7) is developed to give exact values of derivatives up to the third order at the shock and to the first order at the center.
Acknowledgments
We thank an anonymous referee for the careful reading of the manuscript and for constructive and helpful criticism. This work was supported in part by the Italian Ministry of University and Research (MIUR) and by Istituto Nazionale di Astrofisica (INAF). The software used in this work was in part developed by the DOE-supported ASC/Alliance Center for Astrophysical Thermonuclear Flashes at the University of Chicago. The simulations have been executed at the HPC facility (SCAN) of the INAF-Osservatorio Astronomico di Palermo and at CINECA (Bologna, Italy) in the framework of the INAF-CINECA agreement “High Performance Computing resources for Astronomy and Astrophysics”.
References
- Acero, F., Ballet, J., Decourchelle, A., et al. 2009, A&A, 505, 157 [NASA ADS] [CrossRef] [EDP Sciences] [Google Scholar]
- Acero, F., Aharonian, F., Akhperjanian, A. G., et al. 2010, A&A, 516, A62 [Google Scholar]
- Aharonian, F., Akhperjanian, A., Barrio, J., et al. 2001, A&A, 370, 112 [NASA ADS] [CrossRef] [EDP Sciences] [Google Scholar]
- Aharonian, F., Akhperjanian, A. G., Bazer-Bachi, A. R., et al. 2005, A&A, 437, L7 [NASA ADS] [CrossRef] [EDP Sciences] [Google Scholar]
- Aharonian, F., Akhperjanian, A. G., Bazer-Bachi, A. R., et al. 2006, A&A, 449, 223 [NASA ADS] [CrossRef] [EDP Sciences] [Google Scholar]
- Aharonian, F., Akhperjanian, A. G., Bazer-Bachi, A. R., et al. 2007a, A&A, 464, 235 [Google Scholar]
- Aharonian, F., Akhperjanian, A. G., Bazer-Bachi, A. R., et al. 2007b, ApJ, 661, 236 [NASA ADS] [CrossRef] [Google Scholar]
- Albert, J., Aliu, E., Anderhub, H., et al. 2007, A&A, 474, 937 [NASA ADS] [CrossRef] [EDP Sciences] [Google Scholar]
- Allen, G. E., Houck, J. C., & Sturner, S. J. 2008, ApJ, 683, 773 [NASA ADS] [CrossRef] [Google Scholar]
- Bandiera, R., & Petruk, O. 2010, A&A, 509, A34 [NASA ADS] [CrossRef] [EDP Sciences] [Google Scholar]
- Berezhko, E. G., & Völk, H. J. 2008, A&A, 492, 695 [NASA ADS] [CrossRef] [EDP Sciences] [Google Scholar]
- Blondin, J. M., Wright, E. B., Borkowski, K. J., & Reynolds, S. P. 1998, ApJ, 500, 342 [NASA ADS] [CrossRef] [Google Scholar]
- Dickel, J. R., van Breugel, W. J. M., & Strom, R. G. 1991, AJ, 101, 2151 [NASA ADS] [CrossRef] [Google Scholar]
- Ellison, D. C., Berezhko, E. G., & Baring, M. G. 2000, ApJ, 540, 292 [NASA ADS] [CrossRef] [Google Scholar]
- Ellison, D. C., Slane, P., & Gaensler, B. M. 2001, ApJ, 563, 191 [NASA ADS] [CrossRef] [Google Scholar]
- Ellison, D. C., Decourchelle, A., & Ballet, J. 2004, A&A, 413, 189 [NASA ADS] [CrossRef] [EDP Sciences] [Google Scholar]
- Enomoto, R., Tanimori, T., Naito, T., et al. 2002, Nature, 416, 823 [NASA ADS] [CrossRef] [PubMed] [Google Scholar]
- Enomoto, R., Watanabe, S., Tanimori, T., et al. 2006, ApJ, 652, 1268 [NASA ADS] [CrossRef] [Google Scholar]
- Ferrand, G., Decourchelle, A., Ballet, J., Teyssier, R., & Fraschetti, F. 2010, A&A, 509, L10 [NASA ADS] [CrossRef] [EDP Sciences] [Google Scholar]
- Fraschetti, F., Teyssier, R., Ballet, J., & Decourchelle, A. 2010, A&A, 515, A104 [NASA ADS] [CrossRef] [EDP Sciences] [Google Scholar]
- Fryxell, B., Olson, K., Ricker, P., et al. 2000, ApJS, 131, 273 [NASA ADS] [CrossRef] [Google Scholar]
- Fulbright, M. S., & Reynolds, S. P. 1990, ApJ, 357, 591 [NASA ADS] [CrossRef] [Google Scholar]
- Gaensler, B. M. 1998, ApJ, 493, 781 [NASA ADS] [CrossRef] [Google Scholar]
- Gaisser, T. K., Protheroe, R. J., & Stanev, T. 1998, ApJ, 492, 219 [NASA ADS] [CrossRef] [Google Scholar]
- Giacalone, J., & Jokipii, J. R. 2007, ApJ, 663, L41 [NASA ADS] [CrossRef] [Google Scholar]
- Hnatyk, B., & Petruk, O. 1999, A&A, 344, 295 [NASA ADS] [Google Scholar]
- Hnatyk, B. I. 1987, Astrofizika, 26, 113 [NASA ADS] [Google Scholar]
- Hoppe, S., & Lemoine-Goumard, M. 2008, in International Cosmic Ray Conference, 2, Int. Cosmic Ray Conf., 585 [Google Scholar]
- Jokipii, J. R. 1987, ApJ, 313, 842 [Google Scholar]
- Kang, H., & Ryu, D. 2010, ApJ, 721, 886 [NASA ADS] [CrossRef] [Google Scholar]
- Katagiri, H., Enomoto, R., Ksenofontov, L. T., et al. 2005, ApJ, 619, L163 [NASA ADS] [CrossRef] [Google Scholar]
- Kesteven, M. J., & Caswell, J. L. 1987, A&A, 183, 118 [NASA ADS] [Google Scholar]
- Koyama, K., Petre, R., Gotthelf, E. V., et al. 1995, Nature, 378, 255 [NASA ADS] [CrossRef] [Google Scholar]
- Lazendic, J. S., Slane, P. O., Gaensler, B. M., et al. 2004, ApJ, 602, 271 [NASA ADS] [CrossRef] [Google Scholar]
- Löhner, R. 1987, Comp. Meth. Appl. Mech. Eng., 61, 323 [Google Scholar]
- MacNeice, P., Olson, K. M., Mobarry, C., de Fainchtein, R., & Packer, C. 2000, Comp. Phys. Comm., 126, 330 [Google Scholar]
- Miceli, M., Bocchino, F., Iakubovskyi, D., et al. 2009, A&A, 501, 239 [NASA ADS] [CrossRef] [EDP Sciences] [Google Scholar]
- Muraishi, H., Tanimori, T., Yanagita, S., et al. 2000, A&A, 354, L57 [NASA ADS] [Google Scholar]
- Orlando, S., Bocchino, F., Reale, F., Peres, G., & Petruk, O. 2007, A&A, 470, 927 (Paper I) [NASA ADS] [CrossRef] [EDP Sciences] [Google Scholar]
- Petruk, O. 2000, A&A, 357, 686 [NASA ADS] [Google Scholar]
- Petruk, O. 2005, J. Phys. Studies, 9, 364 [NASA ADS] [Google Scholar]
- Petruk, O. 2009, A&A, 499, 643 [NASA ADS] [CrossRef] [EDP Sciences] [Google Scholar]
- Petruk, O., Beshley, V., Bocchino, F., & Orlando, S. 2009a, MNRAS, 395, 1467 [NASA ADS] [CrossRef] [Google Scholar]
- Petruk, O., Bocchino, F., Miceli, M., et al. 2009b, MNRAS, 399, 157 [NASA ADS] [CrossRef] [Google Scholar]
- Petruk, O., Dubner, G., Castelletti, G., et al. 2009c, MNRAS, 393, 1034 [NASA ADS] [CrossRef] [Google Scholar]
- Petruk, O., Beshley, V., Bocchino, F., Miceli, M., & Orlando, S. 2010a, MNRAS, in press [arXiv:1012.4586] [Google Scholar]
- Petruk, O., Orlando, S., Beshley, V., & Bocchino, F. 2010b, MNRAS, in press [arXiv:1012.4579] [Google Scholar]
- Reynolds, S. P. 1998, ApJ, 493, 375 [NASA ADS] [CrossRef] [Google Scholar]
- Reynolds, S. P. 2004, Adv. Space Res., 33, 461 [Google Scholar]
- Reynolds, S. P., & Gilmore, D. M. 1993, AJ, 106, 272 [NASA ADS] [CrossRef] [Google Scholar]
- Rothenflug, R., Ballet, J., Dubner, G., et al. 2004, A&A, 425, 121 [NASA ADS] [CrossRef] [EDP Sciences] [Google Scholar]
- Rybicki, G. B., & Lightman, A. P. 1985, Radiative processes in astrophysics. (Chichester – New York – Brisbane – Toronto – Singapore: John Wiley & Sons) [Google Scholar]
- Uchiyama, Y., Aharonian, F. A., & Takahashi, T. 2003, A&A, 400, 567 [NASA ADS] [CrossRef] [EDP Sciences] [Google Scholar]
- Wallis, G. 1959, in URSI Symp., 1, Paris Symposium on Radio Astronomy, ed. R. N. Bracewell, IAU Symp., 9, 595 [Google Scholar]
Appendix A: Calculation of integral in Eq. (14)
The function ℐ(a,t) in Eq. (14) is expressed as (Reynolds 1998)
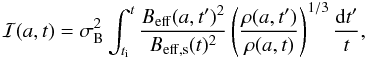 (A.1)where
 is the “effective”
magnetic field introduced to account for the energy losses of electrons due to
IC scatterings on the photons of CMB.
is the “effective”
magnetic field introduced to account for the energy losses of electrons due to
IC scatterings on the photons of CMB.
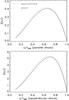 |
Fig. A.1 Self-similar approximate and exact radial profiles of the integral ℐ(a) when the ambient magnetic field is either parallel (upper panel) or perpendicular (lower panel) to the shock normal, and γ = 5/3. |
The integral given in Eq. (A.1) can take a prohibitively long time to compute because it requires the knowledge, with high enough time resolution, of the history of each parcel of gas inside the SNR since its shocking time. To reduce the computational cost, we calculate it approximately, by changing the integration of dt′ to dR′ = Vsh(t′)dt′, where R and Vsh are the shock position and velocity, respectively, and using some MHD properties of the fluid.
We calculate ℐ(a,t) using an analytic description of mass density and
magnetic field evolution inside the SNR, which expands through a non-uniform ISM and/or
ISMF. The continuity equation
ρo(a)a2da = ρ(a)r2dr
results in 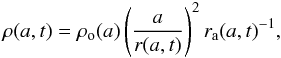 (A.2)where
ra(a,t) is the derivative of
r(a,t) with respect to a; the density
term in Eq. (A.1) is
(A.2)where
ra(a,t) is the derivative of
r(a,t) with respect to a; the density
term in Eq. (A.1) is
 (A.3)The magnetic
field in Eq. (A.1) can be expressed as
B(a,t)2 = B∥(a,t)2 + B⊥(a,t)2,
where B∥ and B⊥ are the
components of magnetic field parallel and perpendicular to the shock normal, respectively.
These two components follow the magnetic flux conservation
B∥dσS = constant, where
dσS is a surface element, and the flux-frozen condition
B⊥(r)rdr = constant:
(A.3)The magnetic
field in Eq. (A.1) can be expressed as
B(a,t)2 = B∥(a,t)2 + B⊥(a,t)2,
where B∥ and B⊥ are the
components of magnetic field parallel and perpendicular to the shock normal, respectively.
These two components follow the magnetic flux conservation
B∥dσS = constant, where
dσS is a surface element, and the flux-frozen condition
B⊥(r)rdr = constant:
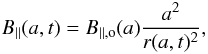 (A.4)
(A.4)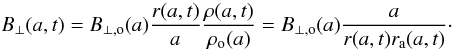 (A.5)Thus, the
magnetic field and the mass density in Eq. (A.1) can be expressed through the relation
r(a,t) between Eulerian and Lagrangian coordinates of
a parcel of gas and its derivative, ra(a,t).
Considering that r(a,t) and
ra(a,t) can be expressed in terms of the
dynamical characteristics of the shock (i.e. as r(a,R)
and ra(a,R)), the integral in Eq. (A.1) may be calculated as to be
(A.5)Thus, the
magnetic field and the mass density in Eq. (A.1) can be expressed through the relation
r(a,t) between Eulerian and Lagrangian coordinates of
a parcel of gas and its derivative, ra(a,t).
Considering that r(a,t) and
ra(a,t) can be expressed in terms of the
dynamical characteristics of the shock (i.e. as r(a,R)
and ra(a,R)), the integral in Eq. (A.1) may be calculated as to be 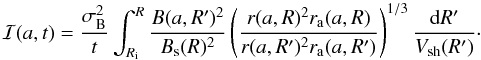 (A.6)The relation
r(a,R) is then approximated10, using the method described by Hnatyk & Petruk (1999),
(A.6)The relation
r(a,R) is then approximated10, using the method described by Hnatyk & Petruk (1999), 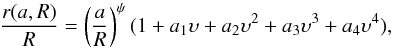 (A.7)where
υ = (R − a)/R
and ψ = (γ − 1)/γ.
The parameters a1, a2,
a3, and a4 are expressed as
(A.7)where
υ = (R − a)/R
and ψ = (γ − 1)/γ.
The parameters a1, a2,
a3, and a4 are expressed as
 (A.8)
(A.8) (A.9)
(A.9) (A.10)
 (A.11)where
 reflects the variation in r(a) close to the center of
the SNR. We adopt
reflects the variation in r(a) close to the center of
the SNR. We adopt  where
where  is given by the self-similar Sedov solution for a spherical shock (for details see
Sect. 4.3 and Appendix in Petruk 2000 and
references therein)
is given by the self-similar Sedov solution for a spherical shock (for details see
Sect. 4.3 and Appendix in Petruk 2000 and
references therein) ![Mathematical equation: \appendix \setcounter{section}{1} \begin{equation} {\cal{C}}\rs{A}= \left[ \frac{\gamma}{\gamma+1}\bar P(0)^{-1/\gamma} \right]^{1/3}, \end{equation}](/articles/aa/full_html/2011/02/aa15505-10/aa15505-10-eq291.png) (A.12)
(A.12) is the plasma pressure at the center of the remnant divided by its post-shock value
 (A.13)
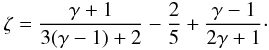 (A.14)Thus, we derive
 ,
,
 ,
and
,
and  .
The expressions for the derivatives
ra,s, raa,s,
and raaa,s in Eqs. A.8-A.10 as functions of R, Ṙ,
.
The expressions for the derivatives
ra,s, raa,s,
and raaa,s in Eqs. A.8-A.10 as functions of R, Ṙ,
 ,
and R(3) are given in Appendix A2 of Hnatyk & Petruk (1999).
,
and R(3) are given in Appendix A2 of Hnatyk & Petruk (1999).
Finally, we calculate Vsh(R) in Eq. (A.1) as well as
and R(3), using the Hnatyk
(1987) approximate analytical formula for the strong shock in a non-uniform
medium (see also Sect. 2.1 in Hnatyk & Petruk
1999).
The integral ℐ(a,t) can be calculated rather simply for a SNR expanding through a uniform ISM and ISMF. We therefore test our calculation of ℐ(a,t) by comparing the approximate values derived from Eq. (A.6) with the exact ones derived from the Sedov solution in the case of γ = 5/3. Figure A.1 compares the exact and approximate values
of ℐ(a,t) in the limits of parallel and perpendicular shocks. Note that the approximate values are very accurate at radii close to the shock front where most of the non-thermal emission originates.
All Tables
All Figures
|
Fig. 1 3D rendering of the mass density at t = 1000 yr for a remnant expanding through a uniform ISMF for three cases of γ = 5/3, 4/3, and 1.1 (runs Unif-g1, Unif-g2, and Unif-g3, see Table 1). |
| In the text | |
|
Fig. 2 Relevant angles describing the orientation of the ISMF and the gradient of ISMF strength with respect to the observer: φB is the angle between the (average) unperturbed ISMF and the LoS, and φ∇B is the angle between the gradient of the ISMF strength and the vertical line passing through the center of the remnant AV. |
| In the text | |
|
Fig. 3 Azimuthal profiles of the maximum energy Emax computed
in run Grad-BZ-g1 (solid line) and Grad-BX-g1 (dashed line) when the aspect angle is
φB = 90° and the gradient of magnetic field
strength lies in the plane of the sky
(φ∇B = 0° in run Grad-BZ-g1 and
φ∇B = 90° in run Grad-BX-g1). The shock is
parallel around 90° and 270° and perpendicular around
180° and 360°. In both models, the contrast
|
| In the text | |
|
Fig. 4 Maps of synchrotron radio (left), X-ray (center), and IC γ-ray (right) surface brightness (normalized to the maximum of each map) at t = 1 kyr synthesized from run Grad-BZ-g1, assuming randomized internal magnetic field. The relevant angles are φB = 90° and φ∇B = 0°. The figure shows the quasi-perpendicular (top), isotropic (middle), and quasi-parallel (bottom) particle injection models. The adiabatic index is γ = 5/3. The average ambient magnetic field is aligned along the horizontal axis; the gradient in magnetic field strength along the vertical axis. |
| In the text | |
|
Fig. 5 As in Fig. 4 for run Grad-BX-g1. Both the average ambient magnetic field and the gradient of magnetic field strength are along the horizontal axis. The relevant angles are φB = 90° and φ∇B = 90°. |
| In the text | |
|
Fig. 6 Azimuthal profiles of the synchrotron radio (red), X-ray (blue), and IC γ-ray (green) surface brightness synthesized from runs Grad-BZ-g1 (left; the relevant angles are φB = 90° and φ∇B = 0°) and Grad-BX-g1 (right; φB = 90° and φ∇B = 90°), assuming quasi-perpendicular (top), isotropic (middle), and quasi-parallel (bottom) injection models. The adiabatic index is γ = 5/3. The azimuth is measured counterclockwise from the north (see Figs. 4 and 5). The corresponding azimuthal profiles of Emax used to derive the curves of this figure are in Fig. 3. |
| In the text | |
|
Fig. 7 As in Fig. 4 for runs Grad-BZ-g1 (γ = 5/3), Grad-BZ-g2 (γ = 4/3), and Grad-BZ-g3 (γ = 1.1). The figure shows synchrotron radio (left panels), X-ray (center panels), and IC γ-ray (right panels), assuming either quasi-perpendicular (upper panels) or quasi-parallel (lower panels) injection models. Each panel shows only one half of the remnant, which is symmetric with respect to the vertical axis. |
| In the text | |
|
Fig. 8 As in Fig. 3 but for three different models of
Emax characterized by smooth variations with obliquity
angle. The azimuth is measured counterclockwise from the “north” of the remnant. The
shock is parallel around 90° and 270° and perpendicular around
180° and 360°. In model A (solid line), the contrast of
Emax is |
| In the text | |
|
Fig. 9 Azimuthal profiles of the synchrotron radio (red lines) and IC γ-ray surface brightness (green) synthesized from run Grad-BZ-g1 with quasi-perpendicular injection (top), and from run Grad-BX-g1 with quasi-parallel injection (bottom); the aspect angle is φB = 90°. The models of Emax adopted to synthesize the non-thermal emission are those shown in Fig. 8: model A (solid line), B (dotted), and C (dashed). |
| In the text | |
|
Fig. 10 Azimuthal intensity ratio Rmax (i.e. the ratio of the maxima of intensity of the two lobes around the shell) and azimuthal distance θD (i.e. the distance in degrees of the two maxima of intensity around the shell) versus the angle between ∇B and the vertical line passing through the remnant center φ∇B, for an aspect angle φB = 90°, and for the three models of Emax shown in Fig. 8. The run is Grad-BZ-g1. For isotropic injection, curves for Rmax in γ-rays and curves for θD in radio and X-rays are not shown, the values being Rmax = 1 and θD = 180°, respectively at all φ∇B. |
| In the text | |
|
Fig. 11 Maps of synchrotron radio (left), X-ray (center), and IC γ-ray (right) surface brightness synthesized from run Grad-BZ-g1, assuming quasi-perpendicular (top), and quasi-parallel (bottom) injection models. The adiabatic index is γ = 5/3. The maps have been synthesized adopting model B of Emax shown in Fig. 8. The relevant angles are φB = 45° and φ∇B = 45°. The angle between ⟨ B ⟩ and ∇| ⟨ B ⟩ | is 90°. |
| In the text | |
|
Fig. 12 As in Fig. 6, for the azimuthal profiles of the synchrotron X-ray (blue) and IC γ-ray (green) surface brightness synthesized from run Grad-BZ-g1, for Emax,∥ = 26 TeV (solid), 5 TeV (dotted), and 1 TeV (dashed). The surface brightness is synthesized deriving the maximum energy Emax as described in Sect. 4.2; its azimuthal profile is similar to that shown in Fig. 3 (solid line) but has a different value of Emax,∥. In all cases, Ef,∥ = 12 TeV. |
| In the text | |
|
Fig. A.1 Self-similar approximate and exact radial profiles of the integral ℐ(a) when the ambient magnetic field is either parallel (upper panel) or perpendicular (lower panel) to the shock normal, and γ = 5/3. |
| In the text | |
Current usage metrics show cumulative count of Article Views (full-text article views including HTML views, PDF and ePub downloads, according to the available data) and Abstracts Views on Vision4Press platform.
Data correspond to usage on the plateform after 2015. The current usage metrics is available 48-96 hours after online publication and is updated daily on week days.
Initial download of the metrics may take a while.