| Issue |
A&A
Volume 526, February 2011
|
|
|---|---|---|
| Article Number | A152 | |
| Number of page(s) | 13 | |
| Section | Interstellar and circumstellar matter | |
| DOI | https://doi.org/10.1051/0004-6361/200811142 | |
| Published online | 13 January 2011 | |
The 9.7 and 18 μm silicate absorption profiles towards diffuse and molecular cloud lines-of-sight
1
Astronomical Institute “Anton Pannekoek”, University of
Amsterdam,
Science Park 904,
1098 XH
Amsterdam,
The Netherlands
2
Astronomical Institute Utrecht, University of Utrecht,
PO Box 80000,
3508 TA
Utrecht, The
Netherlands
3
SETI Institute, 515 North Whisman Road, Mountain
View, CA
94043,
USA
4
SRON Netherlands Institute for Space Research,
Sorbonnelaan 2,
3584 CA
Utrecht, The
Netherlands
5
Jodrell Bank Centre for Astrophysics, Alan Turing Building, School
of Physics and Astronomy, The University of Manchester, Oxford Road, Manchester, M13
9PL, UK
6
Academia Sinica Institute of Astronomy and Astrophysics,
PO Box 23-141,
Taipei
10617,
Taiwan
e-mail: This email address is being protected from spambots. You need JavaScript enabled to view it.
7
IPAC, NASA Herschel Science Center, Mail Code 100-22, California
Institute of Technology, Pasadena, CA
91125,
USA
8
Physics and Astronomy Department, University of Western
Ontario, London ON
N6A 3K7,
Canada
9
Department of Physics and Astronomy, Institute for
Astronomy, K.U. Leuven,
Celestijnenlaan 200B, 3001
Leuven,
Belgium
10
Department of Astronomy, University of Maryland,
College Park, MD
20742,
USA
11
Cornell University, Astronomy Department,
108 Space Sciences Bldg.,
Ithaca, NY
14853-6801,
USA
12
Leiden Observatory, PO Box 9513, 2300 RA
Leiden, The
Netherlands
Received: 13 October 2008
Accepted: 9 December 2010
Abstract
Context. Studying the composition of dust in the interstellar medium (ISM) is crucial for understanding the cycle of dust in our galaxy.
Aims. The mid-infrared spectral signature of amorphous silicates, the most abundant dust species in the ISM, is studied in different lines-of-sight through the Galactic plane, thus probing different conditions in the ISM.
Methods. We have analysed ten spectra from the Spitzer archive, of which six lines-of-sight probe diffuse interstellar medium material and four probe molecular cloud material. The 9.7 μm silicate absorption features in seven of these spectra were studied in terms of their shape and strength. In addition, the shape of the 18 μm silicate absorption features in four of the diffuse sightline spectra were analysed.
Results. The 9.7 μm silicate absorption bands in the diffuse sightlines show a strikingly similar band shape. This is also the case for all but one of the 18 μm silicate absorption bands observed in diffuse lines-of-sight. The 9.7 μm bands in the four molecular sightlines show small variations in shape. These modest variations in the band shape are inconsistent with the interpretation of the large variations in τ9.7/E(J − K) between diffuse and molecular sightlines in terms of silicate grain growth. Instead, we suggest that the large changes in τ9.7/E(J − K) must be due to changes in E(J − K).
Key words: dust, extinction / evolution / techniques: spectroscopic / infrared: ISM / ISM: clouds
© ESO, 2011
1. Introduction
The composition of dust in the interstellar medium (ISM) is a result of a variety of different processes. First of all, dust is formed in the circumstellar environments of evolved stars, for example asymptotic giant branch (AGB) stars. Depending on their stage of evolution these stars produce either oxygen-rich (e.g. silicates and oxides) or carbon-rich dust (e.g. amorphous carbon, graphite and silicon carbide). The newly-formed stardust enters the ISM through stellar winds or supernova explosions. This material is rapidly mixed with other gas and dust in the ISM, where it is processed by a number of mechanisms such as shock waves driven by supernova explosions, high energy radiation and high velocity collisions amongst grains. Finally, during the formation of a new star and planetary system the dust is further processed. Therefore, the composition of dust in the ISM is a reflection of the constant formation, mixing, processing and destruction of different dust species. Studying the composition of interstellar dust and its spatial variations throughout the galaxy is crucial for a better understanding of the material from which, for instance, our solar system was made.
A good way to study the composition of interstellar dust is by means of infrared spectroscopy. The light from the bright background star is attenuated by the interstellar dust in front of it. This extinction is wavelength dependent and is caused by both scattering and absorption by the dust grains. If the intrinsic, unreddened spectrum of the background star is known, the dust extinction as a function of wavelength can be derived.
The most abundant dust species in the ISM are amorphous silicates, which cause two prominent absorption features at about 9.7 and 18 μm (e.g. Stein & Gillett 1971; Rieke 1974; Gillett et al. 1975; McCarthy et al. 1980; Roche 1989; Bowey et al. 1998; Kemper et al. 2004; Chiar & Tielens 2006; Min et al. 2007). In this article, we discuss both the 9.7 μm and 18 μm bands. Interstellar silicate dust is mostly a mixture of amorphous silicates with an olivine (O/Si = 4) or pyroxene (O/Si = 3) composition (e.g. Day 1974; Gillett et al. 1975; Kemper et al. 2004; Min et al. 2007; Chiar et al. 2007). Although olivines and pyroxenes are by definition crystalline silicates, in this paper we also use these names for amorphous silicates with the same stoichiometric composition. From previous studies we know that the composition of interstellar silicates can vary, depending on the location in the ISM. For example Demyk et al. (1999, 2000, 2001) show that the dust around protostars has a higher O/Si ratio than the newly-formed dust observed around AGB stars.
Chiar et al. (2007) compared the strength of the 9.7 μm silicate absorption feature with the near-infrared colour excess E(J − K) in both diffuse and molecular sightlines1. The 9.7 μm silicate feature, τ9.7, is due to the Si-O stretching mode in the silicates, and its strength depends on the silicate optical depth, while the overall extinction in the visible through near-infrared is probably due to a combination of carbonaceous material (e.g. amorphous carbon; Draine & Lee 1984; Compiègne et al. 2011) and iron, the latter either in metallic form (Kemper et al. 2002) or as a cationic part of the silicate lattice, the so-called dirty silicates (Jones & Merrill 1976). For diffuse sightlines there is a tight linear correlation between τ9.7 and the visual extinction (AV) (Roche & Aitken 1984; Whittet 2003). A similar correlation exists between τ9.7 and the near-infrared extinction represented by the J − K colour excess, E(J − K) (Chiar et al. 2007). However, for the molecular sightlines the diffuse ISM correlation fails (Whittet et al. 1988; Chiar et al. 2007), indicating that something happens to the dust grains when they enter a molecular cloud. Molecular sightlines, in general, probe greater interstellar densities than diffuse sightlines and thus, the observed variations are most likely density related.
An obvious explanation is grain growth via coagulation taking place in molecular clouds. Indeed, this causes a decrease in the strength of the 9.7 μm silicate feature (see Sect. 4), but grain growth also has an effect on the near-infrared extinction (i.e. E(J − K)). Moreover, grain growth alters the shape of the 9.7 μm silicate feature drastically (e.g. Bouwman et al. 2001). Therefore, an accurate measurement of the band shape of the 9.7 μm silicate band in diffuse and molecular lines-of-sight can set interesting limits on the importance of grain growth as an explanation for the large changes in extinction detected so far.
Overview of the selected spectra from the Spitzer archive.
In order to study the spectral signature of interstellar silicates in both diffuse and molecular sightlines, we have analysed ten low-resolution spectra with high S/N ratio, taken with the Spitzer space telescope. The high quality of the spectra allows an accurate comparison of band shapes along different lines-of-sight at a variety of Galactic longitudes. Of these spectra, seven were used to analyse the shape and strength of the 9.7 μm silicate absorption feature and four were used to analyse the 18 μm silicate absorption profile. Only a few earlier studies have analysed the interstellar 18 μm band, and always in conjunction with the 9.7 μm band (e.g. Demyk et al. 1999; Chiar & Tielens 2006).
This paper is organised as follows: Sect. 2 describes the sample selection and the observations. In Sect. 3 the data analysis is described and the results are presented. These results are compared with model calculations in Sect. 4, and in Sect. 5 we discuss the implications of our results for grain processing in molecular clouds. Finally, the conclusions are summarised in Sect. 6.
2. Observations
2.1. Sample selection
Our sample consists of a selection of low-resolution IRS (InfraRed Spectrograph; Houck et al. 2004) Spitzer spectra from the Spitzer programs with Program IDs: 139, 172–179, 3616, 20294, 3336, 20604. These programs have, amongst other things, observed background sources with large amounts of foreground dust and were thus relevant for this study. The background nature of the dense cloud sources was based on their placement in colour-colour diagrams which separated out stars reddened by interstellar, rather than circumstellar dust. For the diffuse ISM lines-of-sight, the background nature is confirmed via their strong reddening and optical spectra that confirm their spectral and luminosity class (Rawlings et al. 2000).
A first selection was made based on the presence and strength of the 9.7 μm and 18 μm silicate absorption features and the signal to noise ratio (SNR) of the spectra. From the resulting list 10 spectra were selected keeping in mind the following science goals: (1) Investigating the optical depth at 9.7 μm, τ9.7, versus the infrared colour excess, E(J − K); (2) Comparing the shape of the 9.7 μm silicate features through different sightlines; (3) Comparing the shape of the 18 μm silicate features through different sightlines.
To reach the first two science goals the 9.7 μm silicate feature needs to be extracted from the spectrum. However, many of the spectra of background stars in the Spitzer archive show an SiO gas phase fundamental stretch band from about 8 to 11 μm coming from the intrinsic spectrum of the observed background star (see Fig. 1). This photospheric gas phase SiO band is typical for late type K and M giants and because these are intrinsically bright stars, they are good candidates for background sources.
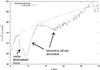 |
Fig. 1 Spectrum of an M-giant taken with the Spitzer Space Telescope (Chiar, unpublished Spitzer data). The extinction towards this star is AV ~ 10 mag. Plotted is the observed flux (in Jy) of the star multiplied by the wavelength (in μm) squared (Fν × λ2) versus the wavelength (λ). This choice implies that a horizontal line is expected for an unreddened photosphere. The two most prominent absorption bands at 9.7 and 18 μm are due to interstellar silicate absorption. The smaller band at 8 μm is caused by gas phase SiO in the photosphere of the M-giant itself and clearly affects the 9.7 μm silicate feature, thus hampering the detailed analysis of the shape of the interstellar silicate band. |
Since the shape of the SiO band depends on the spectral type of the background source, which in most cases is not known, accurately correcting for this band is not easy (see also Sect. 3.3.2). The profile of the SiO fundamental mode is highly sensitive to the temperature and the structure of the stellar atmosphere, requiring modelling beyond that of a classical atmosphere (e.g. Tsuji et al. 1994). Therefore, seven spectra were selected that show no or very little SiO absorption. Of these seven spectra three are diffuse sightlines and four are molecular sightlines. All but one of these spectra were not suited to analyse the 18 μm silicate absorption feature, either because the spectrum did not span the full spectral range or the quality of the long wavelength part of the spectrum was not high enough to reliably extract the 18 μm feature. Therefore, we have selected three more spectra from the Spitzer archive to analyse the 18 μm silicate absorption feature, which in turn were not suited for the analysis of the 9.7 μm feature, because they show strong photospheric gas phase SiO bands (see Fig. 1). Unfortunately, we did not find any molecular sightline spectra in the Spitzer archive that span the long wavelength part of the Spitzer spectral range and therefore, we could only analyse the 18 μm silicate absorption feature in four diffuse sightlines. An overview of the selected spectra is given in Table 1.
2.2. Data reduction
Basic calibrated data (BCD) were obtained from the selected observations using the Spitzer data reduction pipeline version S15 and post-BCD 1D spectra were created by carrying out background subtraction. The resulting spectra are shown in Figs. 2 and 3. We plot these as (Fν × λ2) versus λ so that an unreddened photosphere without photospheric absorption bands shows up as a horizontal line, making it easier to recognise the effect of extinction on the spectral slope.
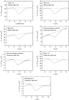 |
Fig. 2 Flux multiplied by wavelength squared spectra of the sightlines used for the 9.7 μm silicate feature study together with the continuum (see main text). |
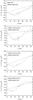 |
Fig. 3 Flux multiplied by wavelength squared spectra of the sightlines used for the 18 μm silicate feature study together with the continuum (see main text). Error bars: 2, 3, 3 and 5 Jy × μm2 for StRS354, G323, G343, and G345 respectively. |
2.3. The spectra
The 9.7 μm silicate feature is present in all spectra (Figs. 2 and 4). The photospheric gas phase SiO band is not apparent in the spectra, but for only three sources we can be sure that it is indeed not present, since they are early type supergiants (see Table 1). For the other sources, however, a very weak SiO band might still be present.
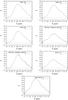 |
Fig. 4 The extracted 9.7 μm optical depth profiles. |
Ice features are reported to be absent from the Spitzer spectra of diffuse sightlines (van Dishoeck 2004; Boogert & Ehrenfreund 2004). Water ice, for instance, has a feature at about 6 μm and CH3OH ice together with NH ice has a feature at about 6.85 μm (e.g. Boogert et al. 2008), which we do not detect in the diffuse sightline spectra in this sample. This is as expected, since the conditions in the diffuse ISM are not suitable for the formation of ices. Ice features are also not detected in the spectra towards sightlines with AV ≲ 10, although the 6.0 μm water ice resonance appears only as a weak absorption towards sightlines with higher column densities (AV ≳ 10). Therefore, the 9.7 μm silicate features are probably also not strongly affected by ice bands, such as the 12 μm water ice librational band. Our sightlines probably do not sample the densest parts of the molecular clouds, where ices are expected to be abundant.
The spectra in Fig. 3 show the 18 μm silicate feature. In this spectral range the signal to noise level of the data is rapidly decreasing due to the lower flux levels. We estimate the S/N of the spectra to be in the range 15 to 25. This affects the accuracy of the extracted band profiles.
3. Data analysis and results
3.1. Extraction of the 9.7 and 18 μm silicate absorption features
The total extinction by interstellar dust can be divided into a “continuum” component (i.e. smoothly varying with wavelength), and the silicate absorption features, the shape and strength of which we wish to extract. To do this a continuum needs to be specified, which represents the intrinsic spectrum of the background star reddened by foreground dust. We assume the intrinsic spectrum of the background star to be approximately a Rayleigh-Jeans tail, described by Fν ∝ λ-2, while the featureless dust extinction can be approximated by a power-law with wavelength as well. The resulting continuum, against which the spectral features are seen in absorption, is thus represented by a power-law. This approximation is good enough for our purposes, since the widths of 9.7 μm and 18 μm silicate absorption features each cover a relatively small wavelength range (~4 and ~13 μm, respectively).
The results for τ9.7 and E(J − K) measured for the sources in our sample.
The continuum for the 9.7 μm silicate feature is defined by the flux levels at 7.5 and 12.3 μm, where the first continuum point (at 7.5 μm) is chosen because it does not overlap with potential photospheric gas phase SiO bands that might be present in the spectra. The resulting slopes are listed in the last column of Table 2. The continuum for the 18 μm silicate feature is determined separately and defined by the values at 14.2 and 27.0 μm, thus making sure both continuum points are within the wavelength range of the long wavelength module of Spitzer.
Subsequently, the optical depth profiles are calculated using:  (1)where Fν,obs is the observed flux and Fν,cont is the flux of the continuum. The resulting optical depth profiles are shown in Figs. 4 and 5, and the peak values for the 9.7 μm feature are also listed in Table 2. A weak correlation exists between τ9.7 and the power-law index of the fitted continuum, with a correlation coefficient of −0.59.
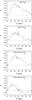 |
Fig. 5 The extracted 18 μm optical depth profiles. |
The choice of the continuum is important because it affects the shape of the extracted band profile and the subsequent analysis. We chose to use a systematic approach by always using the same wavelengths at which the continuum is defined. We note that the three sources with the highest extinction in our sample (all are molecular sightlines) show such a sharp drop in flux shortward of 8 μm that this falls below the extrapolated continuum. We have investigated the impact of this choice on our analysis by choosing a different continuum for two objects, StRs 164 and SSTc2d_J163346.2−242753 in the 9.7 μm region. The strength of the band changes by at most 10%, when normalised to unity at a wavelength of 10.5 μm, while the shape remains virtually unaffected. This is shown for SSTc2d_J163346.2−242753 in Fig. 6. We conclude that this different choice of continuum has a minor effect on the outcome of our analysis.
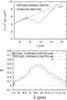 |
Fig. 6 The effect of choosing a different continuum on the shape of the 9.7 μm silicate band for the molecular sightline source SSTc2dJ1633462−242753. The rising continuum in the 18 μm wavelength range is due to the “continuum extinction” which decreases with increasing wavelength. upper: two choices of the continuum normalisation; lower: comparison of the old and new band shape. |
3.2. τ9.7 versus E(J-K) relationship
Chiar et al. (2007) investigated the relationship between the strength of the 9.7 μm silicate feature, τ9.7, and the near-infrared colour excess, E(J − K). For diffuse sightlines there is a tight linear correlation between these two parameters with τ9.7/E(J − K) = 0.34 (Roche & Aitken 1984; Whittet 2003), but for the molecular sightlines this correlation fails (Chiar et al. 2007; Whittet et al. 1988). The extinction law within the NIR wavelength regime appears to remain unchanged with increasing column density (e.g. Román-Zúñiga et al. 2007).
To compare the sources in our sample to these previous results, τ9.7 was determined from the 9.7 μm silicate features in our sample. An estimation of the error on these measurements was done by taking different reasonable continua and determining the effect on τ9.7.
The E(J − K) colour excesses were determined by taking the (J − K) colour observed by 2MASS (Skrutskie et al. 2006) and subtracting the intrinsic (J − K) colour from Koornneef (1983). If the spectral type of the source is unknown, we assume it is a G0–M4 giant, with an average intrinsic (J − K) colour of about 0.81 mag (consistent with Chiar et al. 2007). The errors were estimated by taking into account the uncertainty in the spectral type and thus the intrinsic (J − K) colour. The results are listed in Table 2 and Fig. 7 shows these results together with the Galactic centre line-of-sight and the results from Chiar et al. (2007) for the diffuse and molecular sightlines separately.
Our measurements are in agreement with the results found by Chiar et al. (2007) as can be seen in Fig. 7. Please note, that two of our measurements are for for sightlines also in the sample of Chiar et al. (2007), namely: Elias 3-13 and [SVS76] Ser 9 and we have replaced their measurements by ours in Fig. 7. The two measurements for [SVS76] Ser 9 agree within the uncertainty. For Elias 3-13 the measurement was done by Whittet et al. (1988) from a relatively noisy, ground based spectrum, so the error on their measured τ9.7 is quite large (approximately 0.08 in τ). Moreover, they did not correct for photospheric gas phase SiO.
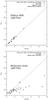 |
Fig. 7 The measured optical depth at 9.7 μm, τ9.7, as a function of the J − K colour excess, E(J − K), for diffuse sightlines (upper panel) and molecular sightlines (lower panel). The dots represent data from Chiar et al. (2007, and references therein) and the crosses represent our measurements. The dashed line is the correlation between τ9.7 and E(J − K) found for the diffuse ISM (Chiar et al. 2007). The source indicated by the arrow is SSTc2d_J182852.7+002824. This source is remarkable, since it is the only source with E(J − K) > 2 that is still in agreement with the diffuse ISM correlation, probably due to the effects of ices on the estimated band strength. |
We also included the Galactic centre line-of-sight in Fig. 7 (upper panel). For this we used τ9.7 = 3.25 (Kemper et al. 2004; Min et al. 2007) and τ9.7/E(J − K) = 0.7 (Roche & Aitken 1985). The Galactic centre line-of-sight is exceptional, since it is the only one for which τ9.7 versus E(J − K) lies above the diffuse ISM correlation. This sightline probes the local ISM as well as the inner parts of our Galaxy in contrast to the other sightlines which only probe the local ISM. Since there are relatively fewer C-rich stars (as compared to O-rich stars) around the Galactic centre than in the outer regions of our Galaxy, the relative abundance of carbon-rich dust is probably also lower around the Galactic centre (Roche & Aitken 1985). This would explain the relatively high τ9.7/E(J − K) ratio for this particular line-of-sight, since carbon rich dust is a major component of the near-infrared extinction.
Furthermore, there is one molecular cloud source (indicated by the arrow in Fig. 7) that seems to agree very well with the diffuse ISM correlation despite the high value for E(J − K), while other molecular sightlines with E(J − K) ≳ 2 deviate from this correlation. This is SSTc2d_J182852.7+002824, which was observed with Spitzer in the c2d legacy program (Evans et al. 2003). Its reduced spectrum is shown in Fig. 8. Prominent ice features are present at about 6 and 6.85 μm caused by H2O and CH3OH + NH ice respectively (Boogert & Ehrenfreund 2004; van Dishoeck 2004). The latter also has a feature at about 9.7 μm, which increases the depth of the 9.7 μm silicate feature leading to an overestimate of the absorption due to silicates. Therefore, Chiar et al. (2007) apparently overestimated the absorption due to silicates. Correcting for ice absorption would move the τ9.7 point downward in Fig. 7, which is in agreement with the results for the other dense cloud sources. We note the large differences in the strength of the ice bands between the spectrum in Fig. 8 and the four molecular cloud sightlines shown in Fig. 2, for similar values of E(J − K). Apparently, the observed changes in the τ9.7 versus E(J − K) relationship are not related to ice formation.
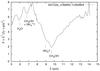 |
Fig. 8 The spectrum observed towards SSTc2d_J182852.7+002824. Absorption features caused by ices on top of the silicate feature are indicated. The absorption feature caused by CH3OH ice at about 9.7 μm makes the silicate feature seem deeper than it really is. Consequently, the strength of the 9.7 μm silicate feature is overestimated. |
3.3. Comparison of the 9.7 μm silicate profiles
The shape of the 9.7 μm silicate absorption features in our sample (see Fig. 4) are compared and discussed for the diffuse and molecular sightlines separately below. Throughout this article we use the feature determined for the Galactic centre by Kemper et al. (2004) as a reference.
3.3.1. Diffuse sightlines
Figure 9 shows the extracted features for the diffuse sightlines in our sample together with the Galactic centre feature from Kemper et al. (2004). All features are normalised to unity at 10.5 μm, because the contribution of any photospheric gas phase SiO bands that might be present in the spectra is negligible from about 10.5 μm onwards. This effect is not important for the diffuse sightlines, since the background sources are known to be early type supergiants without photospheric gas phase SiO, but it matters for the molecular sightlines which we discuss later.
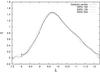 |
Fig. 9 The 9.7 μm silicate features in terms of optical depth for the diffuse sightlines together with the feature observed towards the Galactic centre (Kemper et al. 2004). The features are normalised to unity at 10.5 μm. |
From Fig. 9 we conclude that the profile of the 9.7 μm silicate features in different diffuse sightlines is very similar. In Fig. 10 the difference between our observed silicate features and the Galactic centre feature (Kemper et al. 2004) is shown. For both StRS 164 and StRS 354 there are no strong variations present that exceed the noise. Only StRS 136 shows a small difference with the Galactic centre feature between about 8 and 9.7 μm, but this never exceeds 0.15 in the normalised τ. The two small absorption features at about 8.7 and 11.3 μm in Fig. 10 (upper panel) cannot be trusted, because PAHs (polycyclic aromatic hydrocarbons) have prominent features at those wavelengths and the background subtraction probably was not accurate enough in this case.
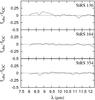 |
Fig. 10 The difference between the observed features in the diffuse sightlines in our sample and the Galactic centre feature derived by Kemper et al. (2004). |
In conclusion, there are only small differences in the shape of the 9.7 μm silicate feature in the diffuse sightlines and the Galactic centre feature, even though these sightlines are separated by up to 77 degrees in Galactic longitude (see Table 1).
3.3.2. Molecular sightlines
Figure 11 shows the extracted features for the molecular sightlines in our sample. All features are normalised to unity at 10.5 μm as was done for the diffuse sightlines. From an eyeball comparison of the 9.7 μm silicate features in Fig. 11 we conclude that these features in molecular sightlines differ substantially from the absorption feature observed towards the Galactic centre. The slopes of the long wavelength side of the features (i.e. λ > 10.5 μm) are the same as that of the Galactic centre. If we assume that the profiles are indeed the same from 10.5 μm onward, then the molecular sightlines show excess absorption between 7.5 and 10.5 μm. Alternatively, if we were to normalise the 9.7 μm silicate features at their peak, the difference between them can be interpreted as a shift towards shorter wavelengths as compared to the diffuse 9.7 μm silicate features. Also, the long wavelength part of the features show less overlap than when they are normalised at 10.5 μm.
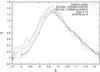 |
Fig. 11 The 9.7 μm silicate features in terms of optical depth for the molecular sightlines together with the feature observed towards the Galactic centre (Kemper et al. 2004). The features are normalised to unity at 10.5 μm. |
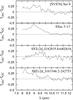 |
Fig. 12 The difference between the observed features in the molecular sightlines in our sample and the Galactic centre feature derived by Kemper et al. (2004). (The Elias 3-13 spectrum has not been corrected for the photospheric gas phase SiO band in this figure) |
In Fig. 12 the difference is plotted between the observed features in the molecular sightlines in our sample and the Galactic centre feature. The observed difference between the 9.7 μm silicate profiles in molecular sightlines and the Galactic centre sightline can be caused by three effects: (i) The presence of a photospheric gas phase SiO band in the spectrum of the background star. (ii) The presence of ices along the line-of-sight. (iii) A change in the dust properties of the amorphous silicates. We discuss these three effects separately below:
-
(i)
Photospheric gas phase SiO band: since the spectral type for 3of the four sources is unknown, there might be a smallphotospheric gas phase SiO band in the spectra. SiO is the mostprobable source of photospheric spectral structure in cool stars inthe 8 μm wavelength range. Indeed, Elias 3-13 isknown to be a K2 giant and, hence, the spectrum of this source has aweak SiO band. Careful inspection of the9.7 μm features in Fig. 4 shows that the photospheric gas phase SiO band is indeed present in all but one of the molecular sightlines as a blue shoulder between 7.5 and about 8.5 μm. Only for SSTc2d_J182835.8+002616 the SiO band seems to be absent, since τ is zero at about 8 μm, where the SiO band peaks. So for this source, the observed difference with the Galactic centre feature cannot be explained by the presence of a gas phase SiO band in the intrinsic spectrum of the background star. However, Fig. 12 shows that the difference in the shape of the 9.7 μm silicate features, in most cases, cannot be explained only by SiO. This is because gas phase SiO normally peaks at about 8 μm, whereas Fig. 12 shows features that peak at about 9–9.5 μm, except for SSTc2d_J163346.2−242753. Since the spectral type of Elias 3-13 is known we were able to extract the photospheric gas phase SiO band for this source using a model atmosphere spectrum calculated by one of us (Decin et al. 1997, 2004) based on MARCS models (Gustafsson et al. 1975, 2008) (see Fig. 13, upper panel).
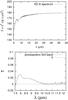
Fig. 13 Upper: model atmosphere spectrum of a K2 giant calculated Decin et al. (1997, 2004). lower: the corresponding photospheric gas phase SiO band in terms of optical depth. Longwards of 9 μm the absorption is dominated by OH.
The photospheric gas phase SiO band in terms of optical depth was extracted from this model spectrum by taking a power-law continuum from 7.4 to 12.3 μm and using equation 1 (see Fig. 13, lower panel). The resulting optical depth profile is mostly due to SiO, but a contribution from OH is present at λ ≳ 9 μm, and OH absorption dominates at ≳10 μm. Subsequently, we subtracted this optical depth profile from the observed 9.7 μm feature. The correction never exceeds 0.03 in τ. The result is shown in Fig. 14. Correcting for SiO in this spectrum is not sufficient to explain the difference in the shape of the 9.7 μm silicate feature between Elias 3-13 and the Galactic centre.
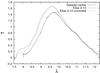
Fig. 14 The 9.7 μm silicate feature observed towards Elias 3-13 (dashed line) together with this feature corrected for photospheric gas phase SiO (dotted line) using a model spectrum calculated by Decin et al. (1997, 2004). The Galactic centre feature (Kemper et al. 2004) is also plotted (solid line) and is representative for diffuse sightlines.
-
(ii)
Ices: different types of ices could affect the shape of the 9.7 μm silicate feature in molecular sightlines (Boogert & Ehrenfreund 2004; van Dishoeck 2004). Indeed, McClure (2009) proposed ice growth as cause for the change in extinction law between diffuse and molecular sightlines. For instance, CH3OH ice has a strong feature at about 9.7 μm (see also Fig. 8). Since the spectra show no strong absorption bands at about 6 μm and 6.85 μm, caused by water ice and CH3OH ice together with NH
ice respectively (see Fig. 2), we do not expect the 9.7 μm silicate features to be affected much by ice features. For the same reason we do not expect a strong H2O libration band at about 12 μm (Boogert et al. 2008). Moreover, the long wavelength side of the 9.7 μm silicate features (from about 10.5 μm onward) in our molecular sightlines is very similar to that of the diffuse sightlines indicating that there is indeed no H2O libration band present in any of the spectra. In Fig. 12, only SSTc2d_J182835.8+002616 shows a feature that peaks at about 9.7 μm, that may be compatible with the CH3OH ice band. Figure 15 shows the difference between the 9.7 μm feature of SSTc2d_J182835.8+002616 and the Galactic centre feature together with the absorption profile of a mixture of CH3OH and NH3 ice. In this case the observed difference could be explained by the presence of ices. On the other hand the spectrum of SSTc2d_J182835.8+002616 does not show an absorption band at 6.85 μm, caused by CH3OH ice together with NH ice. 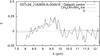
Fig. 15 The difference between the observed 9.7 μm feature of SSTc2d_J182835.8+002616 and the Galactic centre feature derived by Kemper et al. (2004) (solid line) together with the absorption profile of a mixture of CH3OH and CH3 ice (dashed line).
For Elias 3-13, however, the difference between its 9.7 μm feature and the Galactic centre feature peaks at about 9 μm even if we correct for the photospheric gas phase SiO band. Moreover, it is a relatively broad feature covering about 2–3 μm in wavelength. There are, to the best of our knowledge, no ice species that produce such an absorption profile.
-
(iii)
Dust properties of the amorphous silicates: the shape of the 9.7 μm silicate absorption feature depends on the dust properties of the amorphous silicates, such as the size, shape and chemical composition of the dust grains. The observed increase in absorption between 7.5 and 10.5 μm (i.e. the short wavelength side of the feature) could, for instance, be the result of a decrease in the O/Si ratio in the amorphous silicates, going from an olivine to pyroxene composition (Ossenkopf et al. 1992; Speck et al. 2008). In Sect. 4 we return to this point. From the discussion above we conclude that it is not likely that gas-phase SiO absorption or ice absorption are the dominant cause of the difference in the band shape of the 9.7 μm silicate absorption band in diffuse and molecular lines-of-sight. Changes in the dust composition may be important in explaining the difference.
3.4. Comparison of the 18 μm silicate profiles
The 18 μm silicate absorption profiles are extracted for four diffuse sightlines (see Sect. 3.1). Because we could analyse the 9.7 μm feature in only one of these sightlines, it is not possible for us to use the feature strength ratio between the two features as a tool to put constraints on grain properties, such as composition and size (e.g. Ossenkopf et al. 1992). Figure 16 shows the 18 μm profiles together with a modelled Galactic centre 18 μm profile, based on the grain properties derived from the 9.7 μm fit in the same sightline (Min et al. 2007). The features are normalised to unity at their peak.
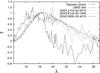 |
Fig. 16 The 18 μm silicate absorption features observed in four diffuse sightlines together with the modelled profile based on the 9.7 μm fit of the Galactic centre sightline (Min et al. 2007). The features are normalised at their peak. Noise levels vary with wavelength and are typically 0.03 in τ at the shortest wavelengths, and increase to 0.10 in τ for the longest wavelength. The anomalous feature seen towards G345.3650 − 00.4015 is plotted with a thicker line than the features in the other sightlines. |
The 18 μm silicate profile of G345.3650−00.4015 is the only one that does not agree with the extrapolated Galactic centre fit within the noise and we have found no reasonable explanation for this particular profile being so different. For this sightline, we considered a range of olivine and pyroxene silicates with different Mg/Fe ratios, as well as Na- and Al-containing silicates. For all these species we considered spherical and irregularly-shaped particles, none of which reproduce the required blueness of this anomalous feature. Although we suspect that a compositional effect causes the shift in wavelength for this feature, the carrier remains unidentified. However, the 18 μm features in the other sightlines are very similar to that of the extrapolated Galactic centre fit and Min et al. (2007) show that this profile is also consistent with the 18 μm silicate absorption feature observed towards WR 98a. So, except for one source, the 18 μm silicate absorption features in different diffuse sightlines are very similar and the extrapolated Galactic centre fit seems representative for the diffuse ISM.
3.5. Summary of observed trends
For lines-of-sight passing through the diffuse ISM, there is a tight linear correlation between the strength of the 9.7 μm silicate absorption feature, τ9.7, and the near-infrared colour excess, E(J − K). Moreover, the shape of the observed 9.7 μm silicate features in different diffuse sightlines and the Galactic centre feature are strikingly similar (see Fig. 9). Only StRS 136 shows a small difference with the Galactic centre feature between about 8 and 9.7 μm of up to 0.13 in τ. It could be that this line-of-sight probes not only diffuse material but also a small amount of molecular material. If this is indeed the case, then the Galactic centre feature is representative for the diffuse ISM even though this feature was extracted using a very different method (Kemper et al. 2004) than applied here. This is remarkable, since the Galactic centre line-of-sight passes through not only diffuse material, but also some molecular cloud material (Roche 1988; Whittet 2003).
Our analysis of the 18 μm silicate absorption feature shows the same similarity between diffuse sightlines and the Galactic centre. Except for one source (i.e. MSXLOS17) the 18 μm profiles are consistent with the extrapolated Galactic centre fit from Min et al. (2007).
We conclude that the diffuse ISM silicates probed by the diffuse lines-of-sight studied in this paper and those sampled towards the Galactic centre are remarkably similar. Only the τ9.7/E(J − K) of the Galactic centre sightline deviates from the general behaviour.
A different picture appears when looking at lines-of-sight passing through molecular cloud material. The τ9.7 versus E(J − K) relationship breaks down drastically and we observe small variations in the shape of the 9.7 μm silicate absorption features. These small changes may be attributed to differences in dust properties, but other effects may also play a role (see above). Nevertheless, the observations show that the dust properties in molecular clouds must be different from those in the diffuse ISM.
To determine whether the change in the τ9.7 versus E(J − K) relationship is correlated to the change in the shape of the 9.7 μm silicate feature, we have measured the 9.7 μm silicate band shape of three sources in Fig. 7 with a wide range in τ9.7/E(J − K). However, we found that better quality data than available to us in this study are needed to come to firm conclusions about such a possible relation.
In the following we consider possible explanations for the observed variations in both the τ9.7 versus E(J − K) diagram and the shape of the 9.7 μm silicate profile. We model the τ9.7 versus E(J − K) relationship assuming a range of dust properties; then we confront these models with the observations.
4. Model calculations
To investigate how the τ9.7 versus E(J − K) relationship and the 9.7 μm silicate absorption profile depend on different dust properties we start with the best fit found by Min et al. (2007) for the Galactic centre feature. This fit uses an MRN (Mathis et al. 1977) size distribution (i.e. n(a) ∝ a-3.5), between grain sizes of 0.005 and 0.25 μm. The shape of the particles is represented by a distribution of hollow spheres (DHS), where fmax represents the size of the cavities in the grains and is a measure for the irregularity of the particles, and a larger fmax indicates that the grains are more porous and/or irregular (Min et al. 2005). A DHS model with fmax = 1 simulates highly irregular particles, while a DHS model with fmax = 0.1 simulates almost spherical particles. The best fit model from Min et al. (2007) uses fmax = 0.7. The chemical composition of this best fit model is given in Table 3.
The chemical composition in terms of mass fraction in percent for the best fit model of the Galactic centre feature by Min et al. (2007).
By changing the parameters in this model we are able to investigate the effects of grain size, grain shape and chemical composition of different types of silicates and silicon carbide on the 9.7 μm silicate absorption profiles.
To model the relationship between τ9.7 and E(J − K) we have included a fraction of graphite (C) in such a way that for the Galactic centre the diffuse ISM correlation (Chiar et al. 2007) is obtained. Note that this correlation is not valid for the Galactic centre sightline in particular (see Fig. 7), but the 9.7 μm silicate absorption profile is representative for the diffuse ISM and thus we consider it as a typical diffuse sightline. A mass fraction of about 31% of graphite was needed to meet this requirement. Assuming a solar abundance of carbon, this requires about 65% of the carbon atoms to be in the form of graphite, which is a relatively high percentage. This number should be treated as an upper limit; when metallic iron or dirty silicates are present in the diffuse ISM, they contribute to the NIR opacity, and thus decrease the contribution from graphite.
To verify if this model also reproduces the standard extinction law at optical wavelengths the corresponding value for RV = AV/E(B − V) was calculated. The result was 3.28, which is close to the value for the diffuse ISM of about 3.1 (Schultz & Wiemer 1975; Sneden et al. 1978). We consider the following dust properties and investigate their effect on the τ9.7 versus E(J − K) relationship: (1) The size distribution of the dust grains; (2) The shape distribution of the dust grains; (3) The chemical composition of the dust grains. In the following we consider graphites and silicates as separate grains and we assume that they have the same size and shape distribution.
4.1. Grain size
Due to the high density, dust grains are likely to grow in molecular clouds. In order to model this, we increase
the maximum grain size rmax while keeping rmin constant, and calculate τ9.7/E(J − K) as well as the shape of the 9.7 μm silicate feature. The result is shown in Fig. 17. At first, when the maximum grain size is increased, τ9.7/E(J − K) decreases down to about 0.28, but, as rmax exceeds ~0.6 μm, it starts increasing. This behaviour is dominated by the change in E(J − K) due to growth of the graphite grains. With this model, however, we are not able to explain the observed flattening of the τ9.7 versus E(J − K) relationship, because our model curves do not reach the lower right part of the τ9.7, E(J − K) diagram, where the most reddened molecular lines-of-sight are located (see Fig. 7).
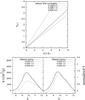 |
Fig. 17 Upper: the effect of increasing the maximum grain size on the the τ9.7 versus E(J − K) relationship. The minimum and maximum grains size are given in μms. lower: the effect of increasing the maximum grain size on the shape of the 9.7 μm silicate feature. The left panel shows the calculated 9.7 μm silicate absorption profiles in terms of the mass extinction coefficient and the right panel shows the same profiles normalised to 1 at 10.5 μm as was done with the observations. The solid line in both panels represent the best fit for the Galactic centre feature from Min et al. (2007). |
The shape of the 9.7 μm silicate feature does not change much as the maximum grain size is increased up to 1.0 μm. When rmax exceeds this value the 9.7 μm silicate profile weakens and shifts towards longer wavelengths. This is in contrast with our observations which show slight excess absorption on the short wavelength side of the feature (see Fig. 11). So, if grain growth is indeed taking place, it is limited to a grain size of about 1.0 μm, and cannot explain the observed variations.
4.2. Grain shape
Figure 18 (upper panel) shows how the τ9.7 versus E(J − K) relationship changes as a function of fmax. With increased sphericity, the slope of the relation decreases towards the value observed in molecular sightlines (see Fig. 7). The effect is small, however, and certainly not strong enough to explain the observed break down of this relationship in the observations.
The lower panel of Fig. 18 shows the effect of changing the grain shape on the 9.7 μm silicate profile. Comparing this to the observations (Fig. 11), the observed variations in molecular sightlines might be explained if the dust grains in molecular clouds are more regular than in the diffuse ISM.
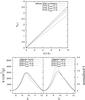 |
Fig. 18 Upper: the effect of changing the grain shape on the the τ9.7 versus E(J − K) relationship. The shape of the particles is represented by a distribution of hollow spheres (DHS), where fmax represents the size of the cavities in the grains and is a measure for the irregularity of the particles (fmax = 1 means highly irregular particles, fmax = 0.1 means almost spherical particles). The Galactic centre fit by Min et al. (2007) uses fmax = 0.7. lower: the effect changing the maximum grain shape on the 9.7 μm silicate profile. The left panel shows the calculated 9.7 μm silicate absorption profiles in terms of the mass extinction coefficient and the right panel shows the same profiles normalised to 1 at 10.5 μm as was done with the observations. The solid line in both panels represent the best fit for the Galactic centre feature from Min et al. (2007). |
4.3. Chemical composition
Interstellar silicate dust is mostly a mixture of amorphous olivines and pyroxenes (e.g. Day 1974; Gillett et al. 1975; Kemper et al. 2004; Min et al. 2007; Chiar et al. 2007). Figure 19 shows the effect of changing the chemical composition of the silicates on the τ9.7 versus E(J − K) relationship. This relationship is plotted for the chemical composition of the best fit Min et al. (2007) found for the Galactic centre, where we used graphite instead of amorphous carbon, at a mass fraction of 31% (solid line; Draine 2003). The dashed and dotted lines represent models with the same amount of graphite, together with a type of amorphous pyroxene (i.e. MgSiO3; Dorschner et al. 1995) only; or graphite and a type of amorphous olivine (i.e. Mg2SiO4; Henning & Stognienko 1996) only, respectively. Going from a pyroxene to olivine composition τ9.7/E(J − K) decreases, but even assuming a pure olivinic composition is not sufficient to explain the observations. The best fit to the diffuse ISM feature towards the Galactic centre contains Mg-rich end-members of silicates only (Min et al. 2007), and the contribution to the NIR opacity of these silicates is negligible. The presence of iron-containing silicates, or dirty silicates, would increase the contribution to the NIR opacity due to silicates, and thus decrease the amount of graphite required.
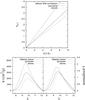 |
Fig. 19 Upper: the τ9.7 versus E(J − K) relationship for the chemical composition of the best fit Min et al. (2007) found for the Galactic centre together with a mass fraction of 31% of graphite (solid line). The dashed and dotted lines represent a model with the same amount of graphite together with a pure magnesium rich amorphous pyroxene (i.e. MgSiO3) and magnesium rich amorphous olivine (i.e. Mg2SiO4), respectively. lower: the 9.7 μm silicate absorption profiles for the above models. The left panel shows the calculated 9.7 μm silicate absorption profiles in terms of the mass extinction coefficient and the right panel shows the same profiles normalised to 1 at 10.5 μm as was done with the observations. The solid line in both panels represent the best fit for the Galactic centre feature from Min et al. (2007). |
Figure 19 (lower panel) shows the effect of changing the silicate composition on the shape of the 9.7 μm silicate feature. The change in shape of the 9.7 μm silicate feature that we observe could be explained if the silicate grains in molecular clouds contain relatively more amorphous pyroxene. This would increase the τ9.7 versus E(J − K) relationship slightly, in contrast to the observations, but, since the observed variations in the 9.7 μm silicate profile are small, the effect on the τ9.7 versus E(J − K) relationship is probably also small.
5. Discussion
5.1. Silicates (τ9.7) as cause of the variations
The observed breakdown of the τ9.7 versus E(J − K) relationship in molecular clouds could either be caused by a decrease of τ9.7 or an increase of E(J − K). In order to explain the behaviour of the molecular cloud sightlines in terms of variations in τ9.7, the silicate optical depth must decrease by at least a factor of 2 compared to the diffuse ISM silicates. Our model calculations show that such a large change in τ9.7 is hard to achieve without substantial changes in the shape of the 9.7 μm silicate absorption band. The observed modest band shape variations in molecular cloud sightlines suggest that variations in τ9.7 cannot be the dominant cause for the difference between diffuse and molecular sightlines. Instead, variations in E(J − K) may be responsible.
The observed small changes in the silicate band shape are probably not caused by grain growth, unless grain growth causes more spherical grain shapes (see Sect. 4). Note that grain growth can still take place, but it is limited to a grain size of about 1 μm, since above this grain size the 9.7 μm silicate profile changes in a way that is inconsistent with the observations.
In the above models, we have not considered chemically inhomogeneous grains. For instance, metal inclusions can have an effect on the silicate absorption. Such changes should specifically affect the silicate optical depth, as the NIR extinction law remains unchanged over a large range of column densities (Román-Zúñiga et al. 2007).
5.2. E(J – K) as cause of the variations
Since we did not find a model that can explain the breakdown of the τ9.7 versus E(J − K) relationship in terms of variations in τ9.7, we consider it more likely that this is due to changes in E(J − K). There are several ways to achieve such variations without affecting the shape and strength of the 9.7 μm silicate absorption band.
The effect of grain growth and shape changes in graphite grains on the τ9.7 versus E(J − K) relationship has been investigated in Sect. 4. Grain growth can be the answer if silicates do not grow beyond about 1 μm and at the same time this growth should increase the E(J − K) by up to a factor of 4. It is unclear what could be the cause for such a large increase in E(J − K) in combination with modest silicate grain growth. Possibly, inhomogeneous aggregates could cause such behaviour.
In our model, the graphites and the silicates are considered to be separate grains, but in reality they might form composite grains. Moreover, our model does not include possible metallic iron grains, which could cause extinction in the near-infrared.
The E(J − K) in molecular clouds could also increase by the formation of a dust species that is less abundant in the diffuse ISM and has a high opacity at near-infrared wavelengths, e.g. FeS, which is thought to form in molecular clouds (Scappini et al. 2003).
6. Conclusions
In order to study the dust properties in different environments in the ISM, spectra were selected from the Spitzer archive of highly reddened stars in both diffuse and molecular sightlines. We have analysed the 9.7 and 18 μm silicate absorption features in these spectra separately. Our main results are:
-
For diffuse lines-of-sight the strength of the 9.7 μmsilicate feature represented by the optical depth at about9.7 μm (τ9.7) shows a tight linear correlation with thenear infrared colour excess, E(J − K). However, this correlation breaksdown for molecular sightlines (Chiaret al. 2007). The measurements forthe spectra analysed in this paper are consistent with this finding.
-
The shape of the 9.7 μm silicate feature is very similar for the three diffuse sightlines investigated in this study. Their shape is, within errors, also similar to that observed in the line-of-sight towards the Galactic centre (Kemper et al. 2004). We conclude that we only observe small variations less than 0.15 in normalised τ in the 9.7 μm silicate band shape in diffuse lines-of-sight, and that the Galactic centre line-of-sight is representative for the diffuse ISM in general. The shape of the 18 μm silicate absorption feature is also, within errors, found to be invariable for the diffuse sightlines. The situation is different for lines-of-sight passing through molecular clouds: we observe small variations on the short wavelength side of the 9.7 μm silicate band.
-
Since both the shape of the 9.7 μm silicate feature and the relationship between τ9.7 and E(J − K) change for molecular sightlines as compared to diffuse sightlines, we conclude that the dust properties in molecular clouds are different from the diffuse ISM.
-
Based on comparison with theoretically calculated profiles, we have ruled out grain growth beyond about 1 μm as being responsible for the changes in the 9.7 μm profile. The observations could be explained if the dust grains are more spherical in molecular clouds than in the diffuse ISM, but the underlying process is not understood.
-
We propose that the flattening of the τ9.7 versus E(J − K) relationship is caused by an increase in E(J − K) in molecular clouds. The mechanism that causes this, however, is not yet clear. Further research is necessary to investigate whether it can be caused by grain growth.
Diffuse and molecular sightlines are defined as lines-of-sight which pass mostly, but not exclusively, through diffuse or molecular cloud material, respectively.
References
- Boogert, A. C. A., & Ehrenfreund, P. 2004, in Astrophysics of Dust, ed. A. N. Witt, G. C. Clayton, & B. T. Draine, ASP Conf. Ser., 309, 547 [Google Scholar]
- Boogert, A. C. A., Pontoppidan, K. M., Knez, C., et al. 2008, ApJ, 678, 985 [NASA ADS] [CrossRef] [Google Scholar]
- Bouwman, J., Meeus, G., de Koter, A., et al. 2001, A&A, 375, 950 [NASA ADS] [CrossRef] [EDP Sciences] [Google Scholar]
- Bowey, J. E., Adamson, A. J., & Whittet, D. C. B. 1998, MNRAS, 298, 131 [NASA ADS] [CrossRef] [Google Scholar]
- Chiar, J. E., & Tielens, A. G. G. M. 2006, ApJ, 637, 774 [NASA ADS] [CrossRef] [Google Scholar]
- Chiar, J. E., Ennico, K., Pendleton, Y. J., et al. 2007, ApJ, 666, L73 [NASA ADS] [CrossRef] [Google Scholar]
- Compiègne, M., Verstraete, L., Jones, A., et al. 2011, A&A, 525, A103 [NASA ADS] [CrossRef] [EDP Sciences] [Google Scholar]
- Day, K. L. 1974, ApJ, 192, L15 [NASA ADS] [CrossRef] [Google Scholar]
- Decin, L., Cohen, M., Eriksson, K., et al. 1997, in The first ISO workshop on Analytical Spectroscopy, ed. A. M. Heras, K. Leech, N. R. Trams, & M. Perry, ESA SP, 419, 185 [Google Scholar]
- Decin, L., Morris, P. W., Appleton, P. N., et al. 2004, ApJS, 154, 408 [NASA ADS] [CrossRef] [Google Scholar]
- Demyk, K., Jones, A. P., Dartois, E., Cox, P., & D’Hendecourt, L. 1999, A&A, 349, 267 [NASA ADS] [Google Scholar]
- Demyk, K., Dartois, E., Wiesemeyer, H., et al. 2000, in ISO Beyond the Peaks: The 2nd ISO Workshop on Analytical Spectroscopy, ed. A. Salama, M. F. Kessler, K. Leech, & B. Schulz, ESA SP, 456, 183 [Google Scholar]
- Demyk, K., Carrez, P., Leroux, H., et al. 2001, A&A, 368, L38 [NASA ADS] [CrossRef] [EDP Sciences] [Google Scholar]
- Dorschner, J., Begemann, B., Henning, T., Jäger, C., & Mutschke, H. 1995, A&A, 300, 503 [NASA ADS] [Google Scholar]
- Draine, B. T. 2003, ApJ, 598, 1026 [NASA ADS] [CrossRef] [Google Scholar]
- Draine, B. T. & Lee, H. M. 1984, ApJ, 285, 89 [Google Scholar]
- Egan, M. P., Price, S. D., Kraemer, K. E., et al. 2003, VizieR Online Data Catalog, 5114 [Google Scholar]
- Elias, J. H. 1978, ApJ, 224, 857 [NASA ADS] [CrossRef] [Google Scholar]
- Evans, II, N. J., Allen, L. E., Blake, G. A., et al. 2003, PASP, 115, 965 [NASA ADS] [CrossRef] [Google Scholar]
- Gillett, F. C., Jones, T. W., Merrill, K. M., & Stein, W. A. 1975, A&A, 45, 77 [NASA ADS] [Google Scholar]
- Gustafsson, B., Bell, R. A., Eriksson, K., & Nordlund, A. 1975, A&A, 42, 407 [NASA ADS] [Google Scholar]
- Gustafsson, B., Edvardsson, B., Eriksson, K., et al. 2008, A&A, 486, 951 [NASA ADS] [CrossRef] [EDP Sciences] [Google Scholar]
- Henning, T., & Stognienko, R. 1996, A&A, 311, 291 [NASA ADS] [Google Scholar]
- Houck, J. R., Roellig, T. L., van Cleve, J., et al. 2004, ApJS, 154, 18 [NASA ADS] [CrossRef] [Google Scholar]
- Jones, T. W., & Merrill, K. M. 1976, ApJ, 209, 509 [NASA ADS] [CrossRef] [Google Scholar]
- Kemper, F., de Koter, A., Waters, L. B. F. M., Bouwman, J., & Tielens, A. G. G. M. 2002, A&A, 384, 585 [Google Scholar]
- Kemper, F., Vriend, W. J., & Tielens, A. G. G. M. 2004, ApJ, 609, 826 [NASA ADS] [CrossRef] [Google Scholar]
- Koornneef, J. 1983, A&A, 128, 84 [NASA ADS] [Google Scholar]
- Mathis, J. S., Rumpl, W., & Nordsieck, K. H. 1977, ApJ, 217, 425 [NASA ADS] [CrossRef] [Google Scholar]
- McCarthy, J. F., Forrest, W. J., Briotta, Jr., D. A., & Houck, J. R. 1980, ApJ, 242, 965 [NASA ADS] [CrossRef] [Google Scholar]
- McClure, M. 2009, ApJ, 693, L81 [NASA ADS] [CrossRef] [Google Scholar]
- Min, M., Hovenier, J. W., & de Koter, A. 2005, A&A, 432, 909 [NASA ADS] [CrossRef] [EDP Sciences] [Google Scholar]
- Min, M., Waters, L. B. F. M., de Koter, A., et al. 2007, A&A, 462, 667 [NASA ADS] [CrossRef] [EDP Sciences] [Google Scholar]
- Ossenkopf, V., Henning, T., & Mathis, J. S. 1992, A&A, 261, 567 [NASA ADS] [Google Scholar]
- Rawlings, M. G., Adamson, A. J., & Whittet, D. C. B. 2000, ApJS, 131, 531 [NASA ADS] [CrossRef] [Google Scholar]
- Rieke, G. H. 1974, ApJ, 193, L81 [NASA ADS] [CrossRef] [Google Scholar]
- Roche, P. F. 1988, in Dust in the universe, ed. M. E. Bailey, & D. A. Williams (Cambridge University Press), 415–433 [Google Scholar]
- Roche, P. F. 1989, in Infrared Spectroscopy in Astronomy, ed. E. Böhm-Vitense, ESA SP, 290, 79 [Google Scholar]
- Roche, P. F., & Aitken, D. K. 1984, MNRAS, 208, 481 [NASA ADS] [Google Scholar]
- Roche, P. F., & Aitken, D. K. 1985, MNRAS, 215, 425 [NASA ADS] [CrossRef] [Google Scholar]
- Román-Zúñiga, C. G., Lada, C. J., Muench, A., & Alves, J. F. 2007, ApJ, 664, 357 [NASA ADS] [CrossRef] [Google Scholar]
- Scappini, F., Cecchi-Pestellini, C., Smith, H., Klemperer, W., & Dalgarno, A. 2003, MNRAS, 341, 657 [NASA ADS] [CrossRef] [Google Scholar]
- Schultz, G. V., & Wiemer, W. 1975, A&A, 43, 133 [NASA ADS] [Google Scholar]
- Skrutskie, M. F., Cutri, R. M., Stiening, R., et al. 2006, AJ, 131, 1163 [NASA ADS] [CrossRef] [Google Scholar]
- Sneden, C., Gehrz, R. D., Hackwell, J. A., York, D. G., & Snow, T. P. 1978, ApJ, 223, 168 [NASA ADS] [CrossRef] [Google Scholar]
- Speck, A. K., Whittington, A. G., & Tartar, J. B. 2008, ApJ, 687, L91 [NASA ADS] [CrossRef] [Google Scholar]
- Stein, W. A., & Gillett, F. C. 1971, Nature, 233, 72 [NASA ADS] [Google Scholar]
- Strom, S. E., Vrba, F. J., & Strom, K. M. 1976, AJ, 81, 314 [NASA ADS] [CrossRef] [Google Scholar]
- Tsuji, T., Ohnaka, K., Hinkle, K. H., & Ridgway, S. T. 1994, A&A, 289, 469 [NASA ADS] [Google Scholar]
- van Dishoeck, E. F. 2004, ARA&A, 42, 119 [NASA ADS] [CrossRef] [Google Scholar]
- Whittet, D. C. B. 2003, Dust in the Galactic Environment, (Bristol: Institute of Physics (IOP) Publishing) [Google Scholar]
- Whittet, D. C. B., Bode, M. F., Longmore, A. J., et al. 1988, MNRAS, 233, 321 [NASA ADS] [CrossRef] [Google Scholar]
All Tables
The chemical composition in terms of mass fraction in percent for the best fit model of the Galactic centre feature by Min et al. (2007).
All Figures
|
Fig. 1 Spectrum of an M-giant taken with the Spitzer Space Telescope (Chiar, unpublished Spitzer data). The extinction towards this star is AV ~ 10 mag. Plotted is the observed flux (in Jy) of the star multiplied by the wavelength (in μm) squared (Fν × λ2) versus the wavelength (λ). This choice implies that a horizontal line is expected for an unreddened photosphere. The two most prominent absorption bands at 9.7 and 18 μm are due to interstellar silicate absorption. The smaller band at 8 μm is caused by gas phase SiO in the photosphere of the M-giant itself and clearly affects the 9.7 μm silicate feature, thus hampering the detailed analysis of the shape of the interstellar silicate band. |
| In the text | |
|
Fig. 2 Flux multiplied by wavelength squared spectra of the sightlines used for the 9.7 μm silicate feature study together with the continuum (see main text). |
| In the text | |
|
Fig. 3 Flux multiplied by wavelength squared spectra of the sightlines used for the 18 μm silicate feature study together with the continuum (see main text). Error bars: 2, 3, 3 and 5 Jy × μm2 for StRS354, G323, G343, and G345 respectively. |
| In the text | |
|
Fig. 4 The extracted 9.7 μm optical depth profiles. |
| In the text | |
|
Fig. 5 The extracted 18 μm optical depth profiles. |
| In the text | |
|
Fig. 6 The effect of choosing a different continuum on the shape of the 9.7 μm silicate band for the molecular sightline source SSTc2dJ1633462−242753. The rising continuum in the 18 μm wavelength range is due to the “continuum extinction” which decreases with increasing wavelength. upper: two choices of the continuum normalisation; lower: comparison of the old and new band shape. |
| In the text | |
|
Fig. 7 The measured optical depth at 9.7 μm, τ9.7, as a function of the J − K colour excess, E(J − K), for diffuse sightlines (upper panel) and molecular sightlines (lower panel). The dots represent data from Chiar et al. (2007, and references therein) and the crosses represent our measurements. The dashed line is the correlation between τ9.7 and E(J − K) found for the diffuse ISM (Chiar et al. 2007). The source indicated by the arrow is SSTc2d_J182852.7+002824. This source is remarkable, since it is the only source with E(J − K) > 2 that is still in agreement with the diffuse ISM correlation, probably due to the effects of ices on the estimated band strength. |
| In the text | |
|
Fig. 8 The spectrum observed towards SSTc2d_J182852.7+002824. Absorption features caused by ices on top of the silicate feature are indicated. The absorption feature caused by CH3OH ice at about 9.7 μm makes the silicate feature seem deeper than it really is. Consequently, the strength of the 9.7 μm silicate feature is overestimated. |
| In the text | |
|
Fig. 9 The 9.7 μm silicate features in terms of optical depth for the diffuse sightlines together with the feature observed towards the Galactic centre (Kemper et al. 2004). The features are normalised to unity at 10.5 μm. |
| In the text | |
|
Fig. 10 The difference between the observed features in the diffuse sightlines in our sample and the Galactic centre feature derived by Kemper et al. (2004). |
| In the text | |
|
Fig. 11 The 9.7 μm silicate features in terms of optical depth for the molecular sightlines together with the feature observed towards the Galactic centre (Kemper et al. 2004). The features are normalised to unity at 10.5 μm. |
| In the text | |
|
Fig. 12 The difference between the observed features in the molecular sightlines in our sample and the Galactic centre feature derived by Kemper et al. (2004). (The Elias 3-13 spectrum has not been corrected for the photospheric gas phase SiO band in this figure) |
| In the text | |
|
Fig. 13 Upper: model atmosphere spectrum of a K2 giant calculated Decin et al. (1997, 2004). lower: the corresponding photospheric gas phase SiO band in terms of optical depth. Longwards of 9 μm the absorption is dominated by OH. |
| In the text | |
|
Fig. 14 The 9.7 μm silicate feature observed towards Elias 3-13 (dashed line) together with this feature corrected for photospheric gas phase SiO (dotted line) using a model spectrum calculated by Decin et al. (1997, 2004). The Galactic centre feature (Kemper et al. 2004) is also plotted (solid line) and is representative for diffuse sightlines. |
| In the text | |
|
Fig. 15 The difference between the observed 9.7 μm feature of SSTc2d_J182835.8+002616 and the Galactic centre feature derived by Kemper et al. (2004) (solid line) together with the absorption profile of a mixture of CH3OH and CH3 ice (dashed line). |
| In the text | |
|
Fig. 16 The 18 μm silicate absorption features observed in four diffuse sightlines together with the modelled profile based on the 9.7 μm fit of the Galactic centre sightline (Min et al. 2007). The features are normalised at their peak. Noise levels vary with wavelength and are typically 0.03 in τ at the shortest wavelengths, and increase to 0.10 in τ for the longest wavelength. The anomalous feature seen towards G345.3650 − 00.4015 is plotted with a thicker line than the features in the other sightlines. |
| In the text | |
|
Fig. 17 Upper: the effect of increasing the maximum grain size on the the τ9.7 versus E(J − K) relationship. The minimum and maximum grains size are given in μms. lower: the effect of increasing the maximum grain size on the shape of the 9.7 μm silicate feature. The left panel shows the calculated 9.7 μm silicate absorption profiles in terms of the mass extinction coefficient and the right panel shows the same profiles normalised to 1 at 10.5 μm as was done with the observations. The solid line in both panels represent the best fit for the Galactic centre feature from Min et al. (2007). |
| In the text | |
|
Fig. 18 Upper: the effect of changing the grain shape on the the τ9.7 versus E(J − K) relationship. The shape of the particles is represented by a distribution of hollow spheres (DHS), where fmax represents the size of the cavities in the grains and is a measure for the irregularity of the particles (fmax = 1 means highly irregular particles, fmax = 0.1 means almost spherical particles). The Galactic centre fit by Min et al. (2007) uses fmax = 0.7. lower: the effect changing the maximum grain shape on the 9.7 μm silicate profile. The left panel shows the calculated 9.7 μm silicate absorption profiles in terms of the mass extinction coefficient and the right panel shows the same profiles normalised to 1 at 10.5 μm as was done with the observations. The solid line in both panels represent the best fit for the Galactic centre feature from Min et al. (2007). |
| In the text | |
|
Fig. 19 Upper: the τ9.7 versus E(J − K) relationship for the chemical composition of the best fit Min et al. (2007) found for the Galactic centre together with a mass fraction of 31% of graphite (solid line). The dashed and dotted lines represent a model with the same amount of graphite together with a pure magnesium rich amorphous pyroxene (i.e. MgSiO3) and magnesium rich amorphous olivine (i.e. Mg2SiO4), respectively. lower: the 9.7 μm silicate absorption profiles for the above models. The left panel shows the calculated 9.7 μm silicate absorption profiles in terms of the mass extinction coefficient and the right panel shows the same profiles normalised to 1 at 10.5 μm as was done with the observations. The solid line in both panels represent the best fit for the Galactic centre feature from Min et al. (2007). |
| In the text | |
Current usage metrics show cumulative count of Article Views (full-text article views including HTML views, PDF and ePub downloads, according to the available data) and Abstracts Views on Vision4Press platform.
Data correspond to usage on the plateform after 2015. The current usage metrics is available 48-96 hours after online publication and is updated daily on week days.
Initial download of the metrics may take a while.