Free Access
Fig. 12
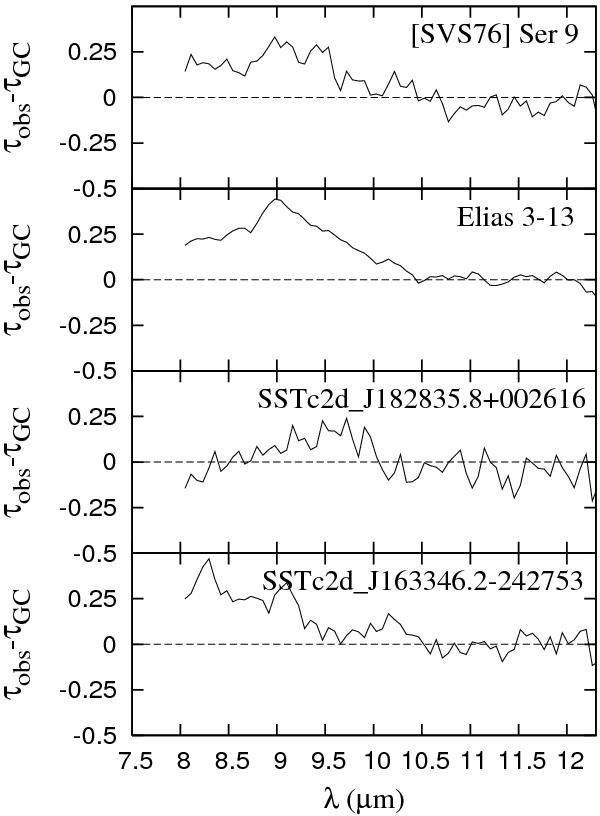
The difference between the observed features in the molecular sightlines in our sample and the Galactic centre feature derived by Kemper et al. (2004). (The Elias 3-13 spectrum has not been corrected for the photospheric gas phase SiO band in this figure)
Current usage metrics show cumulative count of Article Views (full-text article views including HTML views, PDF and ePub downloads, according to the available data) and Abstracts Views on Vision4Press platform.
Data correspond to usage on the plateform after 2015. The current usage metrics is available 48-96 hours after online publication and is updated daily on week days.
Initial download of the metrics may take a while.