Fig. 7
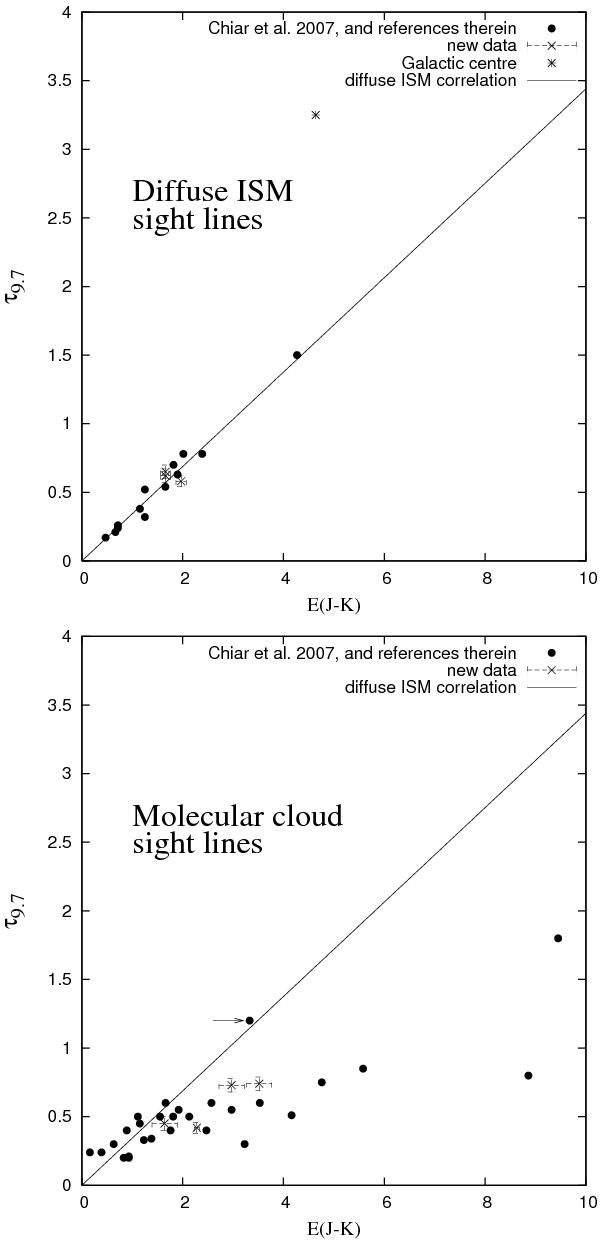
The measured optical depth at 9.7 μm, τ9.7, as a function of the J − K colour excess, E(J − K), for diffuse sightlines (upper panel) and molecular sightlines (lower panel). The dots represent data from Chiar et al. (2007, and references therein) and the crosses represent our measurements. The dashed line is the correlation between τ9.7 and E(J − K) found for the diffuse ISM (Chiar et al. 2007). The source indicated by the arrow is SSTc2d_J182852.7+002824. This source is remarkable, since it is the only source with E(J − K) > 2 that is still in agreement with the diffuse ISM correlation, probably due to the effects of ices on the estimated band strength.
Current usage metrics show cumulative count of Article Views (full-text article views including HTML views, PDF and ePub downloads, according to the available data) and Abstracts Views on Vision4Press platform.
Data correspond to usage on the plateform after 2015. The current usage metrics is available 48-96 hours after online publication and is updated daily on week days.
Initial download of the metrics may take a while.