Fig. 18
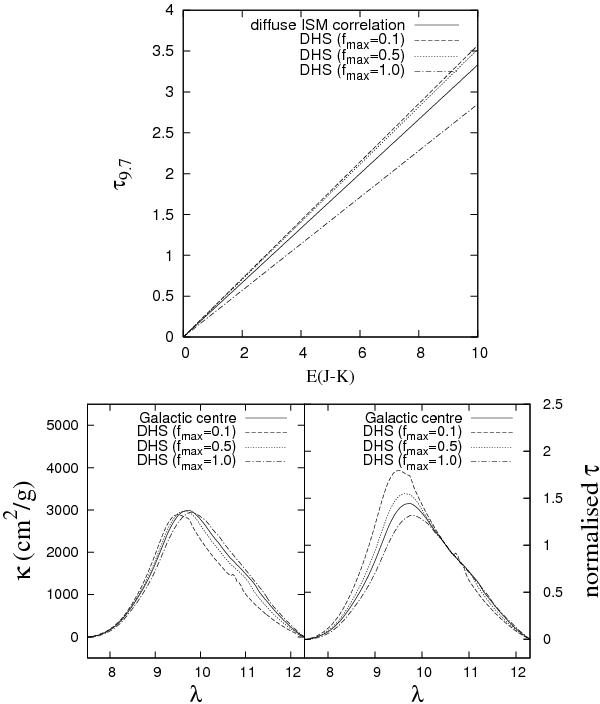
Upper: the effect of changing the grain shape on the the τ9.7 versus E(J − K) relationship. The shape of the particles is represented by a distribution of hollow spheres (DHS), where fmax represents the size of the cavities in the grains and is a measure for the irregularity of the particles (fmax = 1 means highly irregular particles, fmax = 0.1 means almost spherical particles). The Galactic centre fit by Min et al. (2007) uses fmax = 0.7. lower: the effect changing the maximum grain shape on the 9.7 μm silicate profile. The left panel shows the calculated 9.7 μm silicate absorption profiles in terms of the mass extinction coefficient and the right panel shows the same profiles normalised to 1 at 10.5 μm as was done with the observations. The solid line in both panels represent the best fit for the Galactic centre feature from Min et al. (2007).
Current usage metrics show cumulative count of Article Views (full-text article views including HTML views, PDF and ePub downloads, according to the available data) and Abstracts Views on Vision4Press platform.
Data correspond to usage on the plateform after 2015. The current usage metrics is available 48-96 hours after online publication and is updated daily on week days.
Initial download of the metrics may take a while.