| Issue |
A&A
Volume 708, April 2026
|
|
|---|---|---|
| Article Number | L20 | |
| Number of page(s) | 7 | |
| Section | Letters to the Editor | |
| DOI | https://doi.org/10.1051/0004-6361/202558455 | |
| Published online | 24 April 2026 | |
Letter to the Editor
Similar ratios of the rise timescale to the decline timescale of optical light curves in common tidal disruption events
Guangxi Key Laboratory for Relativistic Astrophysics, School of Physical Science and Technology, GuangXi University, No. 100, Daxue Road, Nanning 530004, P.R. China
★ Corresponding author: This email address is being protected from spambots. You need JavaScript enabled to view it.
Received:
8
December
2025
Accepted:
29
March
2026
Abstract
The entirely similar physical process in tidal disruption events (TDEs) basically indicates that just one parameter might distinguish the variability properties of TDEs from that of other transient events that have different physical processes. We report such a parameter, the timescale ratio R2/1, rd of the rise timescale t1/2, r (from half maximum to maximum) to the decline timescale t1/2, d (from maximum to half maximum). We define this based on 34 optical TDEs with reported t1/2, r and t1/2, d. Among the 34 optical TDEs, AT2020wey is an outlier with R2/1, rd ∼ 2.7, which is 4.5 times higher than the mean value 0.6 of the other optical TDEs. However, when the similar but more flexible model functions are considered, the redetermined R2/1, rd is ∼0.9 in AT2020wey. This is very similar to the values of the other optical TDEs. Therefore, the parameter R1/2, rd ∼ 0.6 might be a potential classification parameter for optical TDEs. Furthermore, R1/2, rd were determined in the unique optical transients AT2019avd, PS1-10adi, SDSS J0946+3512, and J2334+1457. The second flare with R1/2, rd ∼ 11 in AT2019avd is expected to be very different from that of other optical TDEs, but PS1-10adi, SDSS J0946+3512, J2334+1457, and the first flare in AT2019avd are expected to be similar to the other optical TDEs. In the near future, the properties of R1/2, rd determined on a large sample of optical transients might provide further clues to support whether R1/2, rd might be a better classification parameter to distinguish TDEs from other transient events.
Key words: galaxies: active / galaxies: nuclei / quasars: supermassive black holes
© The Authors 2026
 Open Access article, published by EDP Sciences, under the terms of the Creative Commons Attribution License (https://creativecommons.org/licenses/by/4.0), which permits unrestricted use, distribution, and reproduction in any medium, provided the original work is properly cited.
This article is published in open access under the Subscribe to Open model. This email address is being protected from spambots. You need JavaScript enabled to view it. to support open access publication.
1. Introduction
Tidal disruption events (TDEs) have been studied for more than four decades since the pioneer work in the 1980s by Rees (1988), Evans & Kochanek (1989), considering a star that is tidally disrupted by a central supermassive black hole (SMBH). Theoretical simulations and observational reports on TDEs have increasingly been made, and TDEs are commonly accepted as candles for central SMBHs and corresponding BH accreting systems in galaxies. More recent theoretical simulations of TDEs can be found in Guillochon & Ramirez-Ruiz (2013), Guillochon et al. (2014), Lodato et al. (2015), Stone et al. (2018), Curd & Narayan (2019), Bonnerot & Lu (2020), Coughlin et al. (2020), Lynch & Ogilvie (2021), Thomsen et al. (2022), Kaur et al. (2023), Zhang (2023), Ryu et al. (2024), Parkinson et al. (2025), Yu & Lai (2025), Yang et al. (2025), and so on, leading to expected variability patterns in different wavelength bands based on theoretical models that consider different physical environments. Simulations then provide evident clues for detecting optical TDEs through model-expected variability patterns in optical light curves, based on which, about 400 optical TDEs have been reported in the literature so far, such as the reported samples of TDE candidates in Wang et al. (2018), Sazonov et al. (2021), van Velzen et al. (2021), Hammerstein et al. (2023), Yao et al. (2023), Zhang (2025) (optical TDE candidates were recently reviewed by Gezari 2021).
In addition to optical TDE light curves as expected and described by theoretical TDE models, mathematical methods were applied to describe the observed optical light curves, such as the more recent detailed descriptions in Hammerstein et al. (2023), Yao et al. (2023), Yao et al. (2025). The application of mathematical methods can lead to some interesting parameters of the profile properties of optical light curves, especially the determined timescales of t1/2, r (the rise timescale from half maximum to maximum) and t1/2, d (the decline timescale from maximum to half maximum). Yao et al. (2023, 2025) discussed that the parameters of t1/2, r and t1/2, d state that the variability properties of one transient are expected to be similar to those of the other optical TDEs, although the profiles of the observed light curves of optical TDE candidates are very different, with very different durations, very different peak intensities, and so on.
Based on the correlation between t1/2, r and t1/2, d (the values listed in Table 4 in Yao et al. 2023) for the optical TDEs shown in Yao et al. (2025, see the results in the left panel of their Fig. 10), the ratio R1/2, rd of t1/2, r to t1/2, d might be a similar value (the slope of the correlation between t1/2, r and t1/2, d) for optical TDEs. In other words, although t1/2, r and t1/2, d of optical TDEs are very different (from several days to more than a hundred days), the physical processes are similar, but with intrinsic stars with different stellar parameters that are tidally disrupted by central SMBHs with different BH masses. Therefore, our main objective is to determine whether the parameter R1/2, rd is a constant value for optical TDEs.
Based on the reported timescales of t1/2, r and t1/2, d of the 33 optical TDEs in Yao et al. (2023) and AT2024tvd in Yao et al. (2025), the ratios R1/2, rd = t1/2, r/t1/2, d are shown in Fig. 1. Except for AT2020wey, which waas first discovered by Charalampopoulos et al. (2023) and was reported with R1/2, rd ∼ 2.7 in Yao et al. (2023), the other 33 optical TDEs have similar R1/2, rd ∼ 0.6 (standard deviation about 0.4). It is interesting to determine whether the higher R1/2, rd in AT2020wey is intrinsically different from that of the other optical TDEs. Therefore, we selected AT2020wey (z ∼ 0.0274) as our target. Section 2 presents our main results on the timescales of AT2020wey through its high-quality light curves from the Zwicky Transient Facility (ZTF; Bellm et al. 2019; Dekany et al. 2020) and the necessary discussions of the other five optical flares. Section 3 gives our conclusions. We adopted the cosmological parameters of H0 = 70 km · s−1 Mpc−1, ΩΛ = 0.7, and Ωm = 0.3.
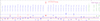 |
Fig. 1. Properties of R1/2, rd. X-labels from 1 to 34 mark the rank number of the 33 optical TDEs in Yao et al. (2023) and AT2024tvd in Yao et al. (2025). The solid red circle plus error bars marks the results for AT2020wey. The solid red five-point star plus error bars marks the modified results in AT2020wey. The solid circle in dark green (rank number 35) shows the results for the first flare in AT2019avd, and the upward arrow in purple (rank number 36) shows the R1/2, rd ∼ 11 that is higher than the current marked position for the second flare in AT2019avd. The open circle (rank number 37), solid triangle (rank number 38), and open triangle (rank number 39) plus error bars in dark green show the results for PS1-10adi, SDSS J0946+3512, and J2334+1457. The open circles plus error bars in red show the remeasured R1/2, rd of the 32 TDEs (except AT2020wey) in Yao et al. (2023). The horizontal solid and dashed line in blue and red mark the mean value and ± standard deviation of the R1/2, rd in Yao et al. (2023) and the remeasured R1/2, rd through ZFPS r-band background-subtracted light curves reported here. |
2. Main results and necessary discussions
The ZTF gr-band light curves LCg(t), LCr(t) in magnitude space of AT2020wey are shown in the left panel of Fig. 2, with MJD-58000 in rest frame from 870 to 1260. The magnitudes are based on point spread function photometry (Bellm et al. 2019). We did not consider the ZTF i-band light curve or light curves from Ultra-Violet-Optical Telescope and Asteroid Terrestrial-impact Last Alert System because they have too few data points. Based on the light curves, the apparent magnitudes mH of the host galaxy contributions in the gr-band can be determined as 18.13 and 17.41 mags after considering the mean magnitudes of data points with MJD-58000 smaller than 1000 days. After subtracting the host galaxy contributions, we determined the intrinsic variability LCg, TDE(t) and LCr, TDE(t) related to the central TDE as LCTDE(t) = − 2.5log(10−0.4LC(t) − 10−0.4mH). This is shown in the middle panel of Fig. 2. The background-subtracted light curves in flux space from the difference imaging of AT2020wey were selected from the ZTF Forced Photometry Service (ZFPS) and are discussed in Appendix A.
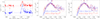 |
Fig. 2. Results for AT2020wey. Left: ZTF gr-band light curves (symbols in blue and in red) of AT2020wey in rest frame, with horizontal dashed lines marking the determined apparent magnitudes of the host galaxy contributions. Middle: LCg, TDE(t) (blue symbols) and LCr, TDE(t) (red symbols) after the host galaxy contributions were subtracted. In the middle panel, the solid and dashed lines in blue and in red show the best descriptions and corresponding 1RMS scatters of LCg, TDE(t) and LCr, TDE(t), respectively, determined by the mathematical method. The corresponding parameters are marked in blue and red characters. The vertical solid lines in blue and in red mark the peak positions of the best-fitting results to the LCg, TDE(t) and LCr, TDE(t), the vertical dotted lines in blue, and the line in red mark the corresponding positions for the half maximum of the best-fitting results. Right: New descriptions of LCg, TDE(t) and LCr, TDE(t) by the modified formula. The symbols and line styles have the same meaning as in the middle panel. |
We then first determined whether the higher R1/2, rd in AT2020wey arises from unintentionally incorrect measurements. Based on the Gaussian rise and power-law decay in luminosity space in Yao et al. (2023), LCg, TDE(t) and LCr, TDE(t) in magnitude space can be described by
![Mathematical equation: $$ \begin{aligned} LC_{\mathrm{{TDE}}}(t)\ =\ \left\{ \begin{aligned}&A\ -\ 2.5\log (G([t_p, \sigma _0, f_0])) \ \ \ (t < t_p) \\&B\ -\ 2.5\log ((t - t_1)^\beta ) \ \ \ \ \ \ \ \ (t>t_p) \end{aligned}, \right. \end{aligned} $$](/articles/aa/full_html/2026/04/aa58455-25/aa58455-25-eq1.gif) (1)
(1)
with tp as the time of peak brightness, and G([tp, σ0, f0]) as a Gaussian function with tp, σ0 and f0 as mean, second moment, and total area of the desired Gaussian curve. We note that we did not consider the additional exponential decline with a secondary peak applied in AT2020wey in Yao et al. (2023) to describe the tails of LCTDE(t), only the Gaussian rise and power-law decay, which we applied to describe the LCTDE(t). The best-fitting results and the determined model parameters to LCg, TDE(t) and LCr, TDE(t) are shown in the middle panel of Fig. 2, through the Levenberg-Marquardt least-squares minimization technique (Markwardt 2009). t1/2, r and t1/2, d are determined as 12.2 ± 0.5 days and 3.2 ± 0.4 days and 16.7 ± 0.9 days and 5.5 ± 0.5 days in gr band. The uncertainties are determined through the 1RMS scatters of the best-fitting results. In magnitude space, the half-maximum positions are determined by the positions to be 0.7526 mags (2.5log(2)) plus the minimum values of the best-fitting results. The remeasured timescales are similar to those in Yao et al. (2023) in AT2020wey, indicating that the higher R1/2, rd in AT2020wey does not stem from incorrect measurements.
The R1/2, rd in AT2020wey is very different from that of the other 33 optical TDEs probably indicates that the intrinsic physical process in AT2020wey is different from the processes for the other optical TDEs. Therefore, it is necessary to determine whether are there effects that modify R1/2, rd in AT2020wey so that they are similar to the values in the other 33 optical TDEs. If this is the case, the parameter R1/2, rd might be a potential classification parameter for optical TDEs.
Based on the functions above, the determined peak positions strongly affect the determined timescales. Therefore, a slightly modified but more flexible formula can be given as
![Mathematical equation: $$ \begin{aligned} LC_{\mathrm{{TDE}}}(t)\ =\ \left\{ \begin{aligned}&A\ -\ 2.5\log (G([t_0, \sigma _0, f_0])) \ \ \ (t < t_c) \\&B\ -\ 2.5\log ((t - t_1)^\beta ) \ \ \ \ \ \ \ \ (t>t_c) \end{aligned}, \right. \end{aligned} $$](/articles/aa/full_html/2026/04/aa58455-25/aa58455-25-eq2.gif) (2)
(2)
with tc not fixed to tp, but a free parameter, and G([t0, σ0, f0]) meaning a Gaussian function with t0 not fixed to tp or tc). The new formula leads to new descriptions of LCg, TDE(t) and LCr, TDE(t), as shown in right panel of Fig. 2. The redetermined t1/2, r and t1/2, d are 10.3 ± 0.6 days and 11.2 ± 0.5 days and 13.1 ± 0.5 days and 13.9 ± 0.2 days in gr band. The re determined t1/2, r and t1/2, d are 11.7 ± 0.6 days and 12.6 ± 0.4 days (the mean values in gr band) in AT2020wey. the results of AT2020wey with R1/2, rd ∼ 0.94 ± 0.08 are replotted in Fig. 1, and based on them, AT2020wey has an R1/2, rd that is similar to that of the other optical TDEs.
Moreover, the flexible model functions are also applied to describe the gr-band background-subtracted light curves in flux space of the other 32 TDEs in Yao et al. (2023) in Appendix B. They lead to the remeasured R1/2, rd in r band shown as open red circles in Fig. 1. As discussed in Appendix B, through the g-band and r-band light curves, there are the same final conclusions about the properties of R1/2, rd. No physical process was considered to describe the optical light curves, but the R1/2, rd determined with the mathematical method has mean values of about 0.60 (standard deviation 0.4) and 0.56 (standard deviation 0.21) based on the R1/2, rd in g band in Yao et al. (2023) and on our remeasured R1/2, rd in r band (same results in g band). The smaller standard deviation indicates that the applications of the flexible model functions are robust and preferred. The results above can also be applied to confirm that to measure values or mean values of R1/2, rd through ZTF or ZFPS single-band or multiple-band light curves in flux space or in magnitude space has few effects on our final results. The similar R1/2, rd indicates that the optical TDEs from ZTF probably have a similar intrinsic physical process for their optical light curves. In other words, if the physical process of optical transients are very different from those for optical TDEs, we expect R1/2, rd to be very different.
Furthermore, we studied whether R1/2, rd of the other optical transients was similar to that of the optical TDEs discussed above. We mainly considered the following optical transients. Chen et al. (2022) discussed the different physical origins of the two optical flares in AT2019avd (z ∼ 0.029): a stream circularization for the first flare, but a delayed BH accreting process for the second flare. The left panel of Fig. 3 shows the ZTF g-band light curve of AT2019avd with an apparent magnitude of 16.63 mag from the host galaxy contributions. Because the number of data points in the ZTF r-band is only half of that in the ZTF g-band, the ZTF r-band light curve was not considered in AT2019avd. We then applied the flexible model functions in Eq. (2) to describe the light curves of the two flares after subtraction of the host galaxy contributions. This led to the best descriptions, which we show in the middle and right panels of Fig. 3. The determined t1/2, r and t1/2, d are 38.9 ± 1.0 days and 89.4 ± 4.9 days for the first flare, and 240.0 ± 2.9 days and 23.3 ± 1.9 days for the second flare. Therefore, the first and the second flare have an R1/2, rd of 0.43 ± 0.04 and 11.4 ± 1.2, as also shown in Fig. 1. The first flare has a similar intrinsic physical process as the other optical TDEs, but the second flare probably has a very different physical process from that of the other optical TDEs. A discussion of the different physical origins of the two optical flares in AT2019avd is beyond the scope of this Letter, and we therefore do not discuss physical models for the two optical flares in AT2019avd.
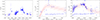 |
Fig. 3. Results for AT2019avd. Left: ZTF g-band light curve in rest frame. The horizontal dashed red line marks the determined apparent magnitude of the host galaxy contributions. Middle: LCg, TDE(t) of the first flare, after subtracting the host galaxy contributions. In the middle panel, the solid and dashed lines in red show the best descriptions and corresponding 1RMS scatters determined by the mathematical method. The corresponding parameters are marked in blue characters. The vertical solid and dotted lines in blue mark the peak and half-maximum positions of the best-fit results. Right: Results for the second flare. The symbols and line styles have the same meanings as in the middle panel. |
On the other hand, PS1-10adi (z ∼ 0.203) is another target to be discussed because Kankare et al. (2017) have reported PS1-10adi as a highly energetic transient event that is probably different from common optical TDEs. The flexible model functions in Eq. (2) were applied to describe the B-band light curve LCB, TDE(t) after subtraction of the host galaxy contributions with an apparent magnitude of 20.12 mag. The best-fitting results and the 1RMS scatters are shown in the left panel of Fig. 4, leading to the determined t1/2, r = 65.3 ± 1.7 days and t1/2, d = 96.8 ± 5.8 days. This shows that PS1-10adi has an R1/2, rd = 0.68 ± 0.06, which is similar to that of the other common optical TDEs (except for the second flare in AT2019avd), indicating a similar intrinsic physical process in PS1-10adi as in the other optical TDEs. The other two reported PS1-10adi-like transients SDSS J0946+3512 (z ∼ 0.119) and J2334+1457 (z ∼ 0.107) in Kankare et al. (2017) are also discussed and are shown in the middle and right panels of Fig. 4, with their V-band light curves selected from the Catalina Sky Survey (Drake et al. 2009). The corresponding R1/2, rd are 0.87 ± 0.11 (t1/2, r and t1/2, d are 131.4 ± 7.1 days and 151.9 ± 8.9 days) and 0.86 ± 0.09 (t1/2, r and t1/2, d are 68.7 ± 2.7 days and 879.5 ± 5.4 days) in SDSS J0946+3512 and J2334+1457, respectively, which is similar to that of the other optical TDEs (except for the second flare in AT2019avd), as shown in Fig. 1. We did not consider the reported transients of PS1-13jw, CSS100217 and SDSS J0948+0318 in Kankare et al. (2017) because we were unable to obtain a good light curve of PS1-13jw, and apparent obscuration effects cause the observed variability profile to be very different from the intrinsic profile in CSS100217, as was recently discussed in Gu et al. (2025), and apparent variability components (probably due to intrinsic variability of the active galactic nucleus) are detected around the flare in SDSS J0948+0318.
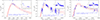 |
Fig. 4. Results for the transients of PS1-10adi (left), SDSS J0946+3512 (middle), and J2334+1457 (right). The top right corner of each panel shows the light curve in rest frame. The horizontal dashed red line marks the determined apparent magnitude of the host galaxy contributions. The main body of each panel shows the best descriptions and corresponding 1RMS scatters to the LCTDE(t) as solid and dashed red lines after the host galaxy contributions were subtracted. The symbols and line styles have the same meanings as in the right panel of Fig. 3. |
Before we conclude this section, the properties of R1/2, rd can be simply be confirmed in supernova-like (SN-like) transients. Based on recent discussions in de Soto et al. (2024, see their Fig. 4), as discussed in Appendix C, the properties of R1/2, rd in SN-like transients are basically different from those in TDEs. Based on the correlation of the rise time (half peak to peak) and fade time (peak to half peak) in Perley et al. (2020, see their Fig. 3) for a large sample of SN-like transients, the mean statistical values of the rise time to fade time ratios are higher than 1, but the measurements of the rise and fade time included host galaxy contributions. Based on the discussions in Appendix C and the results in Perley et al. (2020), some individual SN-like transients might also have the same R1/2, rd ratios, but SN-like transients are expected to have different statistical properties of R1/2, rd from those in TDEs. In the near future, we will provide more detailed results of R1/2, rd for more optical TDEs and the other types of optical transients to further determine whether R1/2, rd is an efficient parameter for testing similar and/or different physical processes in different optical TDEs or in different types of transients. However, based on the discussed R1/2, rd at the current stage for the 39 optical flares, except for the second flare in AT2019avd, the other flares have a similar R1/2, rd, indicating that the parameter R1/2, rd probably is a potentially efficient parameter for classifying optical flares through observational variability profiles alone.
3. Conclusions
Motivated by the timescale correlation between t1/2, r and t1/2, d, we proposed the parameter R1/2, rd for classifying optical TDEs through variability profiles of optical light curves alone, especially based on the 34 optical TDEs from ZTF with similar R1/2, rd around 0.6. The R1/2, rd was studied in the reported four unique transient events. We found that R1/2, rd of PS1-10adi, SDSS J0946+3512, J2334+1457, and the first flare in AT2019avd is similar to that of the other optical TDEs, but in the second flare in AT2019avd, R1/2, rd varies more strongly than in the other optical TDEs. The results can be applied to potentially confirm that the two flares in AT2019avd have intrinsically different physical processes, but PS1-10adi, SDSS J0946+3512, J2334+1457, and the first optical flare in AT2019avd have similar physical processes as the other optical TDEs.
Acknowledgments
Zhang gratefully acknowledge the anonymous referee for giving us constructive comments to greatly improve the paper. Zhang gratefully thanks the kind grant support from Guangxi Science and Technology Program 2026GXNSFDA00640018, and from NSFC-12373014, 12173020 and the support from Guangxi Talent Programme (Highland of Innovation Talents). This manuscript has made use of the data from ZTF, CSS and MPFIT package.
References
- Bellm, E. C., Kulkarni, S. R., Graham, M. J., et al. 2019, PASP, 131, 018002 [Google Scholar]
- Bonnerot, C., & Lu, W. 2020, MNRAS, 495, 1374 [NASA ADS] [CrossRef] [Google Scholar]
- Charalampopoulos, P., Pursiainen, M., Leloudas, G., et al. 2023, A&A, 673, A95 [NASA ADS] [CrossRef] [EDP Sciences] [Google Scholar]
- Chen, J., Dou, L., & Shen, R. 2022, ApJ, 928, 63 [NASA ADS] [CrossRef] [Google Scholar]
- Coughlin, E. R., Nixon, C. J., & Miles, P. R. 2020, ApJ, 900, 39 [Google Scholar]
- Curd, B., & Narayan, R. 2019, MNRAS, 483, 565 [Google Scholar]
- de Soto, K. M., Villar, V. A., Berger, E., et al. 2024, ApJ, 974, 169 [Google Scholar]
- Dekany, R., Smith, R. M., Riddle, R., et al. 2020, PASP, 132, 038001 [NASA ADS] [CrossRef] [Google Scholar]
- Drake, A. J., Djorgovski, S. G., Mahabal, A., et al. 2009, ApJ, 696, 870 [Google Scholar]
- Evans, C. R., & Kochanek, C. S. 1989, ApJ, 364, 13 [Google Scholar]
- Gezari, S. 2021, ARA&A, 59, 21 [NASA ADS] [CrossRef] [Google Scholar]
- Gu, Y., Li, X., Cheng, X., et al. 2025, A&A, 702, L8 [NASA ADS] [CrossRef] [EDP Sciences] [Google Scholar]
- Guillochon, J., & Ramirez-Ruiz, E. 2013, ApJ, 767, 25 [NASA ADS] [CrossRef] [Google Scholar]
- Guillochon, J., Manukian, H., & Ramirez-Ruiz, E. 2014, ApJ, 783, 23 [NASA ADS] [CrossRef] [Google Scholar]
- Hammerstein, E., van Velzen, S., Gezari, S., et al. 2023, ApJ, 942, 9 [NASA ADS] [CrossRef] [Google Scholar]
- Kankare, E., Kotak, R., Mattila, S., et al. 2017, NatAs, 1, 865 [Google Scholar]
- Kaur, K., Stone, N. C., & Gilbaum, S. 2023, MNRAS, 524, 1269 [NASA ADS] [CrossRef] [Google Scholar]
- Lodato, G., Franchini, A., Bonnerot, C., & Rossi, E. M. 2015, J. High Energy Astrophys., 7, 158 [Google Scholar]
- Lynch, E. M., & Ogilvie, G. I. 2021, MNRAS, 500, 4110 [Google Scholar]
- Markwardt, C. B. 2009, ASPC, 411, 251 [Google Scholar]
- Parkinson, E. J., Knigge, C., Dai, L., et al. 2025, MNRAS, 540, 3069 [Google Scholar]
- Perley, D. A., Fremling, C., Sollerman, J., et al. 2020, ApJ, 904, 35 [NASA ADS] [CrossRef] [Google Scholar]
- Rees, M. J. 1988, Nature, 333, 523 [Google Scholar]
- Ryu, T., McKernan, B., Ford, K. E. S., et al. 2024, MNRAS, 527, 8103 [Google Scholar]
- Sazonov, S., Gilfanov, M., Medvedev, P., et al. 2021, MNRASA, 508, 3820 [Google Scholar]
- Stone, N. C., Kesden, M., Cheng, R. M., & van Velzen, S. 2018, Gen. Relat. Grav., 51, 30 [Google Scholar]
- Thomsen, L. L., Kwan, T. M., Dai, L., et al. 2022, ApJ, 937, 28 [Google Scholar]
- van Velzen, S., Gezari, S., Hammerstein, E., et al. 2021, ApJ, 908, 4 [NASA ADS] [CrossRef] [Google Scholar]
- Wang, T., Yan, L., Dou, L., et al. 2018, MNRAS, 477, 2943 [Google Scholar]
- Yang, L., Shu, X., Mou, G., et al. 2025, ApJ, 933, 2 [Google Scholar]
- Yao, Y., Ravi, V., Gezari, S., et al. 2023, ApJ, 955, 6 [Google Scholar]
- Yao, Y., Chornock, R., Ward, C., et al. 2025, ApJ, 985, L48 [Google Scholar]
- Yu, F., & Lai, D. 2025, ApJ, 993, 88 [Google Scholar]
- Zhang, X. G. 2023, MNRAS, 526, 6015 [Google Scholar]
- Zhang, X. G. 2025, ApJ, 981, 90 [Google Scholar]
https://ztfweb.ipac.caltech.edu/batchfp.html, registered username and password required
https://irsa.ipac.caltech.edu/cgi-bin/Gator/nph-scan?submit=Select&projshort=ZTF (no username or password required)
Appendix A: Light curves of AT2020wey from the difference imaging
Besides the shown light curves in Fig. 2 selected from ZTF, the background-subtracted light curves from the difference imaging of AT2020wey are also selected from ZTF Forced Photometry Service (ZFPS1) and shown in Fig. A.1 in flux space. Then, similar as done in middle panel and right panel of Fig. 2, based on the corresponding equations in flux (luminosity) space in Yao et al. (2023) and the flexible equations in flux space
![Mathematical equation: $$ \begin{aligned} LC_{\mathrm{{TDE}}}(t)\ =\ \left\{ \begin{aligned}&G([t_0, \sigma _0, f_0])) \ \ \ (t < t_c) \\&B\ \times \ exp[(t - t_1)/\tau ] \ \ \ (t>t_c) \end{aligned} \right. \end{aligned} $$](/articles/aa/full_html/2026/04/aa58455-25/aa58455-25-eq3.gif) (A.1)
(A.1)
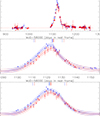 |
Fig. A.1. Results on background-subtracted ZFPS light curves of AT2020wey in rest frame. Top: ZFPS gr-band background-subtracted light curves (symbols in blue and in red) in flux space, including the data points with measurements smaller than 3 times of their uncertainties. Horizontal dashed red line marks flux equal to zero. Middle and bottom: Best fitting results to the background-subtracted light curves with measurements larger than 3 times of their uncertainties around the TDE related flare with MJD-58000 between 1100 and 1200, with symbols and line styles having the same meanings as those in the middle panel and right panel in Fig. 2. |
with tc not fixed to tp but a free parameter, the best fitting results and corresponding 1RMS scatters can be determined to the background-subtracted ZFPS light curves, and shown in middle panel and bottom panel of Fig. A.1. Based on the equations in Yao et al. (2023), the determined t1/2, r and t1/2, d are 12.6 ± 1.1 days, 6.8 ± 1.1 days and 12.4 ± 1.3 days, 7.1 ± 1.4 days in gr-band, totally similar as those in Yao et al. (2023). And based on the more flexible equations, the determined t1/2, r and t1/2, d are 10.6 ± 0.9 days, 11.1 ± 1.1 days and 11.2 ± 0.9 days 10.5 ± 1.0 days in gr-band, leading R1/2, rd to be 1.01 ± 0.2 similar as the results determined in the magnitude space as shown in right panel of Fig. 2.
The results above can be applied to confirm that, ZTF light curves and background-subtracted ZFPS light curves can lead to totally similar results on determined R1/2, rd in AT2020wey. Meanwhile, for us, light curves from photometric CCD image (ZTF light curve) and ZFPS background-subtracted light curves have their own strengths and weaknesses. However, we are more accustomed to using the ZTF light curves, due to their clear information of component not related to TDEs. Therefore, in the manuscript, rather than the background-subtracted ZFPS light curves discussed in the appendix, the common ZTF light curves with PSF magnitudes determined through the CCD images are selected from the webpage2 and mainly considered in AT 2020wey. More detailed discussions (including technique details) on common ZTF light curves and ZFPS light curves can be found in the webpage3.
Appendix B: Re-determined R1/2, rd in the other 32 TDEs by the flexible model functions
In order to test robustness of applications of the flexible model functions, the flexible model equations in Eq. (2) have also been applied to describe the background-subtracted ZFPS gr-band light curves in flux space of the other 32 TDEs in Yao et al. (2023), leading to the re-measured R1/2, rd. Figure B.1 shows the best fitting results and corresponding 1RMS scatters to the background-subtracted ZFPS gr-band light curves of the 32 TDEs. Then, top panel of Fig. B.2 shows the correlation between the R1/2, rd in Yao et al. (2023) in g-band and our re-measured R1/2, rd in r-band, with Spearman rank correlation coefficient is 0.59 (Pnull ∼ 3 × 10⁻⁴). Bottom panel of Fig. B.2 shows the strong linear correlation between our re-measured R1/2, rd in r-band and our re-measured R1/2, rd in g-band of the TDEs in Yao et al. (2023), leading to ratio 0.99 (0.12 as the corresponding 1RMS scatter of X=Y) of re-measured R1/2, rd in r-band to re-measured R1/2, rd in g-band. Therefore, through g-band and r-band light curves, there are the same final conclusions on properties of R1/2, rd.
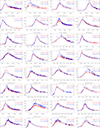 |
Fig. B.1. Results on background-subtracted ZFPS gr-band light curves of the 32 TDEs in rest frame. In each panel, solid circles plus error bars in blue and in red represent the data points in the gr-band. Solid line and dashed lines in blue and in red show the best fitting results and corresponding 1 RMS scatters to the g-band and r-band light curves. Vertical solid and dashed lines in blue and in red mark the positions of the maximum and half maximum of the g-band and r-band light curves. The determined R1/2, rd are listed in blue and red characters in each panel through the best fitting results to the g-band and r-band light curves. |
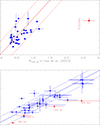 |
Fig. B.2. Properties of our measured R1/2, rd. Top: Correlation between R1/2, rd in Yao et al. (2023) and our re-determined R1/2, rd by the flexible equations applied in r-band in this manuscript for the 33 TDEs. Solid circle plus error bars in red show the results for AT2020wey. Solid line and dashed lines in red show X = Y and corresponding 1RMS scatters. Bottom: Correlation between R1/2, rd in g-band and R1/2, rd in r-band of the 33 TDEs (solid circle plus error bars in blue) and of the 5 classified SN-like transients (solid circles plus error bars in red). Here, due to SLSN-I with R1/2, rd around 10, the SLSN-I is not covered in the bottom panel. In bottom panel, solid and dashed blue lines show X = Y and corresponding 1RMS scatters for the 33 TDEs. |
Here, without considering the power-law rise, only the Gaussian rise is applied, due to the following two points. First, the two rise functions can lead to similar fitting results to the TDEs light curves around half maximum (see Fig. 8 in Yao et al. 2023). Second, applications of Gaussian rise can lead to more flexible crossing point of the rise function and the decay function. Meanwhile, we did not estimate Aν (parameter in Eqs. 1a and 1b in Yao et al. 2023) by fitting SED of AT2020wey, but accepted Aν as a free parameter, leading to more flexible fitting results.
Based on the re-measured R1/2, rd, the mean value is 0.56 with 0.21 as the corresponding standard deviation. Compared with the mean value 0.6 with 0.4 as the corresponding standard deviation through the values in Yao et al. (2023), the smaller standard deviation can be applied to support robustness of applications of the flexible model functions.
Appendix C: Properties of R1/2, rd in the five classified SN-like transients
Based on the gr-band light curves in flux space shown in Fig. 4 in de Soto et al. (2024) of the five classified SN-like transients (SLSN-I, SN Ia, SN Ibc, SN II and SN IIn), the flexible functions have been applied to determine the R1/2, rd in the SN-like transients. Figure C.1 shows the best fitting results to the SN-like transients light curves, with the determined R1/2, rd listed in each panel. Meanwhile, bottom panel of Fig. B.2 shows the correlation between R1/2, rd in g-band and R1/2, rd in r-band of the 5 classified SN-like transients. Then, the following properties of R1/2, rd can be found in the SN-like transients.
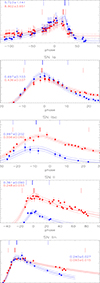 |
Fig. C.1. Results on the gr-band light curves of the five classified SN-like transients. In each panel, solid circles plus error bars in blue and in red represent the data points in g-band and r-band. Solid line and dashed lines in blue and in red show the best fitting results and corresponding 1RMS scatters to the g-band and r-band light curves. Vertical solid and dashed lines in blue and in red mark the positions of the maximum and half maximum of the best fitting results to the g-band and to the r-band light curves. The determined R1/2, rd are listed in blue and red characters through the best fitting results to the g-band and r-band light curves. |
In the SNSL-I, two points can be found. First, the determined R1/2, rd in both g-band light curve and r-band light curve are apparently larger than 1. Second, there are apparent color evolutions in SNSL-I, leading to R1/2, rd in the g-band light curve being different from that in the r-band light curve. The two points can be applied to confirm that the SNSL-I transients have very different properties of R1/2, rd from those in standard TDEs.
In the SN Ia, SN Ibc and SN II, also two points can be found. First, the determined R1/2, rd in both g-band light curve and r-band light curve are smaller than 1, and around the mean value of R1/2, rd in standard TDEs. Second, apparent color evolutions in SN Ia lead to R1/2, rd in the g-band light curve being different from that in the r-band light curve. Therefore, as shown in bottom panel of Fig. B.2, in the space of R1/2, rd in r-band and R1/2, rd in g-band, SN Ia, SN Ibc and SN II are lying in the lower area than the standard TDEs.
In the SN IIn, the apparent color evolutions can lead R1/2, rd in the g-band light curve to be about 2.6 times of R1/2, rd in the r-band light curve. The very different R1/2, rd in light curves in different optical bands can be clearly applied to state that there are very different properties of R1/2, rd in SN IIn from those in standard TDEs.
In one word, based on properties of R1/2, rd through multi-band optical light curves, there are basic clues to support different properties of R1/2, rd in SN-like transients from those in standard TDEs.
All Figures
|
Fig. 1. Properties of R1/2, rd. X-labels from 1 to 34 mark the rank number of the 33 optical TDEs in Yao et al. (2023) and AT2024tvd in Yao et al. (2025). The solid red circle plus error bars marks the results for AT2020wey. The solid red five-point star plus error bars marks the modified results in AT2020wey. The solid circle in dark green (rank number 35) shows the results for the first flare in AT2019avd, and the upward arrow in purple (rank number 36) shows the R1/2, rd ∼ 11 that is higher than the current marked position for the second flare in AT2019avd. The open circle (rank number 37), solid triangle (rank number 38), and open triangle (rank number 39) plus error bars in dark green show the results for PS1-10adi, SDSS J0946+3512, and J2334+1457. The open circles plus error bars in red show the remeasured R1/2, rd of the 32 TDEs (except AT2020wey) in Yao et al. (2023). The horizontal solid and dashed line in blue and red mark the mean value and ± standard deviation of the R1/2, rd in Yao et al. (2023) and the remeasured R1/2, rd through ZFPS r-band background-subtracted light curves reported here. |
| In the text | |
|
Fig. 2. Results for AT2020wey. Left: ZTF gr-band light curves (symbols in blue and in red) of AT2020wey in rest frame, with horizontal dashed lines marking the determined apparent magnitudes of the host galaxy contributions. Middle: LCg, TDE(t) (blue symbols) and LCr, TDE(t) (red symbols) after the host galaxy contributions were subtracted. In the middle panel, the solid and dashed lines in blue and in red show the best descriptions and corresponding 1RMS scatters of LCg, TDE(t) and LCr, TDE(t), respectively, determined by the mathematical method. The corresponding parameters are marked in blue and red characters. The vertical solid lines in blue and in red mark the peak positions of the best-fitting results to the LCg, TDE(t) and LCr, TDE(t), the vertical dotted lines in blue, and the line in red mark the corresponding positions for the half maximum of the best-fitting results. Right: New descriptions of LCg, TDE(t) and LCr, TDE(t) by the modified formula. The symbols and line styles have the same meaning as in the middle panel. |
| In the text | |
|
Fig. 3. Results for AT2019avd. Left: ZTF g-band light curve in rest frame. The horizontal dashed red line marks the determined apparent magnitude of the host galaxy contributions. Middle: LCg, TDE(t) of the first flare, after subtracting the host galaxy contributions. In the middle panel, the solid and dashed lines in red show the best descriptions and corresponding 1RMS scatters determined by the mathematical method. The corresponding parameters are marked in blue characters. The vertical solid and dotted lines in blue mark the peak and half-maximum positions of the best-fit results. Right: Results for the second flare. The symbols and line styles have the same meanings as in the middle panel. |
| In the text | |
|
Fig. 4. Results for the transients of PS1-10adi (left), SDSS J0946+3512 (middle), and J2334+1457 (right). The top right corner of each panel shows the light curve in rest frame. The horizontal dashed red line marks the determined apparent magnitude of the host galaxy contributions. The main body of each panel shows the best descriptions and corresponding 1RMS scatters to the LCTDE(t) as solid and dashed red lines after the host galaxy contributions were subtracted. The symbols and line styles have the same meanings as in the right panel of Fig. 3. |
| In the text | |
|
Fig. A.1. Results on background-subtracted ZFPS light curves of AT2020wey in rest frame. Top: ZFPS gr-band background-subtracted light curves (symbols in blue and in red) in flux space, including the data points with measurements smaller than 3 times of their uncertainties. Horizontal dashed red line marks flux equal to zero. Middle and bottom: Best fitting results to the background-subtracted light curves with measurements larger than 3 times of their uncertainties around the TDE related flare with MJD-58000 between 1100 and 1200, with symbols and line styles having the same meanings as those in the middle panel and right panel in Fig. 2. |
| In the text | |
|
Fig. B.1. Results on background-subtracted ZFPS gr-band light curves of the 32 TDEs in rest frame. In each panel, solid circles plus error bars in blue and in red represent the data points in the gr-band. Solid line and dashed lines in blue and in red show the best fitting results and corresponding 1 RMS scatters to the g-band and r-band light curves. Vertical solid and dashed lines in blue and in red mark the positions of the maximum and half maximum of the g-band and r-band light curves. The determined R1/2, rd are listed in blue and red characters in each panel through the best fitting results to the g-band and r-band light curves. |
| In the text | |
|
Fig. B.2. Properties of our measured R1/2, rd. Top: Correlation between R1/2, rd in Yao et al. (2023) and our re-determined R1/2, rd by the flexible equations applied in r-band in this manuscript for the 33 TDEs. Solid circle plus error bars in red show the results for AT2020wey. Solid line and dashed lines in red show X = Y and corresponding 1RMS scatters. Bottom: Correlation between R1/2, rd in g-band and R1/2, rd in r-band of the 33 TDEs (solid circle plus error bars in blue) and of the 5 classified SN-like transients (solid circles plus error bars in red). Here, due to SLSN-I with R1/2, rd around 10, the SLSN-I is not covered in the bottom panel. In bottom panel, solid and dashed blue lines show X = Y and corresponding 1RMS scatters for the 33 TDEs. |
| In the text | |
|
Fig. C.1. Results on the gr-band light curves of the five classified SN-like transients. In each panel, solid circles plus error bars in blue and in red represent the data points in g-band and r-band. Solid line and dashed lines in blue and in red show the best fitting results and corresponding 1RMS scatters to the g-band and r-band light curves. Vertical solid and dashed lines in blue and in red mark the positions of the maximum and half maximum of the best fitting results to the g-band and to the r-band light curves. The determined R1/2, rd are listed in blue and red characters through the best fitting results to the g-band and r-band light curves. |
| In the text | |
Current usage metrics show cumulative count of Article Views (full-text article views including HTML views, PDF and ePub downloads, according to the available data) and Abstracts Views on Vision4Press platform.
Data correspond to usage on the plateform after 2015. The current usage metrics is available 48-96 hours after online publication and is updated daily on week days.
Initial download of the metrics may take a while.