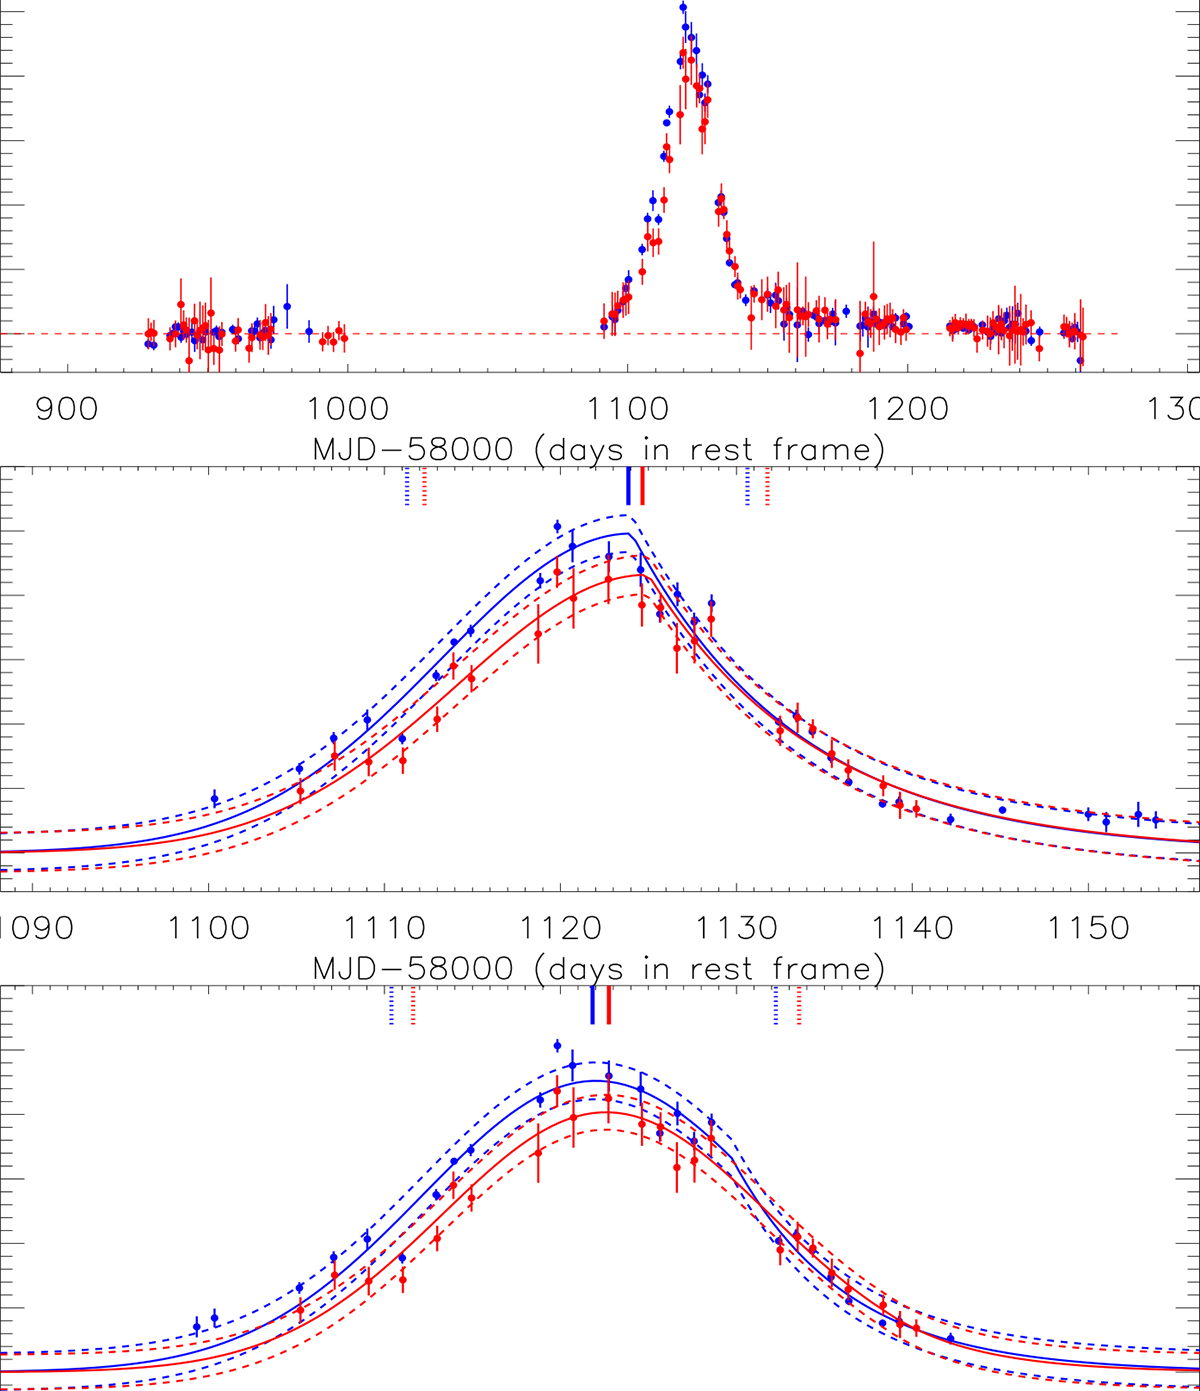
Fig. A.1.
Download original image
Results on background-subtracted ZFPS light curves of AT2020wey in rest frame. Top: ZFPS gr-band background-subtracted light curves (symbols in blue and in red) in flux space, including the data points with measurements smaller than 3 times of their uncertainties. Horizontal dashed red line marks flux equal to zero. Middle and bottom: Best fitting results to the background-subtracted light curves with measurements larger than 3 times of their uncertainties around the TDE related flare with MJD-58000 between 1100 and 1200, with symbols and line styles having the same meanings as those in the middle panel and right panel in Fig. 2.
Current usage metrics show cumulative count of Article Views (full-text article views including HTML views, PDF and ePub downloads, according to the available data) and Abstracts Views on Vision4Press platform.
Data correspond to usage on the plateform after 2015. The current usage metrics is available 48-96 hours after online publication and is updated daily on week days.
Initial download of the metrics may take a while.