Fig. 3.
Download original image
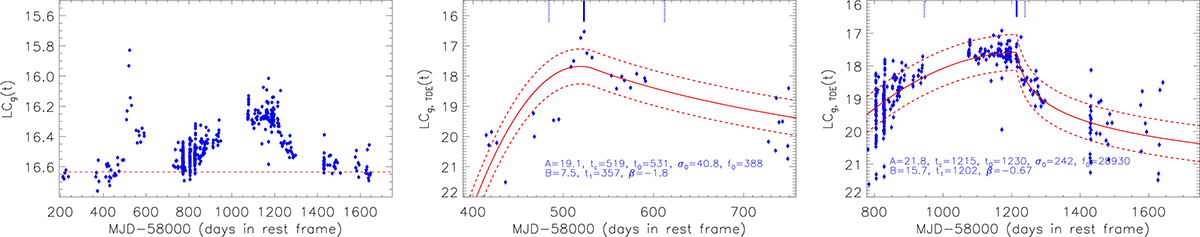
Results for AT2019avd. Left: ZTF g-band light curve in rest frame. The horizontal dashed red line marks the determined apparent magnitude of the host galaxy contributions. Middle: LCg, TDE(t) of the first flare, after subtracting the host galaxy contributions. In the middle panel, the solid and dashed lines in red show the best descriptions and corresponding 1RMS scatters determined by the mathematical method. The corresponding parameters are marked in blue characters. The vertical solid and dotted lines in blue mark the peak and half-maximum positions of the best-fit results. Right: Results for the second flare. The symbols and line styles have the same meanings as in the middle panel.
Current usage metrics show cumulative count of Article Views (full-text article views including HTML views, PDF and ePub downloads, according to the available data) and Abstracts Views on Vision4Press platform.
Data correspond to usage on the plateform after 2015. The current usage metrics is available 48-96 hours after online publication and is updated daily on week days.
Initial download of the metrics may take a while.