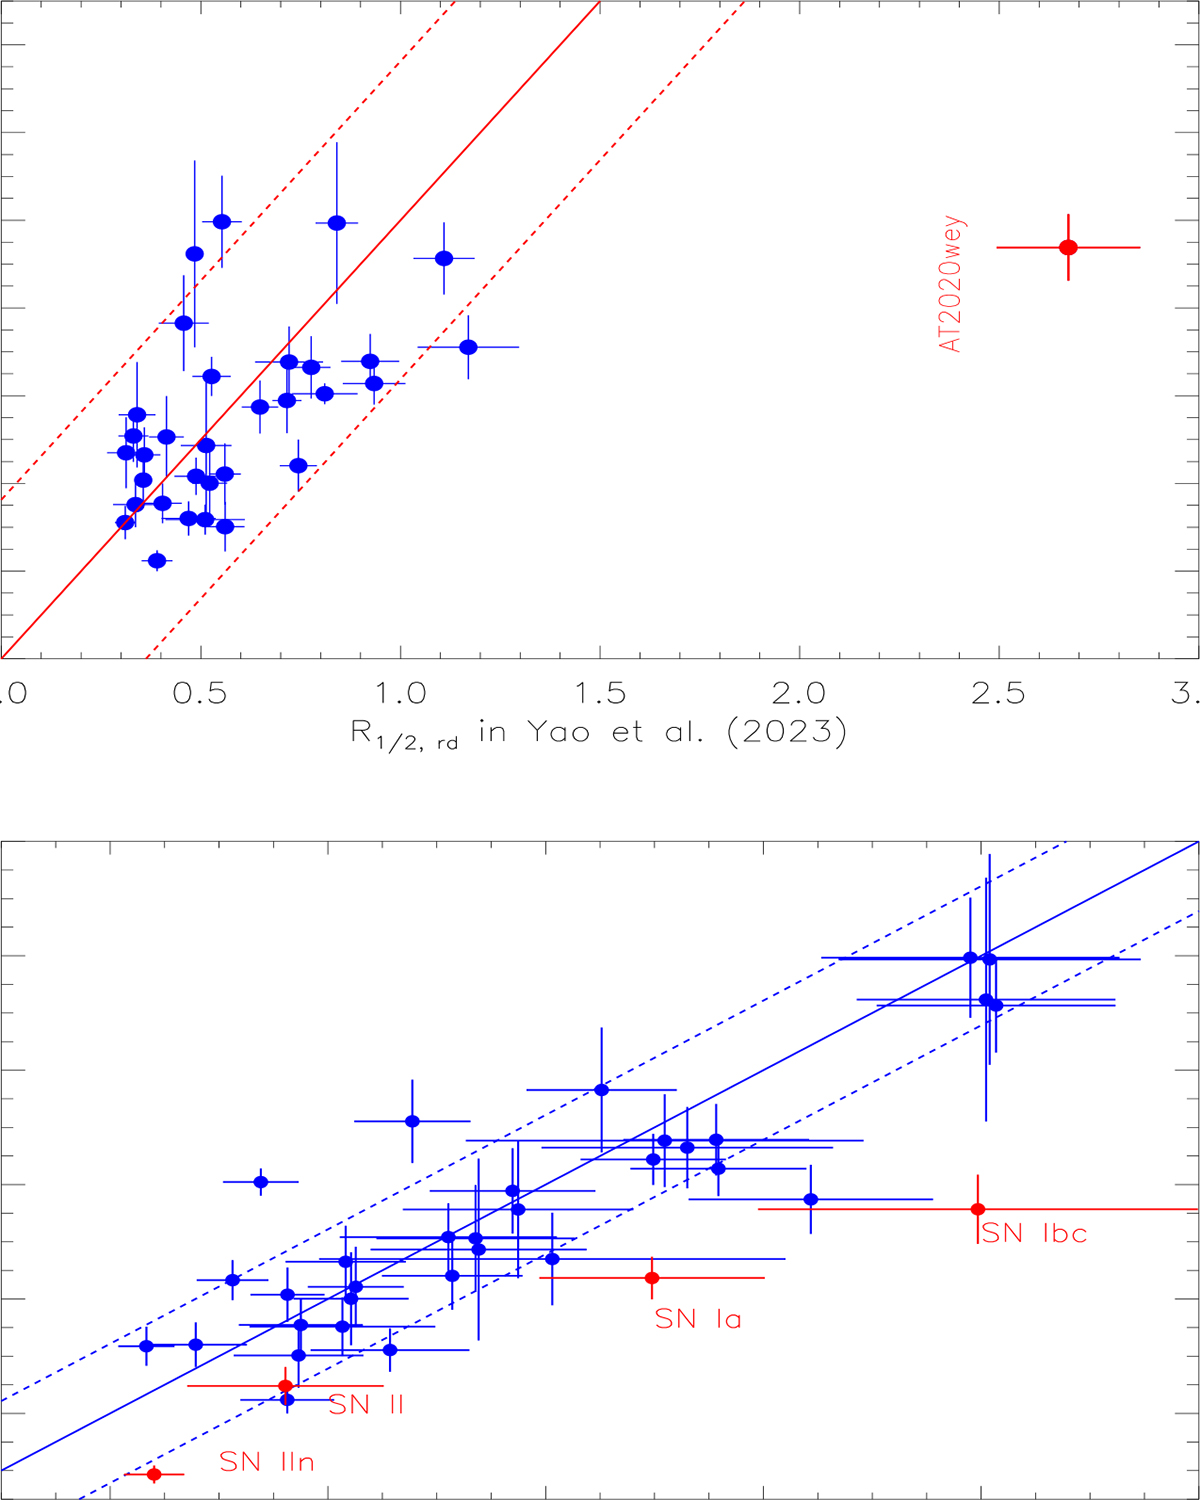
Fig. B.2.
Download original image
Properties of our measured R1/2, rd. Top: Correlation between R1/2, rd in Yao et al. (2023) and our re-determined R1/2, rd by the flexible equations applied in r-band in this manuscript for the 33 TDEs. Solid circle plus error bars in red show the results for AT2020wey. Solid line and dashed lines in red show X = Y and corresponding 1RMS scatters. Bottom: Correlation between R1/2, rd in g-band and R1/2, rd in r-band of the 33 TDEs (solid circle plus error bars in blue) and of the 5 classified SN-like transients (solid circles plus error bars in red). Here, due to SLSN-I with R1/2, rd around 10, the SLSN-I is not covered in the bottom panel. In bottom panel, solid and dashed blue lines show X = Y and corresponding 1RMS scatters for the 33 TDEs.
Current usage metrics show cumulative count of Article Views (full-text article views including HTML views, PDF and ePub downloads, according to the available data) and Abstracts Views on Vision4Press platform.
Data correspond to usage on the plateform after 2015. The current usage metrics is available 48-96 hours after online publication and is updated daily on week days.
Initial download of the metrics may take a while.