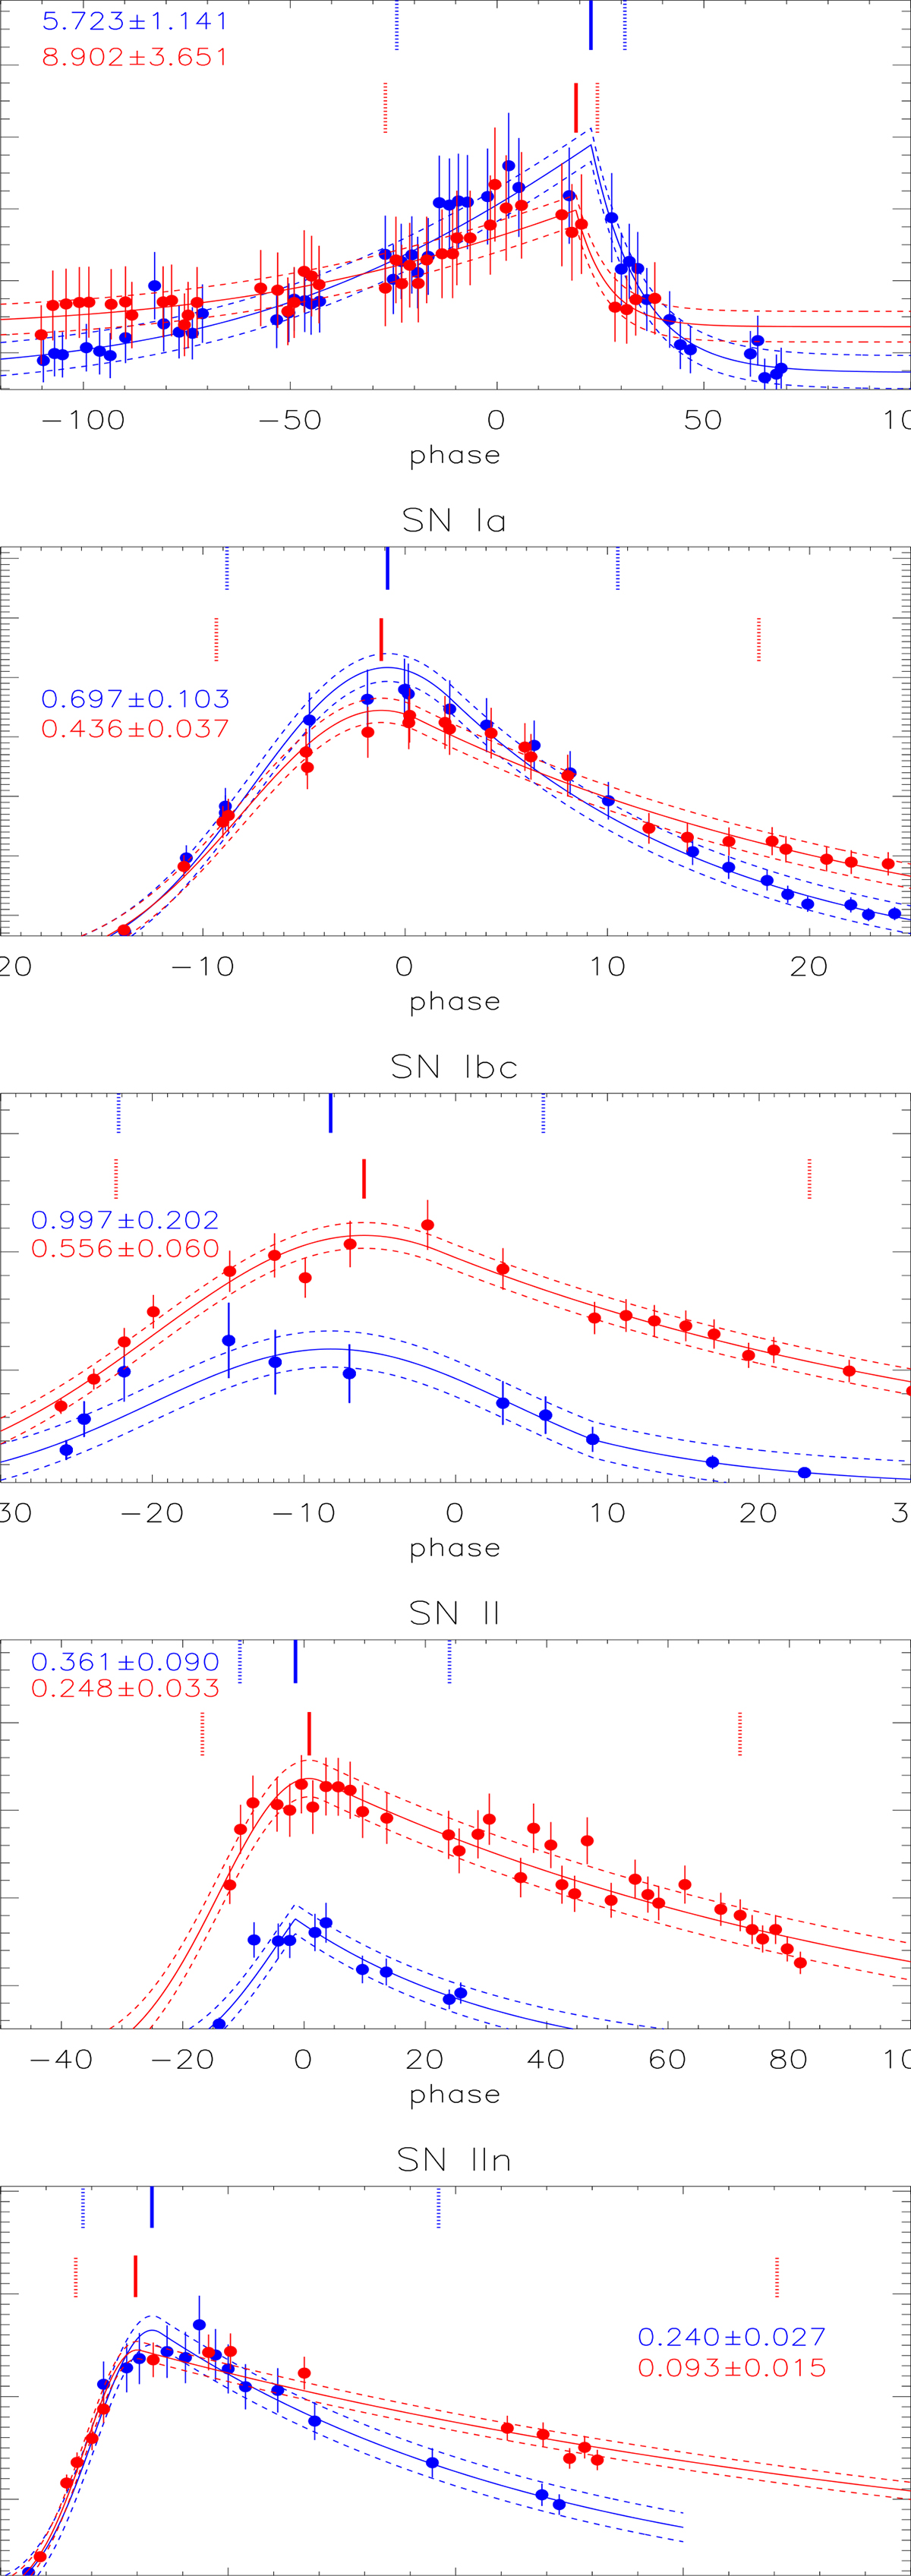
Fig. C.1.
Download original image
Results on the gr-band light curves of the five classified SN-like transients. In each panel, solid circles plus error bars in blue and in red represent the data points in g-band and r-band. Solid line and dashed lines in blue and in red show the best fitting results and corresponding 1RMS scatters to the g-band and r-band light curves. Vertical solid and dashed lines in blue and in red mark the positions of the maximum and half maximum of the best fitting results to the g-band and to the r-band light curves. The determined R1/2, rd are listed in blue and red characters through the best fitting results to the g-band and r-band light curves.
Current usage metrics show cumulative count of Article Views (full-text article views including HTML views, PDF and ePub downloads, according to the available data) and Abstracts Views on Vision4Press platform.
Data correspond to usage on the plateform after 2015. The current usage metrics is available 48-96 hours after online publication and is updated daily on week days.
Initial download of the metrics may take a while.