Fig. 4.
Download original image
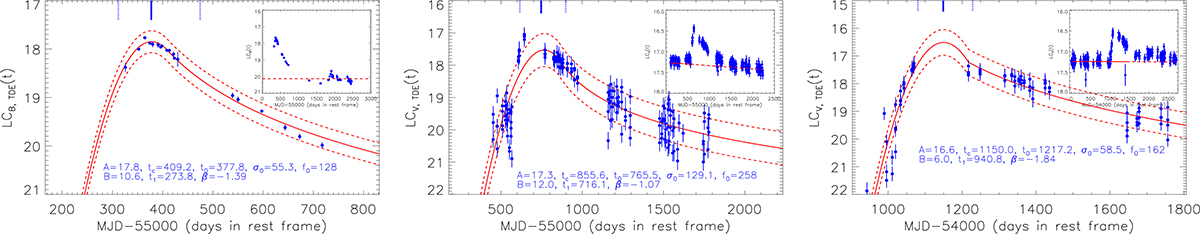
Results for the transients of PS1-10adi (left), SDSS J0946+3512 (middle), and J2334+1457 (right). The top right corner of each panel shows the light curve in rest frame. The horizontal dashed red line marks the determined apparent magnitude of the host galaxy contributions. The main body of each panel shows the best descriptions and corresponding 1RMS scatters to the LCTDE(t) as solid and dashed red lines after the host galaxy contributions were subtracted. The symbols and line styles have the same meanings as in the right panel of Fig. 3.
Current usage metrics show cumulative count of Article Views (full-text article views including HTML views, PDF and ePub downloads, according to the available data) and Abstracts Views on Vision4Press platform.
Data correspond to usage on the plateform after 2015. The current usage metrics is available 48-96 hours after online publication and is updated daily on week days.
Initial download of the metrics may take a while.