| Issue |
A&A
Volume 709, May 2026
|
|
|---|---|---|
| Article Number | A6 | |
| Number of page(s) | 17 | |
| Section | Planets, planetary systems, and small bodies | |
| DOI | https://doi.org/10.1051/0004-6361/202558200 | |
| Published online | 28 April 2026 | |
Survival of protoplanetary disks in Upper Scorpius from population synthesis models with external photoevaporation
1
Institute of Astronomy, KU Leuven,
Celestijnenlaan 200D,
3001
Leuven,
Belgium
2
Dipartimento di Fisica, Università degli Studi di Milano,
Via Celoria 16,
20133
Milano,
Italy
3
Mullard Space Science Laboratory, University College London, Holmbury St Mary, Dorking,
Surrey
RH5 6NT,
UK
4
European Southern Observatory,
Karl-Schwarzschild-Str. 2,
85748
Garching bei München,
Germany
★ Corresponding author: This email address is being protected from spambots. You need JavaScript enabled to view it.
Received:
21
November
2025
Accepted:
23
February
2026
Abstract
We present population synthesis models of viscous protoplanetary disks subject to mild external far-ultraviolet (FUV) radiation fields (FUV = 1–100 G0). Our simulations focus on gas-disk evolution, exploring stellar masses drawn from an initial mass function and a range of initial disk conditions. We quantified the fraction of surviving disks across 10 Myr of evolution, tracked the evolution of gas-disk mass and size, and compared our results with observations of protoplanetary disks in the Upper Scorpius region, including the ten targets studied by the AGE-PRO ALMA Large Program. We find that models combining viscous evolution with external photoevaporation yield disk lifetimes of 3–7 Myr, which is consistent with observed dispersal timescales, particularly for 10−4 ≤ α ≤ 10−2. Low-mass stars (0.1 M⊙) are more susceptible to disk dispersal due to their weaker gravitational binding, with their fraction among all surviving disks dropping from 76% at birth to 51% by 10 Myr. The majority of the long-lived disks are those with low viscosity, α < 10−3.5, and an initial characteristic radius of Rc < 125 AU; the initial disk-to-star mass ratio does not play an important role. The median gas-disk mass and radius of the surviving disks exhibit a sharp decline in the first 0.2 Myr of evolution, followed by a slight increase that reflects survivorship bias. We also explored correlations between gas-disk mass and size versus stellar mass and FUV strength. Our findings highlight the critical role of external photoevaporation in shaping disk populations even at moderate levels of FUV radiation fields.
Key words: accretion, accretion disks / planets and satellites: formation
© The Authors 2026
 Open Access article, published by EDP Sciences, under the terms of the Creative Commons Attribution License (https://creativecommons.org/licenses/by/4.0), which permits unrestricted use, distribution, and reproduction in any medium, provided the original work is properly cited.
This article is published in open access under the Subscribe to Open model. This email address is being protected from spambots. You need JavaScript enabled to view it. to support open access publication.
1 Introduction
Protoplanetary disks are the birth sites of planets. Their evolution and dispersal strongly affect the final properties of planets. There are two physical processes that can transport angular momentum in protoplanetary disks: viscous transport mediated by turbulence (Shakura & Sunyaev 1973; Lynden-Bell & Pringle 1974) and angular momentum removal driven by magnetohydrodynamical (MHD) winds (Blandford & Payne 1982; Bai & Stone 2013). Both of these scenarios leave clear imprints in the disk’s properties. For example, purely viscous models lead to an increase in gas-disk size over time, while MHD winds are predicted not to increase the disk radius with the disk evolution (Yang & Bai 2021; Trapman et al. 2022). Distinguishing between the dominant mechanisms of these two from observations remains one of the biggest challenges in the planet formation community (Manara et al. 2023; Zhang et al. 2025; Tabone et al. 2025).
There are additional physical processes that can shape disk evolution, such as photoevaporation, where high-energy radiation from the central star (internal; Clarke et al. 2001; Ercolano et al. 2008; Picogna et al. 2019; Sellek et al. 2024) or nearby massive stars (external; for a review, see Winter & Haworth 2022 and Allen et al. 2025) heats the protoplanetary disks and triggers a thermal wind when the thermal velocity of particles is higher than the escape velocity. Although photoevaporation does not transport angular momentum, it can remove the disk’s material, modify its size, and accelerate disk dispersal (e.g., Clarke 2007; Coleman & Haworth 2022). External photoevaporation originates from the ultraviolet (UV) radiation emitted by massive stars, mainly nearby O and B stars, and the disk fraction decreases with the number of O/B stars in clusters (Guarcello et al. 2023).
Mild UV radiation in clusters can also affect the evolution of protoplanetary disks, as recently studied for protoplanetary disks in Upper Scorpius (hereafter Upper Sco) by Anania et al. (2025a). Upper Sco is located at an average distance of ~142 pc from the Sun (Fang et al. 2023) and is one of the nearest star-forming regions. It has an age of ~3–14 Myr (e.g., Ratzenböck et al. 2023) and exemplifies the late stages (Class II) of disk evolution (Pecaut et al. 2012; Armstrong et al. 2025). Upper Sco hosts ~50 OB stars (Luhman & Esplin 2020) and 284 stars with full, evolved, transitional and debris disks were identified in Carpenter et al. (2025). Upper Sco serves as a perfect laboratory in which to investigate the fate and survival of disks that are exposed to the moderate far-ultraviolet (FUV) flux (with values of FUV ~ 1–100 G0) from the OBA-type stars in the region. Former population synthesis models including viscous evolution and internal photoevaporation cannot fully explain the accretion rate and the gas-disk mass of the ALMA Survey of Gas Evolution of PROtoplanetary disks (AGE-PRO) sample of both Lupus (1–3 Myr; Deng et al. 2025) and Upper Sco (2–6 Myr; Agurto-Gangas et al. 2025) disks, favoring MHD wind-driven models (Tabone et al. 2025). The results of the AGE-PRO collaboration suggest that the gas mass distribution is similar between Lupus and Upper Sco, implying that the surviving disks in Upper Sco have gas-disk masses similar to their younger counterparts (Trapman et al. 2025b; Zhang et al. 2025). However, the above models cannot fully recover gas-disk sizes in Lupus and Upper Sco. Anania et al. (2025a) modeled the same Upper Sco disks with viscous evolution models that include external photoevaporation, better explaining the gas-disk sizes and masses than when including only viscous evolution and neglecting external photoevaporation in the models. This demonstrates that, due to the role of the stellar formation environment, Upper Sco disks cannot be regarded as old counterparts of Lupus disks (Zagaria et al. 2023). Moreover, Coleman et al. (2024) demonstrated that even weak external photoevaporation (similar FUV values to those experienced by disks in Upper Sco, i.e., ~10 G0) can dampen the effectiveness of disk radius as a diagnostic for distinguishing between viscous and wind-driven disks. Together, these results highlight the importance of constraining disk evolution using population synthesis models that incorporate external photoevaporation and enable direct comparison with observations.
In this work, we aim to investigate the role of moderate external photoevaporation (FUV = 1–100 G0) in shaping the disk fraction and the evolution of gas-disk masses and sizes of a population of protoplanetary disks. We explored whether a gas-only population synthesis model of viscous disks experiencing external photoevaporation can reproduce the distribution of gas-disk sizes observed in the Upper Sco region. Moreover, we aim to investigate whether the correlations from our population synthesis models align with the disks in Upper Sco observed in the AGE-PRO sample and provide potential observational correlations that can be used to test of our models with future observations of a larger sample in Upper Sco.
The paper is structured as follows. In Sect. 2, we explain the observational sample used in this work to compare with the results from models. In Sect. 3, we describe the gas-evolution model, simulation setup, and the method used to compare with observations. Section 4 presents the main results obtained from the simulations. We focus on the disk fraction, gas-disk mass, size, and empirical correlations for gas-disk mass and size. Our results and additional processes affecting disk evolution are discussed in Sect. 5. Section 6 summarizes the main remarks.
2 Target sample
The targets considered for comparing the results of our population synthesis to observations are the 202 disks in Upper Sco reported by Carpenter et al. (2025). The disks were initially identified through near- and mid-infrared excess emission detected with WISE and Spitzer (Esplin et al. 2018; Luhman & Esplin 2020; Luhman 2022), yielding a total of 284 candidates, 202 of which were subsequently identified as Upper Sco members.
The FUV fluxes used in our population synthesis models were sampled from the distribution of values related to the observed sample. The FUV fluxes, FUV, at the position of the Upper Sco targets were evaluated by considering the contribution of the neighboring OBA-type stars and accounting for the uncertainty in the 3D separation from massive stars using the method detailed in Anania et al. (2025b). Figure 1 demonstrates the probability density function (PDF) of the observed FUV flux with the 16th, median, and 84th values and their corresponding log-normal fits (blue). The red represents the log-normal distribution that encloses these observed values, from which the FUV fluxes in our models were drawn. Approximately 72% of the disks are subject to mild levels of FUV flux FUV between 3 and 30 G0.
In addition, to compare the simulation results with the observed sample, we show the stellar mass PDF of those disk-bearing stars in Fig. 2. Stellar masses are available for 169 of the 202 disks adopted from Pinilla et al. (2025), the authors of which derived them from stellar luminosities and effective temperatures by comparison with pre-main-sequence evolutionary tracks from Baraffe et al. (2015). The remaining 33 targets lack luminosity measurements and thus have no stellar mass estimates, but they do not show significant bias in spectral type, nor, therefore, in mass. Among the 169 disks with mass estimates, about 65% of the stars have M⋆ < 0.2 M⊙, and no disk-bearing star more massive than 3 M⊙ has been identified. Based on the spectral energy distribution and near-infrared color–color diagram, 97 disks are classified as “full,” 14 as “transitional,” 26 as “evolved,” and 23 as “debris,” “evolved transitional,” or class III by Luhman & Esplin (2020) and Luhman (2022).
As a comparison to the gas-disk size distribution resulting from our model, we used the definition of radius in Carpenter et al. (2025), which is the radius enclosing 95% of the 12CO J = 3–2 flux emission in the image plane. Due to the resolution of the observations, the radius has a lower limit of 0.25″ (~36 AU at the Upper Sco distance of 142 pc; Carpenter et al. 2025). Therefore, 148 disks with radii at this limit are considered unresolved, leaving 54 disks with gas-disk size measurements.
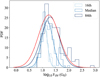 |
Fig. 1 PDF of external FUV flux FUV, fit with log-normal distribution. Light, medium, and dark blue lines represent 16th, median, and 84th values of the FUV flux in the Upper Sco star forming region, respectively. The red line enclosing the blue lines shows the distribution from which we draw FUV flux, FUV, in our models. |
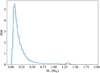 |
Fig. 2 PDF of stellar mass, M⋆, for the 169 disk-bearing stars in Upper Sco by Carpenter et al. (2025). The stellar masses are presented in Pinilla et al. (2025). |
3 Gas-evolution models
We performed population synthesis models of gas-only simulations using DustPy (Stammler & Birnstiel 2022) along with an integrated module that incorporates external photoevaporation (Gárate et al. 2024; Anania et al. 2025a) by interpolating the FRIEDv2 grid (Haworth et al. 2023) to low values of FUV (down to 1 G0) and including the mass-loss rate by external photoevaporation into the models, as explained in Gárate et al. (2024).
Considering a geometrically thin and axisymmetric disk evolving under viscous accretion and external photoevaporation, the gas surface density Σg (R, t) can be obtained by the 1D standard diffusion equation (Lynden-Bell & Pringle 1974; Pringle 1981):
![Mathematical equation: $\[\frac{\partial}{\partial t} \Sigma_{\mathrm{g}}=\frac{3}{R} \frac{\partial}{\partial R}\left(R^{1 / 2} \frac{\partial}{\partial R}\left(v \Sigma_{\mathrm{g}} R^{1 / 2}\right)\right)-\dot{\Sigma}_{\mathrm{ext}},\]$](/articles/aa/full_html/2026/05/aa58200-25/aa58200-25-eq1.png) (1)
(1)
where ν = αcsHg is the kinetic viscosity, with Hg being the gas scale height, cs the sound speed, and α a dimensionless viscosity parameter (Shakura & Sunyaev 1973). In Eq. (1), ![Mathematical equation: $\[\dot{\Sigma}_{\text {ext}}\]$](/articles/aa/full_html/2026/05/aa58200-25/aa58200-25-eq2.png) is the mass-loss rate due to external photoevaporative winds. This mass-loss rate is derived via the bilinear interpolation of the FRIEDv2 grid (Haworth et al. 2023). The ratio of polycyclic aromatic hydrocarbon (PAH) to the dust abundance is assumed to be 1, corresponding to ISM-like PAH for ISM-like dust. The PAH-to-dust ratio is important, as PAH is the dominant heating mechanism in the photodissociation region (PDR; Facchini et al. 2016). In the absence of observational constraints, we adopted a fiducial value of 1. In the external photoevaporation models, the truncation radius, Rt, is defined as the radius with the maximum mass-loss rate, marking the transition between the optically thick and optically thin regions of the externally photoevaporative wind. The total mass-loss rate outside the truncation radius
is the mass-loss rate due to external photoevaporative winds. This mass-loss rate is derived via the bilinear interpolation of the FRIEDv2 grid (Haworth et al. 2023). The ratio of polycyclic aromatic hydrocarbon (PAH) to the dust abundance is assumed to be 1, corresponding to ISM-like PAH for ISM-like dust. The PAH-to-dust ratio is important, as PAH is the dominant heating mechanism in the photodissociation region (PDR; Facchini et al. 2016). In the absence of observational constraints, we adopted a fiducial value of 1. In the external photoevaporation models, the truncation radius, Rt, is defined as the radius with the maximum mass-loss rate, marking the transition between the optically thick and optically thin regions of the externally photoevaporative wind. The total mass-loss rate outside the truncation radius ![Mathematical equation: $\[\left(R>R_{\mathrm{t}}\right), \dot{M}_{\text {tot}}\]$](/articles/aa/full_html/2026/05/aa58200-25/aa58200-25-eq3.png) , is then predicted for a disk with a given surface density profile around a star with certain mass subject to FUV radiation field. Following Sellek et al. (2020), the total mass-loss rate is distributed across a grid cell (i), which is weighted by the total mass in the outer region:
, is then predicted for a disk with a given surface density profile around a star with certain mass subject to FUV radiation field. Following Sellek et al. (2020), the total mass-loss rate is distributed across a grid cell (i), which is weighted by the total mass in the outer region:
![Mathematical equation: $\[\dot{M}_{\mathrm{ext}, \mathrm{i}}=\dot{M}_{\mathrm{tot}} \frac{M_{\mathrm{i}}}{M\left(R>R_{\mathrm{t}}\right)}.\]$](/articles/aa/full_html/2026/05/aa58200-25/aa58200-25-eq4.png) (2)
(2)
In addition, we considered a passive flared disk, heated by the central star under an angle ψ; the temperature profile is
![Mathematical equation: $\[T(R)=\left(\frac{\psi L_{\star}}{8 \pi R^2 \sigma_{\mathrm{SB}}}\right)^{1 / 4},\]$](/articles/aa/full_html/2026/05/aa58200-25/aa58200-25-eq5.png) (3)
(3)
where σSB is the Stefan–Boltzmann constant, and L⋆ is the stellar luminosity, which is obtained for different stellar masses based on the evolutionary tracks by Dotter et al. (2008) for stars at the age of 5 Myr. In Appendix A, we show a comparison with the scenario in which the stellar luminosity, L⋆, evolves according to the evolutionary track by Dotter et al. (2008), showing that the results are analogous to the scenario of fixed luminosity. A constant flaring irradiation angle of ψ = 0.05 was adopted, leading to the temperature profile of T(R) ∝ R−1/2.
Initial disk parameters.
3.1 Initial conditions
The initial surface density profile was set based on the Lynden-Bell & Pringle (1974) self-similar solution, assuming a linear dependence of the viscosity ν ∝ Rγ with γ = 1:
![Mathematical equation: $\[\Sigma_g(R)=\Sigma_0\left(\frac{R}{R_c}\right)^{-1} \exp \left(-\frac{R}{R_c}\right),\]$](/articles/aa/full_html/2026/05/aa58200-25/aa58200-25-eq6.png) (4)
(4)
where Rc is the characteristic radius, the scale radius of the exponential term; and Σ0 is set by the total disk mass.
The disk was modeled with a radial grid that consists of 500 cells uniformly spaced in R1/2, covering a range from 2.5 to 1000 AU.
3.2 Population synthesis models
A total of 5000 simulations were performed, covering the entire relevant parameter space well. The primary parameters considered include stellar mass, M⋆; disk-to-stellar mass ratio, ϵ (= Mdisk/M⋆); disk characteristic radius, Rc; viscosity parameter, α; and external FUV flux, FUV. Table 1 shows the ranges of the parameters considered in the population synthesis models.
The stellar mass, M⋆, was selected based on the initial mass function (IMF) of Maschberger (2013), which was built on the IMF of Kroupa (2001, 2002) and Chabrier (2003). Stellar masses were randomly sampled over the 0.1–3 M⊙ range covered by the FRIEDv2 grid. Similarly, the FUV field strengths, restricted to the discrete values available in the FRIEDv2 grid, were sampled according to relative probabilities based on the observed log-normal distribution (the red line in Fig. 1). The other initial parameters – viscosity parameter, α; disk-to-stellar mass ratio, ϵ; and disk characteristic radius, Rc – were randomly drawn from a log-uniform distribution.
Each disk was evolved for 10 Myr. We compared results in which the disk was considered to be dispersed once having lost 90, 95, and 99% of the initial mass, or when the mass-loss rate drops below 10−14 M⊙ yr−1. In our cases, all disks were dispersed by the mass-based criteria before the mass-loss rate reached the threshold.
3.3 Comparison with observations
We assumed that gas-disk radius is the position at which the gas column density encloses 90% of 12CO line flux. The gas column density, Ngas(R12CO,90%), can be written as a function of the gas-disk mass, Mgas, and the stellar luminosity, L⋆, as in Trapman et al. (2023):
![Mathematical equation: $\[N_{\mathrm{gas}}\left(R_{{ }^{12} \mathrm{CO}, 90 \%}\right) \approx 10^{21.27-0.53 ~\log~ L_{\star}}\left(\frac{M_{\mathrm{gas}}}{\mathrm{M}_{\odot}}\right)^{0.3-0.08 ~\log~ L_{\star}},\]$](/articles/aa/full_html/2026/05/aa58200-25/aa58200-25-eq7.png) (5)
(5)
which was obtained from fitting the results of DALI thermodynamical models and relies on the initial carbon abundance and the assumed disk temperature profile.
In our models, R12CO,90% is calculated as the radius corresponding to the critical value of the disk surface density at each time step,
![Mathematical equation: $\[\Sigma\left(R_{{ }^{12} \mathrm{CO}, 90 \%}, t\right)=\Sigma_{\text {crit }}(t)=N_{\mathrm{gas}}\left(R_{{ }^{12} \mathrm{CO}, 90 \%}, t\right) \mu_{\mathrm{gas}},\]$](/articles/aa/full_html/2026/05/aa58200-25/aa58200-25-eq8.png) (6)
(6)
where μgas is the mean molecular weight of the gas in the disk, which is set to be ~2.3 μH = 1.15 μH2.
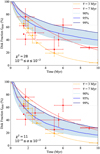 |
Fig. 3 Decline in disk fraction, fdisk, with disk age. Blue lines show the disk fraction considering disk dispersal when losing 90% (light), 95% (medium), and 99% (dark) of the initial mass. The red points correspond to the observed disk fractions of nearby clusters within 200 pc, and the dashed line is the fit exponential decay, f(t) = exp(−t/τ), yielding τ = 7 Myr from Pfalzner et al. (2022). The yellow points are from Fedele et al. (2010), giving τ = 3 Myr. The top and bottom panels correspond to disks with viscosity ranges of 10−5 ≤ α ≤ 10−2 and 10−4 ≤ α ≤ 10−2, respectively. The χ2 values are shown in the bottom left of each figure. |
4 Results and comparison with observations
4.1 Disk fraction and surviving disks
Figure 3 shows the decline in disk fraction with disk age from our population synthesis models (blue), in comparison with different disk lifetimes. Different blue lines represent gas-disk dispersal when losing different percentages of the initial gas-disk mass. The red and orange lines show the observed disk fractions and the corresponding derived disk lifetimes of τ = 3 Myr (Fedele et al. 2010) and τ = 7 Myr (Pfalzner et al. 2022), assuming an exponential decay of f(t) = exp(−t/τ). The disk lifetime is constrained by the accretion timescale, reflecting gas dispersal, and by the infrared excess timescale, tracing dust dissipation. These timescales depend on stellar mass, wavelength, evolutionary models, and the environment (Mamajek 2009; Ribas et al. 2015; Fang & Herczeg 2025). The accretion timescale is typically shorter than the infrared-excess timescale, with characteristic values of ~3 Myr (Fedele et al. 2010; Delfini et al. 2025). Mamajek (2009) estimated the infrared excess timescale of ~2.5 Myr. However, this can extend to τ ~ 7 Myr when only considering nearby star-forming regions (d < 200 pc) that lack massive O-type stars (Pfalzner et al. 2022).
In our simulations, the disk fraction, fdisk, decreases more slowly than the observed values with viscosity 10−5 ≤ α ≤ 10−2 (top panel of Fig. 3). At 5 Myr, the disk fraction –considering disk dispersal– when losing 95% of the initial mass is ~6% higher than the empirical relation with τ = 7 Myr. Later at 10 Myr, the disk fraction –assuming disk dispersal– when losing 90% of the initial mass is ~29% larger than the empirical relation with τ = 7 Myr. However, when restricting to disks with 10−4 ≤ α ≤ 10−2, the resulting time evolution of the disk fraction is more consistent with observations, as shown in the bottom panel of Fig. 3. This is because higher viscosity increases the accretion rate onto the central star, resulting in shorter disk lifetimes. Also, higher viscosity drives faster viscous spreading, making disks more extended. Therefore, disks with higher viscosity are more vulnerable to external photoevaporation. Other different ranges of viscosity are considered in Appendix B. Among them, the disk fraction favors a viscosity of 10−4 ≤ α ≤ 10−2 to match with observations when assuming disk viscous evolution under external photoevaporation.
We checked the distribution of the stellar mass of the surviving disks, at which point disk dispersal is defined as losing 90% of the initial gas-disk mass (the same criteria stand unless noted otherwise). Figure 4 shows the percentage of surviving disks in each stellar mass bin at different times of disk evolution, compared to observations. Material in disks around less massive stars is less gravitationally bound; hence, it more easily entrained by photoevaporative winds. As a result, the percentage of surviving disks around 0.1 M⊙ stars among all surviving disks decreases over time, while that of disks around more massive stars gradually increases. The fraction of surviving disks around 0.1 M⊙ decreases from ~76% at birth to around 51% at 10 Myr. A similar trend is observed for stellar mass, with more disk-bearing stars found at lower masses. However, observation suggests that the percentage of disks around stars with 0.1 M⊙ is ~27% higher than in our simulations. No star with 3 M⊙ is present in the observed sample. Indeed, for stars more massive than 1.5 M⊙, photoevaporation by the central star is expected to disperse the disk by 10 Myr of evolution (Kunitomo et al. 2021). Consequently, internal photoevaporation, which is neglected in our models, will change the stellar mass distribution of the surviving disks.
To understand the properties of the surviving disks in our models, Fig. 5 shows the distribution of disks that survive after 5 Myr with a given value of Rc and α. The surviving disks exhibit a preference for low viscosity and a small characteristic radius, where the preference for low viscosity is stronger than that for a small characteristic radius. The surviving disks at 5 Myr mainly exhibit a viscosity of α < 10−3.5, whereas no significant preference is observed for a characteristic radius of Rc < 125 AU. Lower viscosity reduces the efficiency of disk spreading, and therefore a combination of lower viscosity, α, and smaller Rc results in more compact disks that are more gravitationally bound and less vulnerable to mass loss by external photoevaporation.
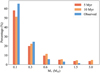 |
Fig. 4 The percentage of surviving disks in each stellar mass bin from our simulations at 5 (red) and 10 (orange) Myr of disk evolution, compared to the 169 samples (blue) from Carpenter et al. (2025). The stellar masses are presented in Pinilla et al. (2025). |
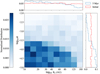 |
Fig. 5 Distribution of disks with certain characteristic radius, Rc, and viscosity parameter, α, that survive after 5 Myr of evolution, assuming that the gas disk is dispersed when losing 90% of the initial mass. The red and blue lines represent the distributions at birth and 5 Myr, respectively. |
4.2 Gas-disk mass evolution
Figure 6 shows the time evolution of the median gas-disk mass of the surviving disks, which decreases sharply within the first 0.2 Myr and increases slightly thereafter as the low-mass disks disperse. If we consider disk dispersal when losing 90% of the initial gas-disk mass, the median gas-disk mass decreases by ~ 58% at the first 0.2 Myr. Later at 10 Myr, the median gas-disk mass is ~ 26% larger than that at 0.2 Myr. A similar trend is observed as well if we consider disk dispersal when losing 95 or 99% of the initial mass. In contrast, the median value of the entire disk population continues to decline over time. This highlights the importance of survivorship bias among the observed disk population.
The gas mass evolution of the disk is mainly influenced by the mass accreted onto the central star and the mass removed by external photoevaporative winds. At the beginning of the simulation, ~80% of disks showed a mass-loss rate at least one order of magnitude larger than the mass-accretion rate, as illustrated in Fig. 7. Our results suggest that for the whole population, mild FUV flux (FUV = 1–100 G0) can cause rapid decline of the median disk mass on a relatively short timescale of 0.2 Myr. As the disk evolves, the accretion rate onto the star gradually reaches the equilibrium with the rate of material lost in winds (Clarke 2007; Sellek et al. 2020). After 0.2 Myr, ~38% of the surviving disks exhibit a mass-loss rate at least one order of magnitude higher than the mass-accretion rate. Later, at 5 Myr, this fraction drops to only ~0.8%.
Moreover, the surviving disks do not show a significant preference for higher initial disk-to-star mass ratios, ϵ. The slightly higher initial masses observed among surviving disks arise from the stronger dispersal of disks around low-mass stars. Although disks with lower ϵ are more easily dispersed, this effect remains marginal.
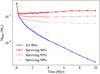 |
Fig. 6 Time evolution of the median gas-disk mass, Mgas. The blue line shows the evolution of the entire sample, adopting 90% gas-disk mass loss as the dispersal criterion. The red lines refer to surviving disks only, with dark, medium, and light red corresponding to dispersal defined by 90%, 95%, and 99% of the gas-disk mass loss, respectively. |
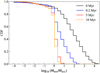 |
Fig. 7 Cumulative distribution function (CDF) of |
![Mathematical equation: $\[\dot{M}_{\text {ext}} / \dot{M}_{\text {acc}}\]$](/articles/aa/full_html/2026/05/aa58200-25/aa58200-25-eq9.png)
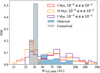 |
Fig. 8 The PDF of the gas-disk radius R12CO,90% for surviving disks at 5 (red) and 10 (orange) Myr, compared with observation by Carpenter et al. (2025, blue). The gray line marks the unresolved disks with upper limit radius 0.25″, and the dashed blue line includes all the disks. The purple line shows models with a viscosity of 10−4 ≤ α ≤ 10−2. |
4.3 Gas-disk size
Figure 8 shows the PDF of the gas-disk radius R12CO,90% compared with observations by Carpenter et al. (2025) (similar to Zallio et al. 2026). Both viscosities, 10−4 ≤ α ≤ 10−2 and 10−5 ≤ α ≤ 10−2, can produce extended disks with radii of >150 AU. However, surviving disks with higher viscosity remain large under external photoevaporation due to efficient viscous spreading. In Carpenter et al. (2025), 148 disks (~73% of the total sample) remain unresolved, with an upper limit radius of 0.25″ (~36 AU at 142 pc) imposed by the beam size. Zallio et al. (2026) further showed that the median gas-disk radius is expected to be ≲22 AU. The higher viscosity range of 10−4 ≤ α ≤ 10−2 fails to reproduce this large population of compact disks. Under our initial conditions, a viscosity of 10−4 ≤ α ≤ 10−2 only produces ~18% of disks with radii of < 36 AU, whereas lower viscosity, 10−5 ≤ α ≤ 10−2, produces ~44%. In contrast to the disk fraction, which favors a viscosity of 10−4 ≤ α ≤ 10−2, the gas-disk radius distribution prefers lower viscosity to produce more compact disks; the latter constitute a high fraction of the observed population. Resolving the size of the small disks that remain unresolved by current observations will provide new insights about the disk conditions that may reproduce the observed disk properties.
In Fig. 8, the PDF of the surviving disks only shows a slight difference between 5 and 10 Myr. Figure 9 illustrates the time evolution of the median gas-disk radius. The evolution of the median gas-disk radius follows a similar trend to the gas-disk mass, declining to ~21% of the initial value within the first 0.2 Myr, remaining nearly constant until 5 Myr, and increasing slightly thereafter. At 10 Myr, the median radius is approximately 18% larger than at 5 Myr. Survivorship bias is evident for the gas-disk radius as well.
As discussed above, disk mass loss due to external photoevaporation is already significant across the entire population from the early stages of evolution. External photoevaporative winds truncate the disk rapidly within the first 0.2 Myr. Larger disks are more easily truncated, while compact disks viscously spread initially until the mass-loss rate becomes significant, and then they shrink.
Similar trends can also be seen from the disk radius of R90%, which encloses 90% of the gas-disk mass; the median value of radius decreases significantly during the first 0.2 Myr, remains almost constant afterwards, and then increases after 9 Myr. However, at this point there are only slight differences between the overall population and the surviving disks. The disks are truncated by the external photoevaporative winds to similar sizes. The gas-disk radius R12CO,90% is comparable to or larger than R90%, and it can reach up to five times R90%.
4.4 Empirical correlations
We searched for potential correlations between the properties of surviving disks and stellar properties. We applied a Markov chain Monte Carlo (MCMC) method using linmix (Kelly 2007) to estimate the Pearson correlation coefficient, r, between different parameters. All the surviving disks from our simulations are included in the analysis. We then fit the parameters with a power-law relation. The median value and 1σ confidence interval (CI) of the slope, α, and the intercept, β, were calculated. The main results are summarized in Figs. 10 and 11, while a full list of the correlation coefficients can be found in Table C.1. We find that the gas-disk mass, Mgas, presents a moderate positive correlation (r ~ 0.6) with gas-disk size, R12CO,90%; a tentative positive correlation (r ~ 0.5) with stellar mass, M⋆; and a negligible correlation (r ~ 0.04) with FUV field, FUV. For the gas-disk radius, a very strong correlation (r ~ 0.9) with stellar mass and a negligible correlation (r ~ −0.2) with FUV strength are found.
Figures 10 and 11 illustrate these correlations for the surviving disks at 5 Myr of evolution. We did not apply any uncertainty to our simulated data, and therefore the resulting 1σ credible intervals from the MCMC fitting are correspondingly narrow. We obtain ![Mathematical equation: $\[M_{\text {gas}} \propto R_{{ }^{12} \mathrm{CO}, 90 \%}^{1.58}\]$](/articles/aa/full_html/2026/05/aa58200-25/aa58200-25-eq10.png) and
and ![Mathematical equation: $\[M_{\text {gas}} \propto M_{\star}^{1.29}\]$](/articles/aa/full_html/2026/05/aa58200-25/aa58200-25-eq11.png) and
and ![Mathematical equation: $\[R_{{ }^{12} \mathrm{CO}, 90 \%} \propto M_{\star}^{0.87}\]$](/articles/aa/full_html/2026/05/aa58200-25/aa58200-25-eq12.png) and
and ![Mathematical equation: $\[R_{{ }^{12} \mathrm{CO}, 90 \%} \propto F_{\mathrm{UV}}^{-0.14}\]$](/articles/aa/full_html/2026/05/aa58200-25/aa58200-25-eq13.png) . Additionally, the power law changes slightly over time. For example, the power-law index decreases by ~14% from 1 Myr to 10 Myr for correlations between Mgas and R12CO,90%. Also, there is large scatter in the gas-disk mass (as illustrated in Fig. 10) due to the combination of different initial parameters. This scatter makes it challenging to identify such correlations from a limited observational sample. Similar to gas-disk mass, the scatter in the gas-disk radius is huge, as shown in Fig. 11. The strongest correlation is found between stellar mass and gas-disk radius. The observed decrease in gas-disk radius with increasing FUV flux is consistent with the expectation that stronger FUV radiation can truncate disks more effectively. However, the dependence of gas-disk radius on FUV flux does not extend to the gas-disk mass, for which no significant correlation with FUV flux (FUV = 1–100 G0) is established. Even when dividing the sample into disks around low-mass stars with M⋆ < 0.4 M⊙ and around high-mass stars with M⋆ > 0.4 M⊙, no significant correlation is observed in either group, as illustrated in Fig. 12. This is different from previous results for disks in the σ Orionis star-forming region, where the strong FUV radiation field (FUV = 102−105 G0) leads to a pronounced decrease in dust-disk mass with increasing FUV strength among high-mass stars, while disks around low-mass stars show little variation (Maucó et al. 2023). We emphasize that the results from Maucó et al. (2023) are for the dust-disk mass and where disks are exposed to a stronger FUV radiation field that was likely activated only recently (Coleman et al. 2025). The current results from the AGE-PRO Large Program using the gas-disk mass show no correlation between the gas-disk mass and the FUV flux (Anania et al. 2025a), as predicted by our models.
. Additionally, the power law changes slightly over time. For example, the power-law index decreases by ~14% from 1 Myr to 10 Myr for correlations between Mgas and R12CO,90%. Also, there is large scatter in the gas-disk mass (as illustrated in Fig. 10) due to the combination of different initial parameters. This scatter makes it challenging to identify such correlations from a limited observational sample. Similar to gas-disk mass, the scatter in the gas-disk radius is huge, as shown in Fig. 11. The strongest correlation is found between stellar mass and gas-disk radius. The observed decrease in gas-disk radius with increasing FUV flux is consistent with the expectation that stronger FUV radiation can truncate disks more effectively. However, the dependence of gas-disk radius on FUV flux does not extend to the gas-disk mass, for which no significant correlation with FUV flux (FUV = 1–100 G0) is established. Even when dividing the sample into disks around low-mass stars with M⋆ < 0.4 M⊙ and around high-mass stars with M⋆ > 0.4 M⊙, no significant correlation is observed in either group, as illustrated in Fig. 12. This is different from previous results for disks in the σ Orionis star-forming region, where the strong FUV radiation field (FUV = 102−105 G0) leads to a pronounced decrease in dust-disk mass with increasing FUV strength among high-mass stars, while disks around low-mass stars show little variation (Maucó et al. 2023). We emphasize that the results from Maucó et al. (2023) are for the dust-disk mass and where disks are exposed to a stronger FUV radiation field that was likely activated only recently (Coleman et al. 2025). The current results from the AGE-PRO Large Program using the gas-disk mass show no correlation between the gas-disk mass and the FUV flux (Anania et al. 2025a), as predicted by our models.
The stellar mass and FUV flux remain essentially uncorrelated throughout the 10 Myr evolution. Although the correlation coefficient r increases from ~0.08 at birth to ~0.16 at 10 Myr (as shown in Table C.1), the dependence is still very weak.
We compared each of our empirical correlations with AGE-PRO observations of ten disks in Upper Sco, for which AGE-PRO provided gas-disk masses and sizes (Agurto-Gangas et al. 2025). The left panel of Fig. 10 suggests that four targets of AGE-PRO, Upper Sco 1, 3, 8, and 10, align well with the correlation between gas-disk radius and mass. Upper Sco 9 has a larger gas-disk mass, whereas the others have a lower mass than expected. Upper Sco 5 also exhibits a lower gas-disk mass (right panel of Fig. 10) and a smaller gas-disk radius (left panel of Fig. 11) than expected for its stellar mass, which is possibly related to it being a binary (Trapman et al. 2025a). Upper Sco 6 also has a smaller gas-disk mass relative to the stellar mass. This may result from its cleared gas cavity (Vioque et al. 2025).
The right panel of Fig. 11 suggests that Upper Sco 1, 6, 7, 8, and 9 have larger gas-disk radii compared to the experienced FUV flux. It is worth noting that all of these disks manifest inner dust cavities (Vioque et al. 2025). Although Upper Sco 10 also exhibits substructures, it does not exhibit strong variation from a smooth disk. This indicates that disk substructures, which were neglected in our simulations, may play important roles in gas-disk evolution.
Furthermore, Upper Sco 1, 3, and 10 (marked in purple in Figs. 10 and 11) exhibit hints of MHD winds from the presence of detected [O I] λ 6300 line emission (Fang et al. 2023). These disks still largely follow the empirical correlations. Upper Sco 1 and 10 align well with the correlation between stellar mass, gas-disk mass, and radius, whereas Upper Sco 3 exhibits a systematically lower gas-disk mass and radius for its stellar mass and the local FUV flux. Nevertheless, the gas-disk mass of Upper Sco 3 still falls within the typical range for its stellar mass and radius at the given FUV flux. As Upper Sco 1 and 10 exhibit dust substructures, their relatively large gas-disk radii at the corresponding FUV flux are likely driven by these substructures in the presence of MHD winds.
We note that the targets in AGE-PRO have stellar masses between 0.1 and 0.6 M⊙, so we also restricted the results of the models to this range. The results for this restricted range of stellar mass are summarized in Fig. C.1. This gives a steeper slope for the correlations between gas-disk radius and mass and FUV strength and gas-disk radius. Still only four targets align well with our correlation between gas-disk size and mass.
Moreover, we checked the possible correlations between stellar mass and initial disk conditions. Gas-disk evolution gives rise to a tentative positive correlation (r ~ 0.5) between the stellar mass and the viscosity parameter (![Mathematical equation: $\[\alpha \propto M_{\star}^{0.65}\]$](/articles/aa/full_html/2026/05/aa58200-25/aa58200-25-eq14.png) ) among the surviving disks and a weak positive correlation (r ~ 0.2) between the stellar mass and the characteristic radius (
) among the surviving disks and a weak positive correlation (r ~ 0.2) between the stellar mass and the characteristic radius (![Mathematical equation: $\[R_{c} \propto M_{\star}^{0.17}\]$](/articles/aa/full_html/2026/05/aa58200-25/aa58200-25-eq15.png) ), with details shown in Table C.1. For low-mass stars, disks with higher viscosity and a larger characteristic radius are more efficiently dispersed by external photoevaporation, giving rise to the observed correlations between stellar mass, viscosity, and characteristic radius among the surviving disks.
), with details shown in Table C.1. For low-mass stars, disks with higher viscosity and a larger characteristic radius are more efficiently dispersed by external photoevaporation, giving rise to the observed correlations between stellar mass, viscosity, and characteristic radius among the surviving disks.
Since the IMF yields only a small number of high-mass stars in a randomly drawn sample, we also verify our results by drawing stellar masses from a uniform distribution while keeping all other parameters the same. Based on this modified setup, we performed an additional population synthesis with 5000 samples. Similar results were obtained, as summarized in Table C.2. However, adopting a uniform stellar mass distribution gives slightly different correlations. For example, the slope between the gas-disk size and gas-disk mass in log-log space at 5 Myr is ~22% less than that in the IMF case. In addition, the correlation between stellar mass and FUV strength remains negligible at 10 Myr, although its steady increase suggests that it may become significant at later evolutionary stages.
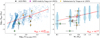 |
Fig. 10 Empirical correlations of gas-disk mass with gas-disk radius (left) and stellar mass (right) at 5 Myr. The blue marks values derived from simulations, and the black shows the values of ten targets in AGE-PRO. The red line is fit using a MCMC method, and the 1σ credible interval is marked in light red. Disks with substructures identified in AGE-PRO (Vioque et al. 2025) are shown in yellow, and those with MHD winds traced by the [O I] λ 6300 line (Fang et al. 2023) are highlighted in bright purple. |
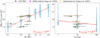 |
Fig. 11 Empirical correlations of gas-disk radius with stellar mass (left) and FUV flux (right) at 5 Myr, following the same format as Fig. 10. |
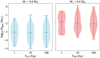 |
Fig. 12 Distribution of gas-disk mass over FUV strength of surviving disks at 5 Myr. The blue and red represent disks around low-mass stars with M⋆ < 0.4 M⊙ and high-mass stars with M⋆ > 0.4 M⊙. |
5 Discussion
5.1 A delayed effect of external photoevaporation
The FUV flux that protoplanetary disks are exposed to evolves over time, mainly driven by the evolution in FUV luminosity of the massive stars and cluster dynamics. Kunitomo et al. (2021) emphasized the critical role of stellar evolution in shaping the temporal variation of photoevaporation rates. For stars with masses between 0.5 and 5 M⊙, the FUV, EUV, and X-ray luminosities can vary by orders of magnitude within a few million years, leading to corresponding changes in the photoevaporation rates with time. Meanwhile, cluster dynamics change the relative distance between O, B stars and disks, thereby altering the FUV flux experienced by disks over time (Concha-Ramírez et al. 2019, 2023). Disks that are currently highly irradiated may have migrated from regions of lower irradiation, and conversely, some weakly irradiated disks may have originated in more strongly irradiated environments. The derived FUV flux from observations is the average of the FUV flux experienced by the disk, but what the FUV flux experienced at earlier times was remains unknown. In addition, the disk may be shielded by the dust at early stages. N-body simulations indicate that dust extinction can efficiently shield disks in the first <1 Myr (Ali & Harries 2019; Qiao et al. 2022; Wilhelm et al. 2023).
To investigate the delayed effect of external photoevaporation, we performed a test whereby we turned on the external FUV flux at 1 Myr in all our models. No obvious differences in disk properties are observed shortly after the onset of external photoevaporation. The disks quickly evolve toward the same masses and radii as those predicted by models where photoevaporation is active from the beginning. The primary difference lies in the disk fraction; see Fig. 13. Prior to 1 Myr, no disks were dispersed, as the disks in our models were not dispersed until ~3 Myr under purely viscous evolution. After the activation of external photoevaporation, the evolution of the disk fraction follows the same trend as in models with continuous exposure to external FUV radiation from the outset. Nevertheless, at a given evolutionary stage, the disk fraction is systematically higher compared to models in which external photoevaporation is initiated at the onset.
5.2 Survivorship bias
Figure 6 shows that the gas-disk mass of surviving disks exhibits only limited evolution after 0.2 Myr, suggesting survivorship bias. Such survivorship bias is also evident in the case of internal photoevaporation; inside-out dispersal significantly raises the median mass of the surviving population by rapidly removing low-mass disks, while outside-in dispersal of compact and light disks (Rc ~ 10 AU) results in an almost constant median mass over time (Malanga et al. 2025). In our scenario, external radiation keeps removing disk material from the outer edge. Although low-mass disks disperse faster, potentially raising the median mass of survivors, this effect is counterbalanced by the overall mass loss from the population. As a result, the gas mass shows little evolution after 0.2 Myr.
A similar survivorship bias is also observed in the gas-disk size, which correlates with mass. Disks truncated to small radii by external photoevaporation are rapidly dispersed. As a result, disk dispersal offsets the shrinkage of most disks, keeping the median gas-disk radius nearly constant after the first ~0.2 Myr. At later times of ~9 Myr, the median gas-disk radius increases, because the surviving disks are those able to sustain long-term viscous spreading despite ongoing external photoevaporation.
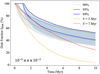 |
Fig. 13 Decline in disk fraction, fdisk, with the disk age. Same layout as Fig. 3. The gray and blue correspond to turning on external photoevaporation initially and at 1 Myr. |
5.3 Constraints on disk properties
The comparison of our models with the observed disk fraction and gas-disk size distribution predicts different ranges for the disk viscosity, α. Figure 3 favors a higher viscosity (10−4 ≤ α ≤ 10−2) as it leads to rapid disk dispersal. In contrast, Fig. 8 indicates that a lower viscosity (10−5 ≤ α ≤ 10−2) is required to produce a large population of compact disks (R12CO,90% < 36 AU), which is more consistent with the observations. In this section, we discuss possible scenarios to reconcile these two ranges.
Building on the different preferences for viscosity, we further examined the possible dependence on the initial disk characteristic radius, Rc. For a viscosity of 10−5 ≤ α ≤ 10−2, initially extended disks (150 ≤ Rc ≤ 200 AU) can reproduce the observed fractions but evolve into larger disks, whereas for 10−4 ≤ α ≤ 10−2, initially compact disks (10 ≤ Rc ≤ 30 AU) can increase the fraction of compact disks with R12CO,90% < 36 AU, but disperse more slowly, as demonstrated in Figs. D.1 and D.2. The initial disk-to-star mass ratio, ϵ, also affects both the disk fraction and gas-disk size distribution, but its influence is weaker than that of Rc and far less significant than that of viscosity. These results indicate that varying the constraints on viscosity parameter and characteristic radius alone cannot fully account for the observed trends. The dependence of disk fraction and gas-disk size distribution on viscosity and characteristic radius also indicates a possible degeneracy between Rc and α; initially compact disks with high viscosity and extended disks with low viscosity can produce similar outcomes in both disk fraction and gas-disk size. Coleman et al. (2026) constrained the viscosity of a disk in Orion (d203-504) by combining the stellar accretion rate, external photoevaporative mass-loss rate, stellar mass, and disk size and mass, finding 3 × 10⁻⁴ ≤ α ≤ 2 × 10⁻³. This viscosity range fails to reproduce both the rapid dispersal of disks and the observed large population of compact disks. The initial conditions in Upper Sco may differ from those in Orion, making a direct comparison between the two regions nontrivial. Additional constraints on the wind mass-loss rate and mass-accretion rate may provide tighter constraints on disk properties (Winter et al. 2020; Weder et al. 2026).
A promising way to reconcile the two viscosity ranges may lie in the potential correlation between the mass-accretion rate and stellar mass. Observations reveal a strong correlation between the stellar mass and accretion rate, scaling as ![Mathematical equation: $\[\dot{M}_{\text {acc }} \propto M_{\star}^{2}\]$](/articles/aa/full_html/2026/05/aa58200-25/aa58200-25-eq16.png) . This trend can be reproduced by disk-evolution models that include a relation between the viscosity parameter, α, and the stellar mass, such as α ∝ M⋆ (Alexander & Armitage 2006). Figure 14 compares the PDF of gas-disk sizes for the constant viscosity α = 10−3 (black) and mass-dependent viscosity α = 10−3 M⋆/M⊙ (red). The mass-dependent scenario effectively reduces the viscosity for disks around low-mass stars, producing more small disks. Conversely, with constant viscosity, the minimum gas-disk size among our samples is ~77 AU, corresponding to the disk around a 0.3 M⊙ star. With a viscosity of α = 10−3, all disks around 0.1 M⊙ stars are dispersed by 5 Myr. These are also the ones that tend to have smaller radii, which is inferred from the strong correlation between stellar mass and gas-disk radius in Sect. 4.4. This suggests that the commonly adopted assumption of α = 10−3 in viscous evolution models may not be suitable or that additional mechanisms are required to ensure the survival of disks around low-mass stars under such viscosity. Those disks around low-mass stars in particular deserve special attention, as they are generally smaller and dominate the overall evolution of disk fractions given the large number of low-mass stars predicted by the IMF.
. This trend can be reproduced by disk-evolution models that include a relation between the viscosity parameter, α, and the stellar mass, such as α ∝ M⋆ (Alexander & Armitage 2006). Figure 14 compares the PDF of gas-disk sizes for the constant viscosity α = 10−3 (black) and mass-dependent viscosity α = 10−3 M⋆/M⊙ (red). The mass-dependent scenario effectively reduces the viscosity for disks around low-mass stars, producing more small disks. Conversely, with constant viscosity, the minimum gas-disk size among our samples is ~77 AU, corresponding to the disk around a 0.3 M⊙ star. With a viscosity of α = 10−3, all disks around 0.1 M⊙ stars are dispersed by 5 Myr. These are also the ones that tend to have smaller radii, which is inferred from the strong correlation between stellar mass and gas-disk radius in Sect. 4.4. This suggests that the commonly adopted assumption of α = 10−3 in viscous evolution models may not be suitable or that additional mechanisms are required to ensure the survival of disks around low-mass stars under such viscosity. Those disks around low-mass stars in particular deserve special attention, as they are generally smaller and dominate the overall evolution of disk fractions given the large number of low-mass stars predicted by the IMF.
Although higher viscosity in disks around more massive stars can accelerate their dispersal, our test with α = 10−3M⋆/M⊙ still leads to relatively slow evolution. A more detailed study of viscosity and its possible dependence on stellar mass is therefore needed to better explain both the observed disk fraction and distribution of gas-disk sizes. Furthermore, additional processes such as internal photoevaporation or MHD winds, which are neglected in the current simulations, may accelerate disk dispersal, as discussed in Sect. 5.5.
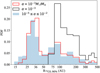 |
Fig. 14 PDF of the gas-disk radius, R12CO,90%, of surviving disks at 5 Myr, assuming a constant viscosity of α = 10−3 (black) and a mass-dependent prescription of α = 10−3 M⋆/M⊙ (red). The blue represents the whole population synthesis sample with a viscosity of 10−5 ≤ α ≤ 10−2. |
5.4 Disk substructures
Our comparison of the empirical correlations from our population synthesis models with the AGE-PRO results in Upper Sco showed that disk substructures may play an important role in disk evolution. Disk substructures can be the result of dust trapping in pressure maxima, where grains reduce or stop their radial drift (Pinilla et al. 2012). Gárate et al. (2024) studied the survival and effect of dust traps on the evolution of disks that are exposed to external photoevaporation with a FUV in the 102−104 G0 range. They found that if dust traps are located inside the photoevaporation truncation radius and FUV ≤ 103 G0, the presence of dust traps can extend the lifetime of the dust component. Moreover, the dust trap can alter the grain size distribution within the disk, in particular fragmentation of dust grains within pressure bumps can lead to a constant replenishment of small grains that can be easily entrained in the photoevaporative wind, possibly providing shielding against FUV radiation since early times of evolution (<0.1 Myr). This shielding may reduce the efficiency of external photoevaporation, allowing the gas disk to remain large and evolve similarly to the purely viscous case. Consequently, our models that neglect dust substructures in the disk evolution may underestimate both the gas-disk radius and mass. The right panel of Fig. 11 suggests that this is the case for Upper Sco 1, 6, 7, 8, 9, and 10, which are disks with substructures (Vioque et al. 2025) that exhibit larger gas-disk radii compared to the correlation from our simulations. The inclusion of structures and dust evolution in population synthesis models that include external photoevaporation is important for understanding how substructures may change the disk lifetime and the properties of the surviving disks.
5.5 Additional processes affecting disk evolution
Additional mechanisms neglected in our model, such as internal photoevaporation and MHD winds, can also affect disk evolution. Their potential impacts are briefly listed below.
Internal photoevaporation. X-ray and FUV radiation from the central star can trigger a thermal wind and remove disk material. Generally, a gap will open when the photoevaporation rate and accretion rate become comparable, typically after a few million year. Then, the inner disk drains onto the central star at its local viscous timescale, clearing the outer disk rapidly within ~1 Myr (Clarke et al. 2001; Picogna et al. 2019). This process reduces the fraction of surviving disks. Coleman & Haworth (2022) demonstrated that when the external photoevaporative mass-loss rate is below ~10−8 M⊙ yr−1 (FUV ~ 1000 G0), internal processes can significantly influence disk evolution. The extent of this impact depends on the radiation from the central star, as well as the disk viscosity and stellar mass, with internal photoevaporation becoming increasingly dominant for disks around higher mass stars and at higher viscosities. As disks around high-mass stars also tend to have larger radii, internal photoevaporation may reduce the population of large gas disks with radii of R12CO,90% > 150 AU.
Tabone et al. (2025) modeled disk viscous evolution including internal photoevaporation, but not external photoevaporation, and found that initially compact (Rc~ 5–20 AU) disks with low mass-loss rates and relatively long viscous timescales (α ~ 2–4 × 10⁻⁴) successfully reproduce the average gas-disk sizes observed in Lupus – but not those in Upper Sco from the AGE-PRO Large Program – and overestimate the apparent lifetime ![Mathematical equation: $\[(M / \dot{M})\]$](/articles/aa/full_html/2026/05/aa58200-25/aa58200-25-eq17.png) . External photoevaporation can help to reduce this apparent lifetime particularly in strong FUV environments. Therefore, models combining both internal and external photoevaporation may help to explain the observed distributions.
. External photoevaporation can help to reduce this apparent lifetime particularly in strong FUV environments. Therefore, models combining both internal and external photoevaporation may help to explain the observed distributions.
MHD winds. Apart from internal photoevaporation, MHD winds launched from the disk’s surface along magnetic-field lines can also influence disk evolution. These winds are common and can contribute significantly to the disk’s mass loss. Fang et al. (2023) revealed the presence of MHD winds by the detection of emission of the [O I] λ 6300 line in several Upper Sco disks. However, among the AGE-PRO targets with detected MHD winds (Upper Sco 1, 3, and 10), only Upper Sco 3 has a lower gas-disk mass and radius at the given stellar mass and the experienced FUV flux; this is illustrated in Figs. 10 and 11. Notably, disks 1 and 10 exhibit substructures. This may suggest that, even in the presence of MHD winds and external photoevaporation, substructures can act to mitigate the loss of disk material.
Our simulations indicate that the median gas-disk mass of the surviving disks remains nearly constant after 0.2 Myr, reflecting survivorship bias. MHD winds are predicted not to increase the disk’s radius as it evolves (Yang & Bai 2021; Trapman et al. 2022). Although viscously evolving disks tend to have slightly larger gas-disk radii than MHD wind–driven disks at late evolutionary stages of ~10 Myr, the difference is small (Coleman et al. 2024; Weder et al. 2026; Pichierri et al. 2026). Moreover, the gas-disk radius exhibits large scatter due to the combination of different initial disk parameters (Figs. 10 and 11). Therefore, under weak external photoevaporation levels of ~10 G0, the gas-disk size alone cannot serve as a robust diagnostic to distinguish between viscous evolution and MHD winds (Coleman et al. 2024; Weder et al. 2026).
Tabone et al. (2022) demonstrated that in the MHD-wind scenario, the median gas-disk mass undergoes a steady decrease as the disk population evolves, resulting from ongoing accretion-driven depletion. Therefore, the time evolution of gas-disk mass may offer a diagnostic with which to distinguish between different disk-evolution scenarios: inside-out viscous evolution, which leads to an obvious increase in the median mass of the surviving disks; outside-in dispersal, where the median mass remains nearly constant with slight increase; and MHD winds, which instead drive a decrease in median gas-disk mass. However, since Tabone et al. (2022) did not account for external photoevaporation, the decreasing trend of the median gas-disk mass predicted by MHD wind-driven models may be altered, and this needs to be investigated in the future. More complex models with disk substructures, internal photoevaporation, and MHD winds are necessary to better understand disk evolution.
6 Conclusions
In this work, we carried out population synthesis models of the gas evolution of disks exposed to mild values of external FUV flux (FUV = 1–100 G0), and we explored the following initial conditions: stellar mass distributed as the IMF, disk viscosity (α), disk mass, and characteristic disk radius (Rc). We aimed to constrain the properties of the disks that survive up to 5–10 Myr of evolution and determine how the disk fraction changes over time. We compared our stellar mass distribution and gas-disk size distribution with the sample of Carpenter et al. (2025), as well as with the gas-disk masses and sizes of the ten targets in Upper Sco from the AGE-PRO Large Program. Our conclusions are listed below:
Observations referring to the disk fraction in star-forming regions of different ages yielded disk lifetimes of ~3–7 Myr. Our population synthesis can explain the observed exponential trend, particularly for viscosities in the range of 10−4 ≤ α ≤ 10−2 (Fig. 3);
The percentage of surviving disks around stars of mass 0.1 M⊙ decreases over time, as the gas in disks around less massive stars is less gravitationally bound; hence, it is more easily entrained in photoevaporative winds. Initially, the percentage of stars in the sample around 0.1 M⊙ was 76%, and it was only around 51% after 10 Myr of evolution, which is about 21% lower than what is observed in the Upper Sco region. This significant decrease in the number of surviving disks is not found for more massive stars (Fig. 4);
The majority of disks that survived 5–10 Myr require low viscosity (α < 10−3.5) and a small characteristic radius (Rc < 125 AU), as low viscosity and a small Rc result in more compact disks that are more gravitationally bound and less vulnerable to mass loss by external photoevaporation (Fig. 5). In addition, surviving disks do not show a significant preference for higher initial disk-to-star mass ratios;
The median gas-disk mass of the surviving disks decreases sharply within the first 0.2 Myr of evolution and increases slightly thereafter, reflecting survivorship bias;
The gas-disk size distribution of the disk population also exhibits survivorship bias, with its median value dropping sharply after 0.2 Myr and remaining nearly constant throughout the subsequent evolution. Higher viscosity, 10−4 ≤ α ≤ 10−2, fails to produce the large population of compact disks found in the sample of Carpenter et al. (2025) in Upper Sco (Fig. 8);
We investigated potential correlations between observable quantities. We find a moderate correlation (r ~ 0.6) between Mgas and R12CO,90% (
![Mathematical equation: $\[M_{\text {gas}} \propto R_{{ }^{12} \mathrm{CO}, 90 \%}^{1.58}\]$](/articles/aa/full_html/2026/05/aa58200-25/aa58200-25-eq18.png) ) and a tentative correlation (r ~ 0.5) between Mgas and stellar mass M⋆ (
) and a tentative correlation (r ~ 0.5) between Mgas and stellar mass M⋆ (![Mathematical equation: $\[M_{\text {gas}} \propto M_{\star}^{1.29}\]$](/articles/aa/full_html/2026/05/aa58200-25/aa58200-25-eq19.png) ). The correlation between Mgas and FUV is negligible (r ~ 0.04), which is consistent with the findings of the AGE-PRO collaboration (Anania et al. 2025a). Moreover, there is a strong correlation (r ~ 0.9) between R12CO,90% and
). The correlation between Mgas and FUV is negligible (r ~ 0.04), which is consistent with the findings of the AGE-PRO collaboration (Anania et al. 2025a). Moreover, there is a strong correlation (r ~ 0.9) between R12CO,90% and ![Mathematical equation: $\[M_{\star}\left(R_{{ }^{12} \mathrm{CO}, 90 \%} \propto M_{\star}^{0.87}\right)\]$](/articles/aa/full_html/2026/05/aa58200-25/aa58200-25-eq20.png) and a very weak negative correlation (r ~ −0.2) between R12CO,90% and FUV strength (
and a very weak negative correlation (r ~ −0.2) between R12CO,90% and FUV strength (![Mathematical equation: $\[R_{{ }^{12} \mathrm{CO}, 90 \%} \propto F_{\mathrm{UV}}^{-0.14}\]$](/articles/aa/full_html/2026/05/aa58200-25/aa58200-25-eq21.png) ; Figs. 10 and 11).
; Figs. 10 and 11).
This work highlights the importance of the process of external photoevaporation at a disk population level, even in the presence of mild levels of FUV radiation fields (FUV = 1–100 G0), as in the case of Upper Sco. To constrain the models and the disk parameters, further observations of gas disk’s properties, especially mass and size, are needed. Moreover, as disks with substructures exhibit larger gas-disk radii than expected for a given FUV flux (Fig. 11), our results emphasize that additional mechanisms, in particular disk substructures, should be incorporated into population synthesis models.
Acknowledgements
We thank the referee for useful comments and suggestions that helped improve the manuscript’s quality. RA acknowledges funding from the Fondazione Cariplo, grant no. 2022-1217, and the European Research Council (ERC) under the European Union’s Horizon Europe Research & Innovation Programme under grant agreement no. 101039651 (DiscEvol). Views and opinions expressed are however those of the author(s) only, and do not necessarily reflect those of the European Union or the European Research Council Executive Agency. Neither the European Union nor the granting authority can be held responsible for them. PP acknowledges funding from the UK Research and Innovation (UKRI) under the UK government’s Horizon Europe funding guarantee from ERC (under grant agreement No. 101076489).
References
- Agurto-Gangas, C., Pérez, L. M., Sierra, A., et al. 2025, ApJ, 989, 4 [Google Scholar]
- Alexander, R. D., & Armitage, P. J. 2006, ApJ, 639, L83 [Google Scholar]
- Ali, A. A., & Harries, T. J. 2019, MNRAS, 487, 4890 [NASA ADS] [CrossRef] [Google Scholar]
- Allen, M., Anania, R., Andersen, M., et al. 2025, Open J. Astrophys., 8, 54 [Google Scholar]
- Anania, R., Rosotti, G. P., Gárate, M., et al. 2025a, ApJ, 989, 8 [Google Scholar]
- Anania, R., Winter, A. J., Rosotti, G., et al. 2025b, A&A, 695, A74 [NASA ADS] [CrossRef] [EDP Sciences] [Google Scholar]
- Armstrong, J. J., Tan, J. C., Wright, N. J., et al. 2025, MNRAS, 543, 2349 [Google Scholar]
- Bai, X.-N., & Stone, J. M. 2013, ApJ, 769, 76 [Google Scholar]
- Baraffe, I., Homeier, D., Allard, F., & Chabrier, G. 2015, A&A, 577, A42 [NASA ADS] [CrossRef] [EDP Sciences] [Google Scholar]
- Blandford, R. D., & Payne, D. G. 1982, MNRAS, 199, 883 [CrossRef] [Google Scholar]
- Carpenter, J. M., Esplin, T. L., Luhman, K. L., Mamajek, E. E., & Andrews, S. M. 2025, ApJ, 978, 117 [Google Scholar]
- Chabrier, G. 2003, PASP, 115, 763 [Google Scholar]
- Clarke, C. J. 2007, MNRAS, 376, 1350 [NASA ADS] [CrossRef] [Google Scholar]
- Clarke, C. J., Gendrin, A., & Sotomayor, M. 2001, MNRAS, 328, 485 [NASA ADS] [CrossRef] [Google Scholar]
- Coleman, G. A. L., & Haworth, T. J. 2022, MNRAS, 514, 2315 [NASA ADS] [CrossRef] [Google Scholar]
- Coleman, G. A. L., Mroueh, J. K., & Haworth, T. J. 2024, MNRAS, 527, 7588 [Google Scholar]
- Coleman, G. A. L., Haworth, T. J., & Kim, J. S. 2025, MNRAS, 544, L70 [Google Scholar]
- Coleman, G. A. L., Haworth, T. J., Schroetter, I., & Berné, O. 2026, MNRAS, 545, staf2015 [Google Scholar]
- Concha-Ramírez, F., Wilhelm, M. J. C., Portegies Zwart, S., & Haworth, T. J. 2019, MNRAS, 490, 5678 [CrossRef] [Google Scholar]
- Concha-Ramírez, F., Wilhelm, M. J. C., & Portegies Zwart, S. 2023, MNRAS, 520, 6159 [Google Scholar]
- Delfini, L., Vioque, M., Ribas, Á., & Hodgkin, S. 2025, A&A, 699, A145 [NASA ADS] [CrossRef] [EDP Sciences] [Google Scholar]
- Deng, D., Vioque, M., Pascucci, I., et al. 2025, ApJ, 989, 3 [Google Scholar]
- Dotter, A., Chaboyer, B., Jevremović, D., et al. 2008, ApJS, 178, 89 [Google Scholar]
- Ercolano, B., Drake, J. J., Raymond, J. C., & Clarke, C. C. 2008, ApJ, 688, 398 [Google Scholar]
- Esplin, T. L., Luhman, K. L., Miller, E. B., & Mamajek, E. E. 2018, AJ, 156, 75 [NASA ADS] [CrossRef] [Google Scholar]
- Facchini, S., Clarke, C. J., & Bisbas, T. G. 2016, MNRAS, 457, 3593 [NASA ADS] [CrossRef] [Google Scholar]
- Fang, M., & Herczeg, G. J. 2025, ApJ, 994, 248 [Google Scholar]
- Fang, M., Pascucci, I., Edwards, S., et al. 2023, ApJ, 945, 112 [NASA ADS] [CrossRef] [Google Scholar]
- Fedele, D., van den Ancker, M. E., Henning, T., Jayawardhana, R., & Oliveira, J. M. 2010, A&A, 510, A72 [NASA ADS] [CrossRef] [EDP Sciences] [Google Scholar]
- Gárate, M., Pinilla, P., Haworth, T. J., & Facchini, S. 2024, A&A, 681, A84 [NASA ADS] [CrossRef] [EDP Sciences] [Google Scholar]
- Guarcello, M. G., Drake, J. J., Wright, N. J., et al. 2023, ApJS, 269, 13 [NASA ADS] [CrossRef] [Google Scholar]
- Haworth, T. J., Coleman, G. A. L., Qiao, L., Sellek, A. D., & Askari, K. 2023, MNRAS, 526, 4315 [NASA ADS] [CrossRef] [Google Scholar]
- Kelly, B. C. 2007, ApJ, 665, 1489 [Google Scholar]
- Kroupa, P. 2001, MNRAS, 322, 231 [NASA ADS] [CrossRef] [Google Scholar]
- Kroupa, P. 2002, Science, 295, 82 [Google Scholar]
- Kunitomo, M., Ida, S., Takeuchi, T., et al. 2021, ApJ, 909, 109 [NASA ADS] [CrossRef] [Google Scholar]
- Luhman, K. L. 2022, AJ, 163, 25 [NASA ADS] [CrossRef] [Google Scholar]
- Luhman, K. L., & Esplin, T. L. 2020, AJ, 160, 44 [Google Scholar]
- Lynden-Bell, D., & Pringle, J. E. 1974, MNRAS, 168, 603 [Google Scholar]
- Malanga, L. A., Rosotti, G. P., Lodato, G., et al. 2025, A&A, 699, A292 [NASA ADS] [CrossRef] [EDP Sciences] [Google Scholar]
- Mamajek, E. E. 2009, in American Institute of Physics Conference Series, 1158, Exoplanets and Disks: Their Formation and Diversity, eds. T. Usuda, M. Tamura, & M. Ishii (AIP), 3 [Google Scholar]
- Manara, C. F., Ansdell, M., Rosotti, G. P., et al. 2023, in Astronomical Society of the Pacific Conference Series, 534, Protostars and Planets VII, eds. S. Inutsuka, Y. Aikawa, T. Muto, K. Tomida, & M. Tamura, 539 [Google Scholar]
- Maschberger, T. 2013, MNRAS, 429, 1725 [NASA ADS] [CrossRef] [Google Scholar]
- Maucó, K., Manara, C. F., Ansdell, M., et al. 2023, A&A, 679, A82 [NASA ADS] [CrossRef] [EDP Sciences] [Google Scholar]
- Pecaut, M. J., Mamajek, E. E., & Bubar, E. J. 2012, ApJ, 746, 154 [Google Scholar]
- Pfalzner, S., Dehghani, S., & Michel, A. 2022, ApJ, 939, L10 [NASA ADS] [CrossRef] [Google Scholar]
- Pichierri, G., Rosotti, G., Anania, R., & Lodato, G. 2026, A&A, 707, A74 [NASA ADS] [CrossRef] [EDP Sciences] [Google Scholar]
- Picogna, G., Ercolano, B., Owen, J. E., & Weber, M. L. 2019, MNRAS, 487, 691 [Google Scholar]
- Pinilla, P., Birnstiel, T., Ricci, L., et al. 2012, A&A, 538, A114 [NASA ADS] [CrossRef] [EDP Sciences] [Google Scholar]
- Pinilla, P., Sierra, A., Kurtovic, N. T., et al. 2025, MNRAS, 543, 2723 [Google Scholar]
- Pringle, J. E. 1981, ARA&A, 19, 137 [Google Scholar]
- Qiao, L., Haworth, T. J., Sellek, A. D., & Ali, A. A. 2022, MNRAS, 512, 3788 [NASA ADS] [CrossRef] [Google Scholar]
- Ratzenböck, S., Großschedl, J. E., Alves, J., et al. 2023, A&A, 678, A71 [NASA ADS] [CrossRef] [EDP Sciences] [Google Scholar]
- Ribas, Á., Bouy, H., & Merín, B. 2015, A&A, 576, A52 [NASA ADS] [CrossRef] [EDP Sciences] [Google Scholar]
- Sellek, A. D., Booth, R. A., & Clarke, C. J. 2020, MNRAS, 492, 1279 [NASA ADS] [CrossRef] [Google Scholar]
- Sellek, A. D., Grassi, T., Picogna, G., et al. 2024, A&A, 690, A296 [NASA ADS] [CrossRef] [EDP Sciences] [Google Scholar]
- Shakura, N. I., & Sunyaev, R. A. 1973, A&A, 24, 337 [NASA ADS] [Google Scholar]
- Stammler, S. M., & Birnstiel, T. 2022, ApJ, 935, 35 [NASA ADS] [CrossRef] [Google Scholar]
- Tabone, B., Rosotti, G. P., Cridland, A. J., Armitage, P. J., & Lodato, G. 2022, Secular evolution of MHD wind-driven discs: analytical solutions in the expanded α-framework [Google Scholar]
- Tabone, B., Rosotti, G. P., Trapman, L., et al. 2025, ApJ, 989, 7 [Google Scholar]
- Trapman, L., Tabone, B., Rosotti, G., & Zhang, K. 2022, ApJ, 926, 61 [NASA ADS] [CrossRef] [Google Scholar]
- Trapman, L., Rosotti, G., Zhang, K., & Tabone, B. 2023, ApJ, 954, 41 [NASA ADS] [CrossRef] [Google Scholar]
- Trapman, L., Vioque, M., Kurtovic, N. T., et al. 2025a, ApJ, 989, 10 [Google Scholar]
- Trapman, L., Zhang, K., Rosotti, G. P., et al. 2025b, ApJ, 989, 5 [Google Scholar]
- Vioque, M., Kurtovic, N. T., Trapman, L., et al. 2025, ApJ, 989, 9 [Google Scholar]
- Weder, J., Winter, A. J., & Mordasini, C. 2026, A&A, 705, A102 [NASA ADS] [CrossRef] [EDP Sciences] [Google Scholar]
- Wilhelm, M. J. C., Portegies Zwart, S., Cournoyer-Cloutier, C., et al. 2023, MNRAS, 520, 5331 [NASA ADS] [CrossRef] [Google Scholar]
- Winter, A. J., & Haworth, T. J. 2022, Eur. Phys. J. Plus, 137, 1132 [NASA ADS] [CrossRef] [Google Scholar]
- Winter, A. J., Ansdell, M., Haworth, T. J., & Kruijssen, J. M. D. 2020, MNRAS, 497, L40 [CrossRef] [Google Scholar]
- Yang, H., & Bai, X.-N. 2021, ApJ, 922, 201 [CrossRef] [Google Scholar]
- Zagaria, F., Facchini, S., Miotello, A., et al. 2023, A&A, 672, L15 [CrossRef] [EDP Sciences] [Google Scholar]
- Zallio, L., Rosotti, G. P., Vioque, M., et al. 2026, A&A, 705, A49 [NASA ADS] [CrossRef] [EDP Sciences] [Google Scholar]
- Zhang, K., Pérez, L. M., Pascucci, I., et al. 2025, ApJ, 989, 1 [Google Scholar]
Appendix A Variable luminosity
In this appendix we illustrate the time evolution of disk fraction when the luminosity of the central star evolves over time.
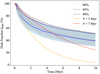 |
Fig. A.1 Decline in disk fraction (fdisk) with the disk age. Similar layout as Fig. 3. The gray and blue represent constant luminosity for stars at the age of 5 Myr and luminosity that evolves following the evolutionary track by Dotter et al. (2008). |
Appendix B Disk fraction
In this appendix we demonstrate the disk fraction considering different ranges of viscosity α.
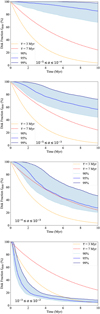 |
Fig. B.1 Disk fraction with the disk age limited to different ranges of viscosity (α). Same layout as Fig. 3. |
Appendix C Empirical correlations
In this appendix we restrict our samples to the disks around 0.1–0.6 M⊙ stars to compare with the ten targets studied by the AGE-PRO ALMA Large Program. The resulting correlations between the gas-disk radius and mass, the FUV flux and gas-disk radius are demonstrated in Fig. C.1.
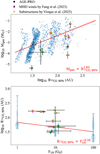 |
Fig. C.1 Empirical correlations between the gas-disk mass and radius (top), the FUV flux and gas-disk radius (bottom) at 5 Myr, restricted to disks around 0.1–0.6 M⊙ stars. Same layout as Figs. 10 and 11. |
We also show the correlation between surviving disk and stellar properties at different times of disk evolution. Table C.1 demonstrates the empirical correlations with stellar mass drawn from the IMF, which is discussed in Sect. 4.4. And Table C.2 shows the empirical correlations similar to Table C.1 but with stellar mass drawn from a uniform distribution to avoid the bias from small number of high-mass stars given by the IMF. Table C.2 gives similar results as Table C.1, with differences in the slope and correlation coefficient. For example, uniform stellar mass distribution gives steeper correlation between gas-disk radius and FUV strength, ~ 42% steeper at 5 Myr. And for uniform stellar mass distribution, the slope remains nearly constant between 5 and 10 Myr, while for the IMF, the slope decreases by ~ 36%.
Correlations between surviving disk and stellar properties at different ages of disk evolution considering the IMF.
Correlations between surviving disk and stellar properties at different ages of disk evolution considering the uniform stellar mass distribution, constructed in the same way as Table 10.
Appendix D Dependence on characteristic radius
In this appendix we check how the disk fraction and gas-disk size distribution depend on the characteristic radius, considering the two viscosity ranges inferred from the disk fraction (10−4 ≤ α ≤ 10−2) and gas-disk size distribution (10−5 ≤ α ≤ 10−2).
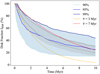 |
Fig. D.1 Decline in disk fraction (fdisk) with the disk age under different constraints on initial viscosity (α) and characteristic radius (Rc). The blue and gray only consider disks with 10−5 ≤ α ≤ 10−2 and 150 ≤ Rc ≤ 200 AU, 10−4 ≤ α ≤ 10−2 and 10 ≤ Rc ≤ 30 AU, respectively. Others following the same format as Fig. 3. |
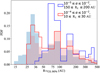 |
Fig. D.2 PDF of the gas-disk radius R12CO,90% for surviving disks at 5 Myr with constraints on initial disk properties. The blue and red represent disks with viscosity 10−5 ≤ α ≤ 10−2 and 10−4 ≤ α ≤ 10−2, respectively. The shaded region marks the disks with characteristic radius 10 ≤ Rc ≤ 200 AU, and solid lines highlight those with 150 ≤ Rc ≤ 200 AU (blue) and 10 ≤ Rc ≤ 30 AU (red). |
All Tables
Correlations between surviving disk and stellar properties at different ages of disk evolution considering the IMF.
Correlations between surviving disk and stellar properties at different ages of disk evolution considering the uniform stellar mass distribution, constructed in the same way as Table 10.
All Figures
|
Fig. 1 PDF of external FUV flux FUV, fit with log-normal distribution. Light, medium, and dark blue lines represent 16th, median, and 84th values of the FUV flux in the Upper Sco star forming region, respectively. The red line enclosing the blue lines shows the distribution from which we draw FUV flux, FUV, in our models. |
| In the text | |
|
Fig. 2 PDF of stellar mass, M⋆, for the 169 disk-bearing stars in Upper Sco by Carpenter et al. (2025). The stellar masses are presented in Pinilla et al. (2025). |
| In the text | |
|
Fig. 3 Decline in disk fraction, fdisk, with disk age. Blue lines show the disk fraction considering disk dispersal when losing 90% (light), 95% (medium), and 99% (dark) of the initial mass. The red points correspond to the observed disk fractions of nearby clusters within 200 pc, and the dashed line is the fit exponential decay, f(t) = exp(−t/τ), yielding τ = 7 Myr from Pfalzner et al. (2022). The yellow points are from Fedele et al. (2010), giving τ = 3 Myr. The top and bottom panels correspond to disks with viscosity ranges of 10−5 ≤ α ≤ 10−2 and 10−4 ≤ α ≤ 10−2, respectively. The χ2 values are shown in the bottom left of each figure. |
| In the text | |
|
Fig. 4 The percentage of surviving disks in each stellar mass bin from our simulations at 5 (red) and 10 (orange) Myr of disk evolution, compared to the 169 samples (blue) from Carpenter et al. (2025). The stellar masses are presented in Pinilla et al. (2025). |
| In the text | |
|
Fig. 5 Distribution of disks with certain characteristic radius, Rc, and viscosity parameter, α, that survive after 5 Myr of evolution, assuming that the gas disk is dispersed when losing 90% of the initial mass. The red and blue lines represent the distributions at birth and 5 Myr, respectively. |
| In the text | |
|
Fig. 6 Time evolution of the median gas-disk mass, Mgas. The blue line shows the evolution of the entire sample, adopting 90% gas-disk mass loss as the dispersal criterion. The red lines refer to surviving disks only, with dark, medium, and light red corresponding to dispersal defined by 90%, 95%, and 99% of the gas-disk mass loss, respectively. |
| In the text | |
|
Fig. 7 Cumulative distribution function (CDF) of |
| In the text | |
|
Fig. 8 The PDF of the gas-disk radius R12CO,90% for surviving disks at 5 (red) and 10 (orange) Myr, compared with observation by Carpenter et al. (2025, blue). The gray line marks the unresolved disks with upper limit radius 0.25″, and the dashed blue line includes all the disks. The purple line shows models with a viscosity of 10−4 ≤ α ≤ 10−2. |
| In the text | |
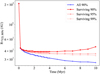 |
Fig. 9 Time evolution of median gas-disk radius, R12CO,90%. Same layout as Fig. 6. |
| In the text | |
|
Fig. 10 Empirical correlations of gas-disk mass with gas-disk radius (left) and stellar mass (right) at 5 Myr. The blue marks values derived from simulations, and the black shows the values of ten targets in AGE-PRO. The red line is fit using a MCMC method, and the 1σ credible interval is marked in light red. Disks with substructures identified in AGE-PRO (Vioque et al. 2025) are shown in yellow, and those with MHD winds traced by the [O I] λ 6300 line (Fang et al. 2023) are highlighted in bright purple. |
| In the text | |
|
Fig. 11 Empirical correlations of gas-disk radius with stellar mass (left) and FUV flux (right) at 5 Myr, following the same format as Fig. 10. |
| In the text | |
|
Fig. 12 Distribution of gas-disk mass over FUV strength of surviving disks at 5 Myr. The blue and red represent disks around low-mass stars with M⋆ < 0.4 M⊙ and high-mass stars with M⋆ > 0.4 M⊙. |
| In the text | |
|
Fig. 13 Decline in disk fraction, fdisk, with the disk age. Same layout as Fig. 3. The gray and blue correspond to turning on external photoevaporation initially and at 1 Myr. |
| In the text | |
|
Fig. 14 PDF of the gas-disk radius, R12CO,90%, of surviving disks at 5 Myr, assuming a constant viscosity of α = 10−3 (black) and a mass-dependent prescription of α = 10−3 M⋆/M⊙ (red). The blue represents the whole population synthesis sample with a viscosity of 10−5 ≤ α ≤ 10−2. |
| In the text | |
|
Fig. A.1 Decline in disk fraction (fdisk) with the disk age. Similar layout as Fig. 3. The gray and blue represent constant luminosity for stars at the age of 5 Myr and luminosity that evolves following the evolutionary track by Dotter et al. (2008). |
| In the text | |
|
Fig. B.1 Disk fraction with the disk age limited to different ranges of viscosity (α). Same layout as Fig. 3. |
| In the text | |
|
Fig. C.1 Empirical correlations between the gas-disk mass and radius (top), the FUV flux and gas-disk radius (bottom) at 5 Myr, restricted to disks around 0.1–0.6 M⊙ stars. Same layout as Figs. 10 and 11. |
| In the text | |
|
Fig. D.1 Decline in disk fraction (fdisk) with the disk age under different constraints on initial viscosity (α) and characteristic radius (Rc). The blue and gray only consider disks with 10−5 ≤ α ≤ 10−2 and 150 ≤ Rc ≤ 200 AU, 10−4 ≤ α ≤ 10−2 and 10 ≤ Rc ≤ 30 AU, respectively. Others following the same format as Fig. 3. |
| In the text | |
|
Fig. D.2 PDF of the gas-disk radius R12CO,90% for surviving disks at 5 Myr with constraints on initial disk properties. The blue and red represent disks with viscosity 10−5 ≤ α ≤ 10−2 and 10−4 ≤ α ≤ 10−2, respectively. The shaded region marks the disks with characteristic radius 10 ≤ Rc ≤ 200 AU, and solid lines highlight those with 150 ≤ Rc ≤ 200 AU (blue) and 10 ≤ Rc ≤ 30 AU (red). |
| In the text | |
Current usage metrics show cumulative count of Article Views (full-text article views including HTML views, PDF and ePub downloads, according to the available data) and Abstracts Views on Vision4Press platform.
Data correspond to usage on the plateform after 2015. The current usage metrics is available 48-96 hours after online publication and is updated daily on week days.
Initial download of the metrics may take a while.