Open Access
Fig. 1
Download original image
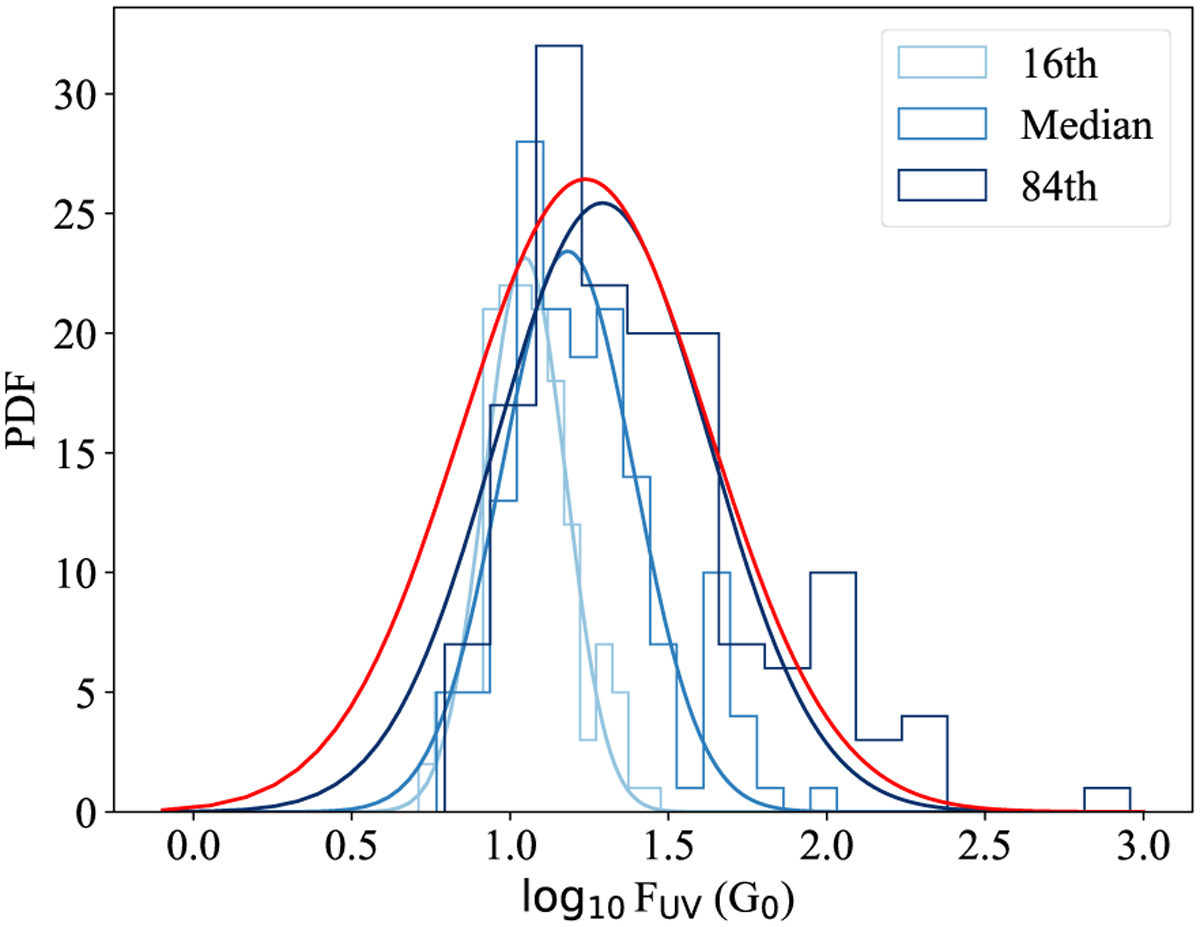
PDF of external FUV flux FUV, fit with log-normal distribution. Light, medium, and dark blue lines represent 16th, median, and 84th values of the FUV flux in the Upper Sco star forming region, respectively. The red line enclosing the blue lines shows the distribution from which we draw FUV flux, FUV, in our models.
Current usage metrics show cumulative count of Article Views (full-text article views including HTML views, PDF and ePub downloads, according to the available data) and Abstracts Views on Vision4Press platform.
Data correspond to usage on the plateform after 2015. The current usage metrics is available 48-96 hours after online publication and is updated daily on week days.
Initial download of the metrics may take a while.