Fig. 3
Download original image
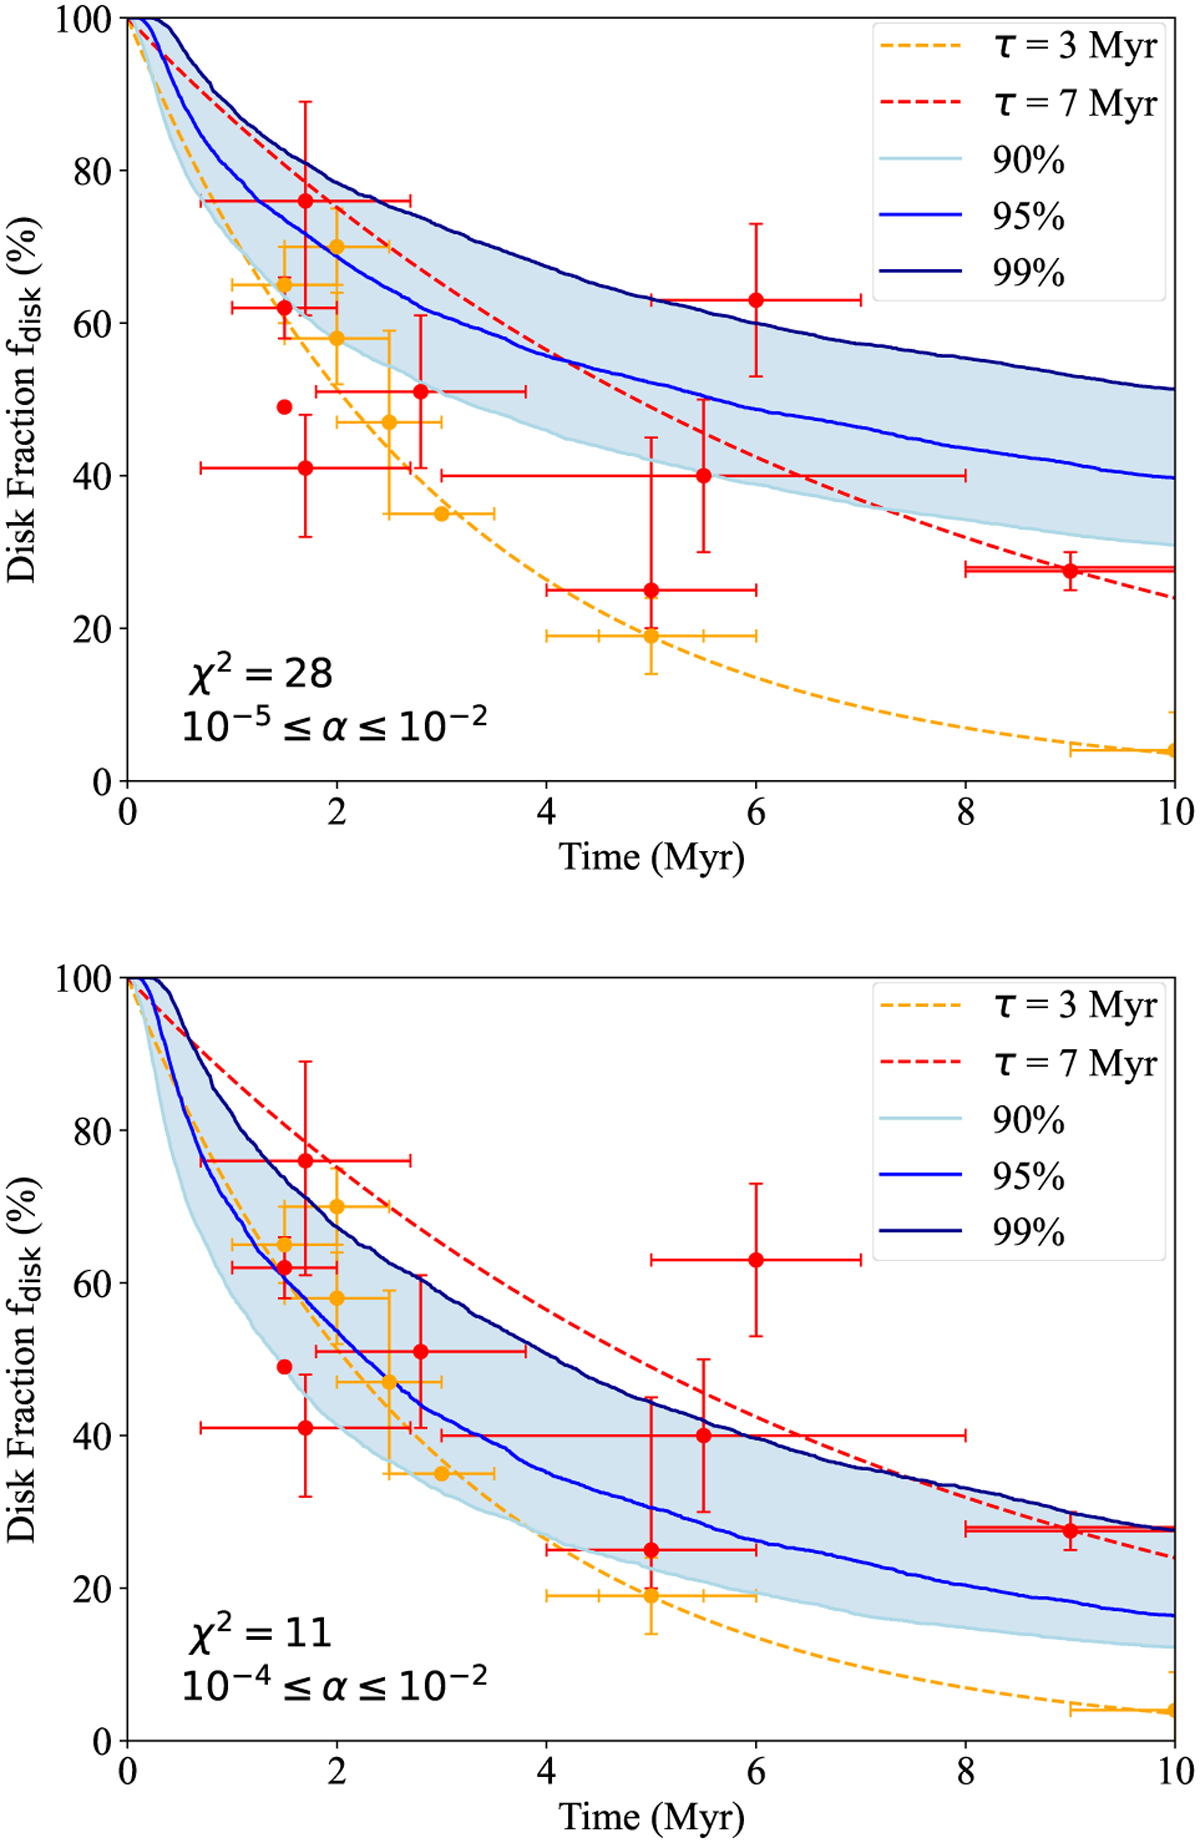
Decline in disk fraction, fdisk, with disk age. Blue lines show the disk fraction considering disk dispersal when losing 90% (light), 95% (medium), and 99% (dark) of the initial mass. The red points correspond to the observed disk fractions of nearby clusters within 200 pc, and the dashed line is the fit exponential decay, f(t) = exp(−t/τ), yielding τ = 7 Myr from Pfalzner et al. (2022). The yellow points are from Fedele et al. (2010), giving τ = 3 Myr. The top and bottom panels correspond to disks with viscosity ranges of 10−5 ≤ α ≤ 10−2 and 10−4 ≤ α ≤ 10−2, respectively. The χ2 values are shown in the bottom left of each figure.
Current usage metrics show cumulative count of Article Views (full-text article views including HTML views, PDF and ePub downloads, according to the available data) and Abstracts Views on Vision4Press platform.
Data correspond to usage on the plateform after 2015. The current usage metrics is available 48-96 hours after online publication and is updated daily on week days.
Initial download of the metrics may take a while.