Fig. 10
Download original image
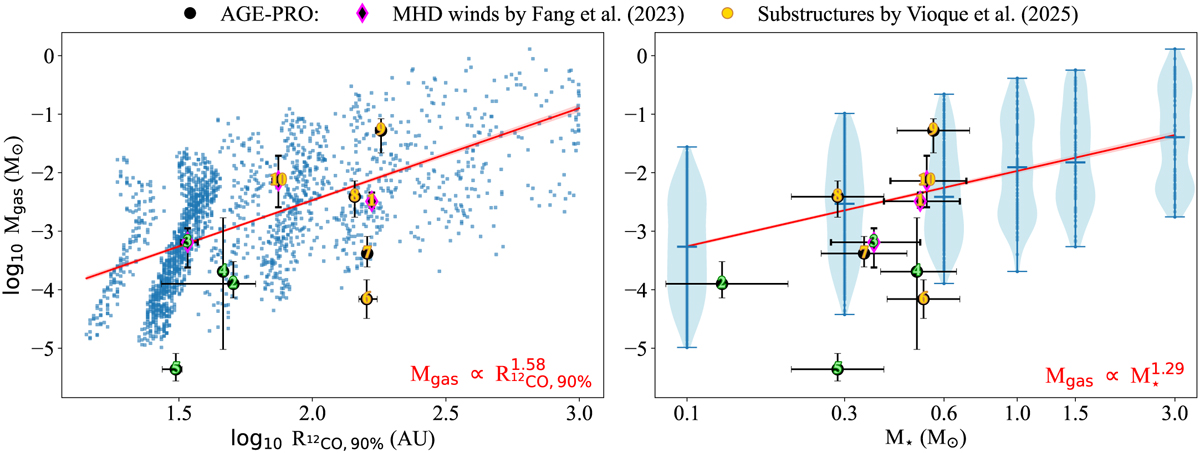
Empirical correlations of gas-disk mass with gas-disk radius (left) and stellar mass (right) at 5 Myr. The blue marks values derived from simulations, and the black shows the values of ten targets in AGE-PRO. The red line is fit using a MCMC method, and the 1σ credible interval is marked in light red. Disks with substructures identified in AGE-PRO (Vioque et al. 2025) are shown in yellow, and those with MHD winds traced by the [O I] λ 6300 line (Fang et al. 2023) are highlighted in bright purple.
Current usage metrics show cumulative count of Article Views (full-text article views including HTML views, PDF and ePub downloads, according to the available data) and Abstracts Views on Vision4Press platform.
Data correspond to usage on the plateform after 2015. The current usage metrics is available 48-96 hours after online publication and is updated daily on week days.
Initial download of the metrics may take a while.