Open Access
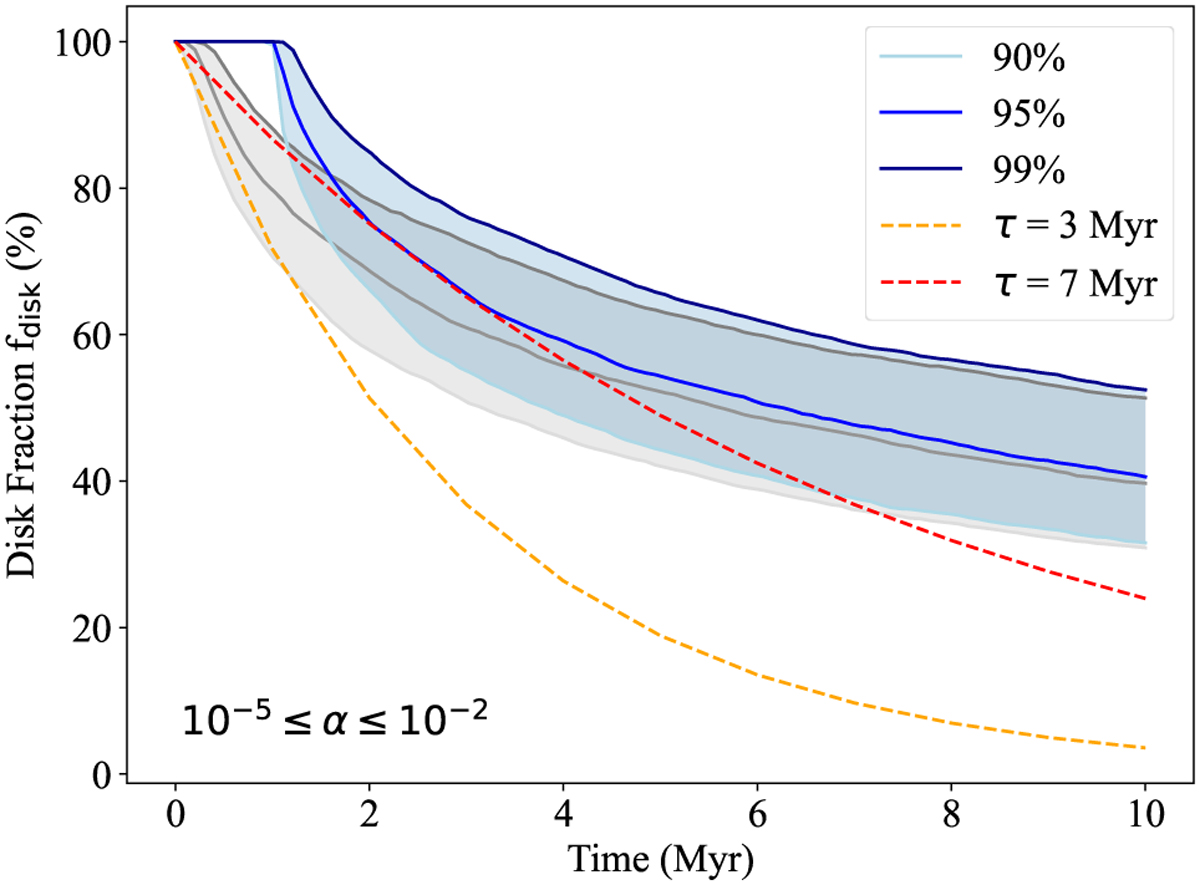
Fig. 13
Download original image
Decline in disk fraction, fdisk, with the disk age. Same layout as Fig. 3. The gray and blue correspond to turning on external photoevaporation initially and at 1 Myr.
Current usage metrics show cumulative count of Article Views (full-text article views including HTML views, PDF and ePub downloads, according to the available data) and Abstracts Views on Vision4Press platform.
Data correspond to usage on the plateform after 2015. The current usage metrics is available 48-96 hours after online publication and is updated daily on week days.
Initial download of the metrics may take a while.