Fig. 6
Download original image
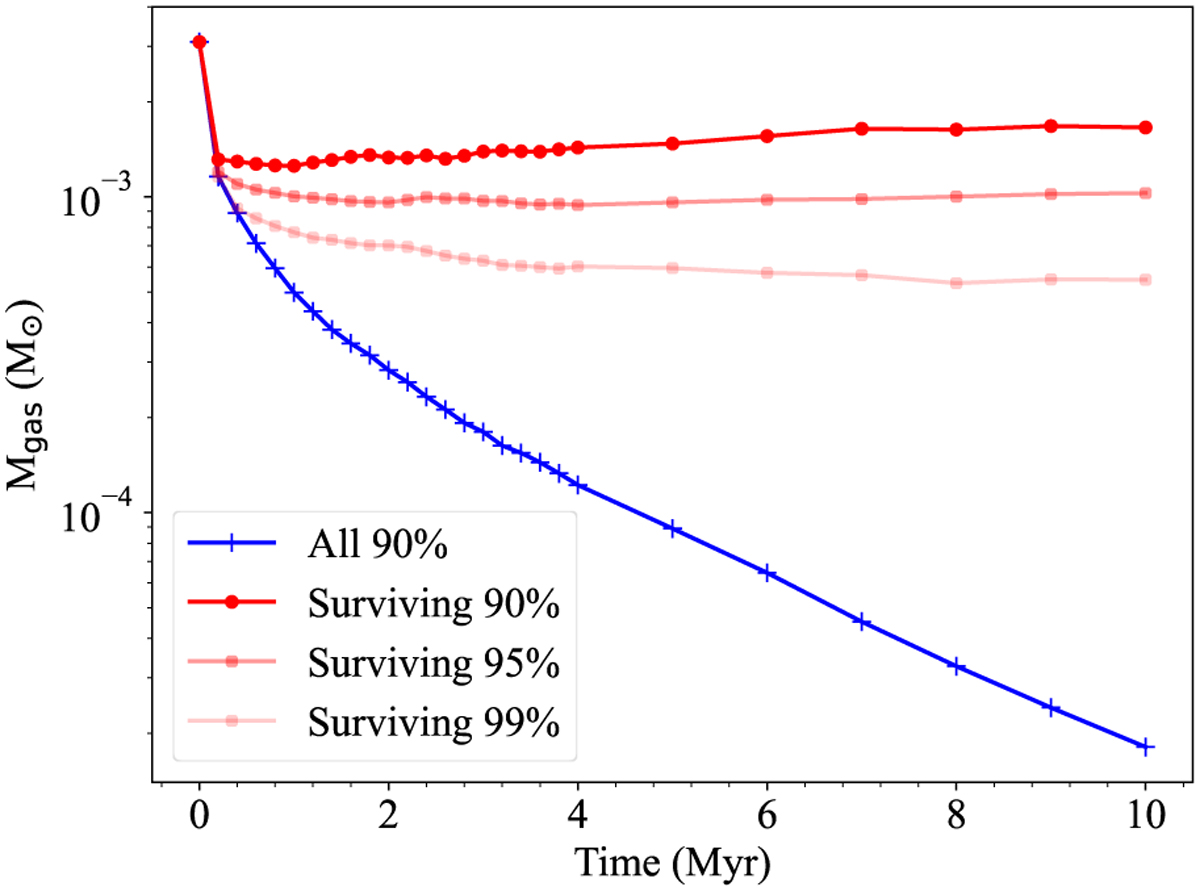
Time evolution of the median gas-disk mass, Mgas. The blue line shows the evolution of the entire sample, adopting 90% gas-disk mass loss as the dispersal criterion. The red lines refer to surviving disks only, with dark, medium, and light red corresponding to dispersal defined by 90%, 95%, and 99% of the gas-disk mass loss, respectively.
Current usage metrics show cumulative count of Article Views (full-text article views including HTML views, PDF and ePub downloads, according to the available data) and Abstracts Views on Vision4Press platform.
Data correspond to usage on the plateform after 2015. The current usage metrics is available 48-96 hours after online publication and is updated daily on week days.
Initial download of the metrics may take a while.