| Issue |
A&A
Volume 709, May 2026
|
|
|---|---|---|
| Article Number | A200 | |
| Number of page(s) | 12 | |
| Section | Galactic structure, stellar clusters and populations | |
| DOI | https://doi.org/10.1051/0004-6361/202558128 | |
| Published online | 19 May 2026 | |
Right round: Onset and long-term evolution of rotation in star clusters
1
INAF - Astrophysics and Space Science Observatory of Bologna,
via Gobetti 93/3,
40129
Bologna,
Italy
2
Department of Astronomy, Indiana University,
Swain West, 727 E. 3rd Street,
IN 47405,
Bloomington,
USA
3
Department of Physics and Astronomy Augusto Righi, University of Bologna,
via Gobetti 93/2,
40129
Bologna,
Italy
★ Corresponding author: This email address is being protected from spambots. You need JavaScript enabled to view it.
Received:
14
November
2025
Accepted:
6
March
2026
Abstract
We present the results of a detailed kinematic analysis of a significant fraction of the known population of Galactic star clusters aimed at constraining the physical mechanisms driving the onset and evolution of cluster rotation. Our study reveals, for the very first time, the presence of rotation in clusters at any age, with about 25%-30% of systems in the sample showing significant evidence of rotation. This increases by a factor of ∼5 the number of clusters identified as rotators so far and finally enables an observational reading of cluster rotation as a function of time. Young clusters (< 500 Myr) show a larger range of rotation velocities than older systems. In addition, 50%-60% of young systems are observed to be significantly rotating, while this fraction drops to ∼15% for the older ones. These purely empirical results are compatible with rotation being imprinted during the very early stages of cluster formation and early evolution and then being progressively erased by the long-term effects of dynamical evolution. For the subsample of clusters for which we were able to perform a full 3D analysis, we calculated the angle between the internal rotation axis and that of the cluster orbital motion. Interestingly, while for clusters with ages that are shorter than their orbital periods we observe similar fractions of prograde and retrograde systems, more evolved clusters appear to be preferentially prograde. We argue that such a behavior is in qualitative agreement with the expectations for the evolution of systems in which primordial rotation was imprinted by the parent molecular cloud and/or by the following hierarchical cluster assembly processes, and in which internal cluster dynamics and interactions with the Galactic field have induced a torque-driven alignment between cluster rotation and orbital motion.
Key words: astrometry / stars: formation / stars: kinematics and dynamics / globular clusters: general / open clusters and associations: general
© The Authors 2026
 Open Access article, published by EDP Sciences, under the terms of the Creative Commons Attribution License (https://creativecommons.org/licenses/by/4.0), which permits unrestricted use, distribution, and reproduction in any medium, provided the original work is properly cited.
This article is published in open access under the Subscribe to Open model. This email address is being protected from spambots. You need JavaScript enabled to view it. to support open access publication.
1 Introduction
The study of star cluster formation and evolution has witnessed a renewed interest in recent years from both the theoretical and observational points of view (e.g., Pascale et al. 2025; Lahén et al. 2025; Calura et al. 2019; Pascale et al. 2025; Taylor et al. 2025; Livernois et al. 2021; Dalessandro et al. 2021b, 2024; Della Croce et al. 2023). Particular attention has been paid to the very early stages of evolution, when clusters are expected to undergo gas expulsion and violent relaxation and may be evolving through hierarchical mass assembly toward a virial equilibrium state (e.g., Livernois et al. 2021; Dalessandro et al. 2021b; Della Croce et al. 2023; Farias & Tan 2023; Polak et al. 2024).
The environment in which stars form determines a number of key properties that characterize the stellar clusters we observe today, such as their initial mass function, structural properties, stellar binarity and multiplicity, and the star-by-star chemical abundance differences routinely observed in massive stellar clusters (e.g., Bastian & Lardo 2018; Gratton et al. 2019). In addition, the dynamics of the contracting embedded molecular cloud cores is expected to be imprinted on the emerging stellar populations, and in particular on the surviving star cluster. As a consequence, internal cluster kinematics turns out to be a key tool to shed new light on the physical processes involved in cluster formation and evolution: the motion of stars in nascent star clusters is inherited from the parent gas cloud, probing the initial conditions of cluster formation. The combination of Gaia (Gaia Collaboration 2023), particularly its third data release (DR3), and wide spectroscopic surveys such as Gaia -ESO, APOGEE, or GALAH, have finally provided an unprecedented multidimensional view of stellar clusters, including 3D positions and velocities and detailed photometry. Several articles have been published in recent years regarding the number and properties of star clusters and nearby star-forming regions (e.g., Cantat-Gaudin et al. 2018; Cantat-Gaudin et al. 2020; Pang et al. 2021; Hunt & Reffert 2023, 2024), as well as their individual structural and kinematic properties (e.g., Kuhn et al. 2019; Dalessandro et al. 2021b; Beccari et al. 2020; Jerabkova et al. 2019; Swiggum et al. 2021; Della Croce et al. 2023, 2024; Jadhav et al. 2024; Guilherme-Garcia et al. 2023).
In this framework, in a recent paper (Della Croce et al. 2024) we focused on the early expansion and survival of young star clusters, providing the first empirical description of the characteristic timescale during which cluster expansion plays a dominant role in the cluster dynamics. In particular, we found that a remarkable fraction of clusters (up to 80%) younger than ∼30 Myr are currently experiencing significant expansion, while older systems are mostly compatible with an equilibrium configuration. We showed that such an observed pattern is in general qualitative agreement with what is expected for systems undergoing violent relaxation and possibly evolving toward a final virial equilibrium state. Additional processes associated with gas expulsion and mass loss due to stellar evolution likely play a role in driving the observed expansion.
In this work we focus on cluster rotation as a complementary key kinematic property of star clusters. There is a general consensus that the rotation of star clusters plays a critical role in their long-term dynamical evolution. For example, rotation can speed up the collapse of the core through the gravo-gyro instability, or it can significantly increase the escape rate for clusters in a strong tidal field (e.g., Einsel & Spurzem 1999; Kim et al. 2002; Ernst et al. 2007). However, the origin of star clusters’ rotation is still a matter of investigation. A number of theoretical studies have shown that many physical factors can play an important role in this context. Angular momentum could be either inherited from the parent molecular cloud or imprinted by gas accretion in the formation phase. In addition, dynamical interactions between sub-clumps, the torque of the host galaxy gravitational potential, and stellar feedback on the leftover gas can contribute to shape clusters’ rotational properties (Vesperini et al. 2014; Mapelli 2017; Tiongco et al. 2017; Ballone et al. 2021 ; Chen et al. 2021; Lahén et al. 2020; Lahén et al. 2025).
Until very recently, observational information about cluster rotation was mostly based on old Galactic globular cluster (GC) studies (e.g., Anderson & King 2003; van de Ven et al. 2006; Bellazzini et al. 2012; Fabricius et al. 2014; Bellini et al. 2017; Kamann et al. 2018; Ferraro et al. 2018; Lanzoni et al. 2018; Bianchini et al. 2018; Sollima et al. 2019; Vasiliev & Baumgardt 2021; Dalessandro et al. 2021a, 2024). Thanks to the use of high-multiplex multi-object, and integral field spectrographs, and more recently thanks to the Gaia astrometric mission (Gaia Collaboration 2023), these analyses have demonstrated that the vast majority of GCs show signatures of internal rotation with amplitudes that can be as large as half of their internal velocity dispersion. According to a number of numerical studies (see, e.g., Einsel & Spurzem 1999; Ernst et al. 2007; Tiongco et al. 2017), present-day signatures of rotation could be the relics of a stronger internal rotation set at the epoch of the clusters’ formation (e.g., Vesperini et al. 2014; Mapelli 2017) that was gradually altered and erased as a result of the effects of angular momentum transfer and loss due to internal dynamical processes and star escape. Observational studies have convincingly shown that the strength of rotation decreases as a function of the GCs’ dynamical ages (Kamann et al. 2018; Bianchini et al. 2018; Sollima et al. 2019; Dalessandro et al. 2024).
Because of the poor statistics and the presence of pretty complex and possibly out-of-equilibrium morphological and kinematic patterns (such as contraction, expansion, and tidal tails), similar investigations have been extremely challenging for younger and less massive clusters. These limitations have been progressively overcome thanks mainly to Gaia, which has significantly increased the availability of accurate proper motions (PMs) for large samples of stars in star clusters. Recent extensive works (e.g., Kuhn et al. 2019; Guilherme-Garcia et al. 2023; Jadhav et al. 2024) have made first attempts to systematically study cluster rotation among Galactic open clusters (OCs). However, mainly due to the different data and methods adopted by the different authors, there is currently no consensus regarding the identification of candidate rotating clusters. In fact, while recent analyses identified as possible rotating clusters a few tens of systems in total, they agree only on the rotation of three of them, namely Stock 2, IC 2602, and Ruprecht 147, indicating the need for further work to identify new and more robust methods for measuring cluster rotation and following its evolution in statistically significant samples of clusters.
To move a step forward in our understanding of the origin and evolution of cluster rotation, we performed a systematic and homogeneous study based on state-of-the-art observations along the three velocity components using a data analysis approach able to deal with relatively small statistical samples and account for the morphological and kinematic complexities commonly observed in young OCs (Dalessandro et al. 2024). In Sect. 2, we present the observational dataset and the cluster sample. In Sect. 3, we describe the adopted kinematic analysis. In Sect. 4, we present the main results, and in Sect. 5 we compare them with those available in the literature. In Sect. 6, we report the results of the full 3D analysis and discuss the possible link between cluster rotation and orbit within the Galaxy. In Sect. 7, we summarize and discuss our main findings and their possible implications.
2 Data and selected sample
We adopted the list of 2017 clusters identified by Cantat-Gaudin et al. (2020) using Gaia Data Release 2 (DR2) as the starting sample for our analysis. Then to take full advantage of the most recent and accurate Gaia DR3 data release for the definition of cluster member stars, we performed an independent membership analysis in the 5D space of Galactic coordinates, PMs and parallaxes (l, b, μα, μδ, and w) by extending the approach already adopted by Della Croce et al. (2024). Briefly, for each cluster in the Cantat-Gaudin et al. (2020) catalog, we estimated the parameters Rsearch,sky and Rsearch,pM as the radii enclosing the 95% of cluster members in sky coordinates and PM space. Then, from the Gaia Archive we queried for stars located within 8 × Rsearch,sky and 8 × Rsearch,PM to ensure we were not artificially excluding member stars. We limited our request to stars with phot_g_mean_mag < 18 mag and astrometric_params_solved = 31 (i.e., stars with position, parallax, and PM measurements). We then performed a clustering analysis using the clustering algorithm HDBSCAN (McInnes et al. 2017) adopting min_samples = 5 and
 (1)
(1)
with Nlit being the reported number of members by Cantat-Gaudin et al. (2020). The parameter min_samples sets the minimum number of sources used in determining the nearest neighbor distance for each source. Hence, increasing min_samples increases the mutual reachability distance among sources, and only the densest areas survive as clusters. min_cluster_size defines the minimum number of stars required to form a clus-ter1. This parameter choice was made to maximize the recovery fraction of clusters in the Cantat-Gaudin et al. (2020) catalog, and in fact we recovered almost all of the clusters in the catalog (1862 corresponding to 92.3% of the starting sample). In Fig. 1 we present the case of NGC 869 as an example of the adopted analysis. Different panels show the distribution of field and cluster member stars in space, velocity and in the color-magnitude diagram.
For each cluster, we then selected as members those stars with membership probability >50% as provided by the clustering analysis performed in this work. While the definition of the membership probability threshold is somehow arbitrary, we note here that a 50% selection secures a pretty good match with the number of members stars provided by Cantat-Gaudin et al. (2020). We also verified that variations in the adopted probability threshold within reasonable ranges (50%-70%) do not have a significant impact on the kinematic analysis results (see Sect. 3). For the kinematic analysis, we retained only stars with reliable astrometry, i.e., sources with ruwe < 1.4, σϖ/ϖ < 0.2, and astrometric_excess_noise below the 95th percentile of all member stars (if astrometric_excess_noise_sig > 2, Lindegren et al. 2021).
The cluster center was defined as the median position of member and kinematically selected stars, and the mean motion was obtained as the median of the μ*α and μδ PMs. All velocities were corrected for perspective effects induced by the clusters’ systemic motions by using the equations reported in van Leeuwen (2009) and following the approach already adopted in previous works of our group (Dalessandro et al. 2021b,a, 2024; Della Croce et al. 2024). To this aim, we used the catalog of mean cluster line-of-sight (LOS) velocities provided by Tarricq et al. (2021) while the clusters’ distance was obtained as the sum of individual inverse parallax measurements weighted over their errors. Gaia parallaxes were corrected following prescriptions by Lindegren et al. (2021). For each cluster we checked the amplitude of the perspective corrections relative to the absolute PM measured by Gaia. We found that for only four clusters does the median relative amplitude exceed 20%. The sample of recovered clusters for which it was possible to apply perspective corrections includes 1270 systems. Among them, we then selected 559 clusters with more than 100 likely member stars (after astrometric quality selection) to perform the kinematic analysis described in the following (Sect. 3).
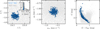 |
Fig. 1 NGC 869 member properties. Left : spatial distribution in Galactic coordinates. Middle : vector-point diagram. Right : distribution in the color-magnitude diagram. The inset shows the parallax distribution. Gray points are the starting sample of Gaia sources used in the clustering analysis, while blue points are NGC 869 member stars. |
3 Kinematic analysis
3.1 Velocity dispersion, rotation, and expansion profiles
We analyzed the 1D kinematic properties in terms of velocity dispersion, expansion, and rotation for all clusters in the sample by using the tangential (TAN) and radial (RAD) velocity projections of the available Gaia PMs. To derive the velocity dispersion and rotation pattern of each selected cluster, we adopted a Bayesian approach based on a discrete fitting technique to compare simple kinematic models with individual velocities (see Cordero et al. 2017; Dalessandro et al. 2018, 2024). This is a purely kinematic approach aimed at searching for relative differences among different clusters and it is not aimed at providing a self-consistent dynamical description. The likelihood function for the velocities of individual stars depends on the assumptions about the formal descriptions of the rotation and velocity dispersion radial variations. For the velocity dispersion profile, we assumed the functional form of the Plummer model (Plummer 1911), which is simply defined by its central velocity dispersion (σ0) and its scale radius (a):
 (2)
(2)
where R is the projected distance from the center of the cluster. For the rotation curve, we assumed cylindrical rotation and adopted the functional form expected for stellar systems undergoing violent relaxation during their early phases of evolution (Lynden-Bell 1967):
 (3)
(3)
Here Vpeak represents the maximum (in an absolute sense) of the mean motion in the TAN component and it corresponds to the rotational velocity at Rpeak.
We stress that while young clusters may be out of equilibrium, not or only partially virialized, expanding and/or contracting (see, e.g., Kuhn et al. 2019; Della Croce et al. 2024; Jadhav et al. 2024), the adoption of equilibrium models, such as Plummer and Lynden-Bell models, does not introduce any significant limitation. In fact, these models can nicely approximate flat velocity dispersion profiles, as those observed for expanding or contracting clusters, and solid-body-like rotation, when adequately large-scale factors (i.e., a and Rpeak) are adopted. We verified that spatially correlated systematic PM errors, as reported for example by Lindegren et al. (2021) and Fabricius et al. (2021) for Gaia DR3 (see also Vasiliev 2019 for a study focused on cluster kinematics with Gaia DR2), are negligible for the present analysis in terms of both the best-fit values of the involved kinematic quantities and their associated error budget.
The kinematic analysis was performed by using the emcee (Foreman-Mackey et al. 2013) implementation of the Markov chain Monte Carlo (MCMC) sampler, which provides the posterior probability distribution function (PDF) for σ0, a, Vpeak, and Rpeak. For the present analysis, we sampled the posterior PDFs by using 64 walkers for 20 000 steps each. For each walker, the first 5000 steps were discarded to ensure convergence. We did not account for correlation between samples. For each quantity, the 50th, 16th, and 84th percentile of the PDF distributions were adopted as the best-fit value and relative errors, respectively. We assumed a Gaussian likelihood and flat priors on each of the investigated parameters within a reasonably large range of values. In particular, we imposed that both a and Rpeak have to be smaller than 5 × rmax, where rmax represents the distance of the farthest member star in the cluster. We also imposed σTAN,0 < 5 mas/yr and −5 < Vpeak < 5 mas/yr. It is important to note that in general, since the analysis is based on the conditional probability of a velocity measurement, given the position of a star, our fitting procedure is not biased by the spatial sampling of the stars. However, the kinematic properties are better constrained in regions that are better sampled (i.e., a larger number of stars with available kinematic information).
As a sanity check and comparison, we also derived the rotation and velocity dispersion profiles along the TAN component by splitting the surveyed areas of each selected cluster into a set of concentric annuli, whose width was chosen to include at least 20 stars. While the number and width of the radial bins are at least partially arbitrary and their choice can potentially have an impact on the final results, this approach has the advantage of avoiding any assumption on the model description of the velocity dispersion and rotation profiles. In each radial bin, the mean velocity and velocity dispersion and their errors were computed by following the maximum-likelihood approach described by Pryor & Meylan (1993). Examples of the results obtained with both the Bayesian and maximum-likelihood analyses are shown in Fig. 2 for the stellar cluster NGC 869.
While cluster rotation is the main focus of this paper, we also characterized cluster expansion for all clusters in our sample as we used this quantity for a comparative analysis (see Sect. 4). To this aim, we adopted the approach described in Della Croce et al. (2024). In brief, we inferred the mean velocity along the RAD component, < vRAD >, and the velocity dispersion, σRAD, in a fully Bayesian framework properly accounting for errors on individual velocities. Similarly to the velocity dispersion along the tangential component and rotation, we explored the parameter space by using the MCMC technique. We assumed that the intrinsic distribution along the radial component is Gaussian with mean 〈vrad〉 and velocity dispersion, σRAD. We used uniform priors within [−10; +10] mas yr−1 and [0.001; +15] mas yr−1 for < vrad > and σRAD, respectively. We show in Fig. 3 the expansion pattern observed in NGC 6871, as an illustrative example.
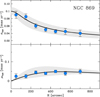 |
Fig. 2 Velocity dispersion (top) and rotation (bottom) profiles for the OC NGC 869. Blue circles represent the observed values obtained using a maximum-likelihood approach on binned data. The black lines and gray-shaded areas represent the best-fit profiles obtained from the Bayesian analysis on discrete velocities, as described in Sect. 3.1. |
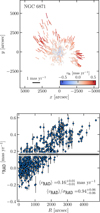 |
Fig. 3 Top : spatial distribution of members stars of NGC 6871 in Cartesian coordinates. Arrows show the velocity vectors on the plane of the sky; their lengths are proportional to the speed on the plane of the sky, while their colors map the radial component (vRAD) of the velocity. Positive values point outward. Bottom : distribution of members in the vRAD—R diagram. The black line represents the bet-fit value for 〈vrad〉, and the dashed gray area its uncertainties. |
3.2 Full 3D analysis
For the subsample of clusters with an adequate number of LOS velocities and Gaia PMs (> 100; see Sect. 4 for details), we performed a full 3D analysis. Such an analysis has the advantage of overcoming the typical limitations connected with projected effects, typically arising when LOS and plane-of-the-sky velocities are used independently, possibly hampering the detection of actual rotation signals.
We followed the approach described in Sollima et al. (2019) and Dalessandro et al. (2024), which has the advantage of constraining a cluster full rotation pattern, estimating the inclination angle of the rotation axis (i) with respect to the LOS, the position angle of the rotation axis (θ0) and the rotation velocity amplitude (A), by means of a model-independent analysis. We considered an average projected rotation velocity with amplitude A3D = 〈ωR〉, where ω is the angular velocity and R is the projected distance from the cluster center. Here we assumed A3D to be independent on the distance from the cluster center. While this of course represents a crude approximation of the rotation patterns expected in stellar clusters and provides only a rough average of the actual rotation amplitude, it is important to stress that it does not introduce any bias in the estimate of θ0 and i and on their use (see Sect. 6).
The A3D, i, and θ0 values were derived by solving the equations describing the rotation projection along the LOS (VLOS) and those perpendicular (V⊥) and parallel (V||) to the rotation axes (see Eq. (2) in Sollima et al. 2019). While the velocity component perpendicular to the rotation axis has a dependence on stellar positions within the cluster along the LOS, we neglected it in the present analysis as it does not affect the mean trend of the V⊥ component, but it can only introduce an additional spread on its distribution. We assumed a flat distribution for A3D in the range −5 km s−1 < A3D < +5 km s−1, i to vary in the range 0° < i < 90°2 with respect to the LOS and the position angle to be in the range 0° < θ0 < 360°. θ0 grows counterclockwise from north to east and A3D is positive for clockwise rotation in the plane of the sky. Following the approach already adopted for the 1D analysis, we derived the best-fit rotation amplitudes, position and inclination angles and relative errors by maximizing the likelihood function reported in Eq. (3) of Sollima et al. (2019) by performing a MCMC analysis by means of the emcee Python package. Figure 4 shows the result of the best-fit analysis along the three velocity components for the case of NGC 3532, as an example.
4 Results
4.1 Kinematic characterization
Unsurprisingly, the first interesting and general result coming out from the kinematic analysis described in Sect. 3 is that a non-negligible fraction of OCs are possibly out of equilibrium: they are expanding, contracting, or dispersing, and they may have extra-tidal features. Figure 5 shows the distribution of a/rmax versus Rpeak/rmax for clusters with more than 100 member stars. We note here that the maximum range of observed a/rmax values and the fact that Rpeak/rmax peaks around 3.5 do not necessarily have a physical meaning, but they are likely shaped by the priors adopted in the kinematic analysis (Sect. 3). The first criterion we used to identify candidate out-of-equilibrium clusters is based on the ratio a/rmax (Fig. 5). Values of this ratio smaller than 1 imply that the cluster velocity dispersion profile is reasonably well fit by a Plummer model. On the contrary, clusters where a is significantly larger than rmax would imply that the Plummer scale length parameter exceeds the extension of the cluster and the velocity dispersion profile is almost flat, thus suggesting they are not in a dynamical equilibrium configuration.
We observe that 182 OCs in our sample have a/rmax > 1 (after accounting for the uncertainties). For 69 of them, rmax significantly exceeds the value of the Jacobi radius (rj; from Hunt & Reffert 2024), possibly suggesting they have extra-tidal features. At a visual inspection, we find that in some cases these clusters show a pretty spherical and symmetric configuration with just a handful of stars located outside rj. For these systems, the definition of extra-tidal features is pretty weak and it can depend significantly on the adopted membership probability threshold. More interestingly, a fraction of OCs show extremely well-defined, coherent, and extended tidal tails (see Kos 2024; Risbud et al. 2025; Jadhav et al. 2025; Sharma et al. 2025 for recent results on the subject). Figure 6 shows the 2D stellar distribution maps of a selection of these systems as an example. These tails or tidal-like structures can be related to internal dynamical processes, interactions with the Milky Way potential, and/or the bar and spiral arms.
Figure 5 also shows that for the vast majority of clusters, the Rpeak is significantly larger than rmax. For clusters with non-null rotation (|Vpeak| > 0), this implies that they are likely characterized by solid-body rotation.
As a key information in the characterization of the dynamical state of the star clusters in the sample, we inferred their expansion or contraction state by following the approach we defined in Della Croce et al. (2024). In particular, we used the ratio between the mean radial velocity, 〈vR〉, and the radial velocity dispersion, σR. This parameter directly evaluates the cluster expansion (i.e., 〈vR〉/σR > 0), contraction (i.e., 〈vR〉/σR < 0), or equilibrium (i.e., (〈vR〉/σR compatible with 0) state by using individual measurements and accounting for errors. We measured this parameter for all clusters in the sample adopting the selection presented in Sect. 2. We note that 〈vR〉/σR, as defined, cannot probe radial trends of the expansion state and that a clustercentric-dependent analysis would be required (Lim et al. 2020; Della Croce et al. 2025). Nonetheless, it provides a robust estimate of the cluster’s internal dynamical state even for sparsely populated clusters. We find compatible results with Della Croce et al. (2024) for the overlapping age range (<300 Myr): expansion appears to be a dominant feature for clusters younger than ∼30 Myr, then the fraction of expanding clusters significantly decreases and, for older ages, the vast majority of systems appears to be compatible with a non-expansion configuration.
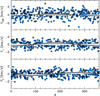 |
Fig. 4 Distribution of the three velocity components as a function of the position angle for NGC 3532. The black line and the dashed gray area represent the best-fit and relative uncertainties as obtained in Sect. 3.2. |
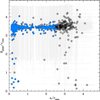 |
Fig. 5 a/rmax and Rpeak/rmax distribution for OCs in the sample. Blue circles represent clusters selected as described in Sect. 4.2. |
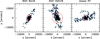 |
Fig. 6 2D stellar distribution maps for three selected systems with clear evidence of tidal tails (see Sect. 4.1). |
4.2 Cluster rotation
To include only clusters more likely to be in a dynamical equilibrium configuration (see Fig. 5 and Sect. 4.1), for the cluster rotation analysis we selected3 only systems that have (a - σa) < rmax (where σa represents the 16th percentile of the PDF distribution). While this choice is not necessary (see the discussion in Sect. 3.1), we preferred to pick clusters possibly in an equilibrium configuration as they are likely to survive longer and hence are more suitable targets to follow the possible evolution of cluster rotation as a function of their age. Finally, we further selected clusters with rmax < rj to avoid stellar systems with prominent tidal tails or elongated substructures that can have a non-negligible impact on the observed rotation patterns. The final sample comprises 292 clusters, which are highlighted as blue circles in Fig. 5.
To obtain quantitative and homogeneous estimates of clusters’ rotation patterns, to follow their evolution and eventually to compare the observational results with theoretical models and dynamical simulations, we used the observed distributions of velocities along the TAN component and we adopted the parameter αmax. This parameter is a slightly modified version of the α parameter introduced by Dalessandro et al. (2024) in the context of characterizing the rotation of GCs and their multiple populations. The α is meant to incorporate in a meaningful way all the main relevant physical quantities at play in a single value and it has been proven to efficiently trace stellar cluster rotation patterns and to highlight in a robust way internal differences and deviations. This parameter has the advantage of providing a robust measure of the relative strength of the rotation signal over the disordered motion at any radial range in a cluster without making any assumptions about the underlying star or mass distribution. By construction, α depends on the considered cluster-centric distance and therefore a meaningful cluster-to-cluster comparison requires the parameter to be measured over equivalent radial portions in every system. We decided to measure α within rmax for all systems to avoid the possible impact on our ability to detect rotating clusters due to the observed divergence of the best-fit values of a and Rpeak. We also verified that the adoption of different radial selections does not have a significant impact on the overall relative distribution of α values. αmax is therefore defined as follows:
 (4)
(4)
where R1 is the cluster-centric distance normalized to rmax. Errors on αmax were obtained by propagating the posterior probability distributions obtained from the MCMC analysis for the best-fit rotation and velocity dispersion profiles derivation (see Sect. 3).
The general approach of our analysis is not to focus on the detection of specific signatures of rotation, but rather to compare the general kinematic behaviors described by all OCs in the sample in the most effective way. The top panel of Fig. 7 shows the distribution of αmax as a function of age for the selected clusters. Younger clusters (<500 Myr) show a pretty wide range of αmax, which goes form 0 to values close to 1 in a few cases, meaning that for these systems ordered and disordered motion are almost equally contributing to the cluster energetic budget. Then the distribution of αmax progressively narrows down around values of ∼0.05 for the older systems (tage > 2 Gyr). We verified that the wide range of observed values of αmax is not linked to the number of member stars used in the kinematic analysis, thus reinforcing the idea that differences among clusters in the sample are primarily driven by intrinsically different kinematic properties. We find that after accounting for the uncertainties on the individual αmax values, 75 out of 292 clusters (∼26%) show significant evidence of rotation (blue circles in Fig. 7), meaning that their αmax values are larger than 0 at more than 1σ. Interestingly, our analysis is able to detect a fraction of rotating clusters larger by a factor of 4-5 than previous studies (Guilherme-Garcia et al. 2023; Jadhav et al. 2024) and, more importantly, it suggests that rotation is a common property of clusters at any age. The bottom panel of Fig. 7 shows the distribution of the fraction of rotating clusters (Nrot/Ntot) as a function of age. Here, Nrot represents the number of clusters selected as rotators (blue points in the top panel) and Ntot is the total number of systems in the same age range. We observe that Nrot/Ntot decreases from ∼60% for systems younger than ∼500 Myr to ∼15% for older clusters. The significantly larger fraction of candidate rotator clusters at young ages strongly suggests that rotation is very likely imprinted during the very early stages of stellar cluster formation and evolution.
In the right panel of Fig. 7, we show the distribution of αmax as a function of the cluster dynamical age (Age/trh), where Age comes from the compilation of Cantat-Gaudin et al. (2020) and trh is the half-mass relaxation time. trh was derived by using Eq. (11) from Djorgovski (1993). For the cluster mass we adopted the values reported by Hunt & Reffert (2023)4, for the half-mass radius we used the radius that includes 50% of the member stars, and for the average stellar mass we assigned values adequate for a young stellar population born with a Kroupa initial mass function. Then the number of stars to include in the calculation is simply given by the ratio between the total mass of the cluster and the adopted average stellar mass. A qualitative comparison with N-body models suggests that the observed αmax distribution as a function of the cluster dynamical age appears to be compatible with the expectations for the long-term dynamical evolution and survival of stellar systems developing their rotation during their early evolution phases (see, e.g., Tiongco et al. 2017). In fact, at any given age, cluster rotation is expected to be the remnant of a stronger early rotation (see, e.g., Hénault-Brunet et al. 2012; Mapelli 2017) gradually weakened by the effects of two-body relaxation (Bianchini et al. 2018; Kamann et al. 2018; Sollima et al. 2019; Dalessandro et al. 2024). A number of numerical studies based on N-body simulations (e.g., Hong et al. 2013; Tiongco et al. 2017) show that during the cluster long-term evolution, the amplitude of the rotation decreases due to angular momentum redistribution and star escape.
As a comparison, in Fig. 7 we also report the distribution of a sample of 16 old Galactic GCs. These systems were analyzed by Dalessandro et al. (2024) by using the same kinematic approach and observational strategy adopted in the present paper. For these GCs, we derived αmax by adopting the tidal radius reported by Harris (1996, - edition 2010) as rmax and we adopted the trh values from the same compilation. As expected and already reported in the literature (see, e.g., Kamann et al. 2018; Sollima et al. 2019; Dalessandro et al. 2024), the rotation of GCs decreases as a function of dynamical age. Interestingly, while the sample of GCs is relatively small, Fig. 7 shows that there is a pretty nice match between the distribution of αmax and the dynamical age of OCs and GCs, thus possibly supporting the conclusion that rotation is imprinted at the early times of stellar clusters’ life and that the long-term dynamical evolution of star clusters, mainly driven by two-body relaxation processes, is the main physical mechanism shaping its amplitude as a function of time.
We compared the observed values for rotation and expansion (see Sect. 4.1) of the clusters in the sample. We find that there is a pretty weak correlation between these two kinematic quantities (Spearman correlation coefficient ∼0.06), even when focusing only on the very young systems (tage < 30 Myr), where cluster expansion is found to play a prominent role. We only note that expanding systems show a smaller fraction (∼38%) of rotators than non-expanding ones in the same age range (∼50%) and that clusters undergoing significant expansion do not attain the larger rotation values observed in our analysis.
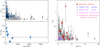 |
Fig. 7 Top left : distribution of αmax as a function of cluster age. Blue circles represent systems selected as significant rotators (Sect. 4.2). Bottom left : fraction of significantly rotating systems (Nrot/Ntot) as a function of age. Right : αmax distribution as a function of the clusters’ dynamical age. Stars and triangles are clusters identified as candidate rotators in the literature. Red circles are Galactic GCs from Dalessandro et al. (2024). The outlier GC (with αmax > 1) is NGC 6496. |
5 Comparison with the literature
Recent extensive works (e.g., Kuhn et al. 2019; Guilherme-Garcia et al. 2023; Jadhav et al. 2024) based on Gaia data and available LOS information have provided first attempts to quantitatively and systematically study rotation among large samples of Galactic OCs. In particular, Kuhn et al. (2019) studied the kinematic properties of a sample of 28 young systems by using Gaia DR2 PMs and found that only one cluster, namely Trumpler 15, shows evidence of rotation. Guilherme-Garcia et al. (2023) investigated the kinematics of 1237 clusters by using Gaia DR2 PMs and by adopting a technique aimed at reconstructing the clusters’ underlying velocity field. They found that 8 clusters (and additional 9 candidates - defined as “possible” rotators; see Fig. 7) display significant rotation patterns. More recently, Jadhav et al. (2024) used a combination of Gaia DR3 PMs and available LOS for a sample of clusters similar to the one studied by Guilherme-Garcia et al. (2023) finding 10 clusters with significant rotation and additional 16 candidate rotators. In qualitative agreement with our findings, these works would suggest that in principle young and relatively low-mass stellar clusters can be characterized by non-negligible rotation. However, at odds with what we observe here, they would also suggest that only a small fraction of OCs (1-2%) shows significant signatures of rotation. We note that while Guilherme-Garcia et al. (2023) and Jadhav et al. (2024) analyzed a similar sample of systems, because of the different adopted data and methods, they agree only on the rotation of three clusters, namely Stock 2, IC 2602, and Ruprecht 147.
Here we focus on a detailed comparison between these studies and the results presented in this work. A one-to-one comparison between our rotation derivations and those reported in the literature is shown in the right panel of Fig. 7. Fifteen of the clusters analyzed in this work (Sect. 3) were identified as rotating OCs by Kuhn et al. (2019), Guilherme-Garcia et al. (2023), and Jadhav et al. (2024). Of them, only 4 are found to be significant rotators in our analysis based on the selection described in Sect. 4. In particular, we find NGC 2099, which is in the golden sample of Jadhav et al. (2024) and NGC 2547, NGC 3532 and NGC 6124, which are in their silver sample. We do not recover Stock 2 as significant rotator in our analysis ( ), while IC 2602, Ruprecht 147 and Trumpler 15 are not in our selected sample. Along these lines, it is interesting to note that the number of candidate rotators in common between the literature and the present work increases to 32 if we do not apply any selection (neither in terms of the number of member stars nor in terms of a/rmax and rmax/rj), thus possibly suggesting that a non-negligible fraction of candidate rotators in the work by Guilherme-Garcia et al. (2023) and Jadhav et al. (2024) are in a nonequilibrium configuration and that it is possibly characterized by the presence of tails and/or extended stellar structures. To test whether the differences between our results and those obtained by Jadhav et al. (2024) arise due to the the fact that we used a different sample of cluster member stars, we performed our kinematic analysis on same sample of selected member stars as in their works. The results are fully consistent with those obtained when using the selections and membership criteria described in Sects. 2 and 3.
The second important point we note is the lack in previous works of a large fraction of rotating OCs we identify as significant rotators (see Fig. 7). While it is not easy to understand the reasons for such a difference, we argue it may be related to the more efficient approach in the derivation of the kinematic properties, which is based entirely on the analysis of discrete velocities. We also note here that, at odds with the analyses by Guilherme-Garcia et al. (2023) and Jadhav et al. (2024), the αmax parameter used in our study is based on the ratio of the rotational velocity to the velocity dispersion, thus providing a measure of the relative importance of ordered and disordered motion (see Dalessandro et al. 2024 for a further discussion), rather than some absolute measure of rotation. Hence, the OCs selected as significant rotators in the present study are those systems in which rotation encompasses a significant fraction of the system’s kinematic budget.
6 Prograde and retrograde rotation
For the subsample of clusters for which it is possible to perform a 3D rotation analysis (Sect. 3.2), we also derived the position angle (θ0) and the inclination (i) of the rotation axis, providing us with all components of the internal angular momentum vector (hereafter referred to as spin, S). This allowed us to calculate the relative inclination of the spin and orbital angular momentum vectors (L).
We first derived the spin vector components in the Galacto-centric frame (S; see Appendix A for a detailed derivation of the transformations), and we compared it with the orbital angular momentum vector (hereafter L). In particular, we characterized the prograde or retrograde nature of the internal rotation through the angle η defined as
 (5)
(5)
Errors on η were derived by propagating those on θ0 and i in a Monte Carlo fashion and assuming the two quantities are not correlated. From Eq. (5), it follows that for η < 90° the rotation is prograde (i.e., the spin and angular momentum vectors point in the same direction even if they are not aligned) and vice versa.
The orbital angular momentum is directly derived from the clusters’ mean 3D position and velocity in Galactocentric coordinates. Moreover, we derived the cluster orbital parameters (e.g., the orbital period) within a Bovy (2015) potential. All clusters in our sample have disk-like orbits, with little excursion above and below the Galactic plane (consistently with previous works; see, e.g., Tarricq et al. 2022).
In Fig. 8, we show the angle η as a function of the number of orbits the clusters traveled in the Galactic disk (defined as the ratio of the cluster age to its orbital period: Age/Porb) and as a function of the dynamical age (Age/trh). Notably, Fig. 8 shows that (i) clusters that have not yet completed a full orbit around the Galaxy uniformly populate the range [0°, 180°], possibly suggesting that there is no preferential alignment of the primordial spin vector; and (ii) more evolved clusters appear to have a larger fraction of prograde clusters (η < 90°): specifically, for the 10 clusters that have not yet completed a full orbit, 5 have a prograde configuration and 5 a retrograde configuration (left panel of Fig. 8). For clusters that have already completed many orbits, we count 10 systems with prograde configuration (η < 90°) and 6 retrograde clusters. Similarly, for dynamical ages Age/trh < 1.5 we find 11 OCs, of which 6 are prograde and 5 retrograde. More dynamically evolved systems are split between 10 in a prograde and 5 in retrograde configuration.
While the differences in the fraction between the two groups of clusters is admittedly not statistically significant and a larger sample of objects will be necessary for a more detailed statistical study of this trend, we point out that the evolving fraction of prograde clusters may be a hint of the effect of the evolution of the clusters’ internal spin vector toward alignment with the orbital angular momentum. To guide the interpretation of the results presented in Fig. 8, we ran, using the Petar code (Wang et al. 2020), a suite of six N-body simulations of rotating clusters with different initial orientations of the internal spin relative to the orbital angular momentum. The initial angles between the internal and the orbital angular momenta adopted in our simulations were equal to 0°, 45°, 90°, 115°, 135°, and 180°, thus spanning the full range of angles we find in our observational sample. Our models start with 6000 stars distributed with the density profile of a Plummer model (see, e.g., Heggie & Hut 2003) with a half-mass radius equal to 4 pc; rotation was added by using the procedure suggested in Lynden-Bell (1960) and reverting the tangential velocity around the rotation axis of 30 per cent of the stars in the system. Our simulations start with equal-mass models and include only the effects of internal two-body relaxation and those of the external tidal field of the host galaxy. The simulations are specifically aimed at illustrating the evolution of the angle between the internal angular momentum and the orbital one (see also Tiongco et al. 2018, 2022; White et al. 2026 for studies of the evolution of rotating GCs including an investigation of the orientation of the internal angular momentum). Clusters were put on circular orbits at a distance of 8 kpc from the galactic center on the disk plane of the Milky Way. The potential of the Galaxy was modeled using Bovy (2015). Figure 9 depicts the resulting time evolution of the angle η from our simulations and it clearly shows the gradual alignment between the internal and orbital angular momenta. We also note, in agreement with our observational results, that our simulations show that for the range of dynamical ages in our observed sample, memory of the initial distribution of prograde and retrograde clusters is still in part preserved.
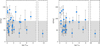 |
Fig. 8 Present-day inclination between the orbital angular momentum and the internal spin vector (see Eq. (5)) as a function of the number of orbits around the Galaxy. Cluster ages are from Cantat-Gaudin et al. (2020), and orbital periods were computed using the axisymmetric potential from Bovy (2015). The gray area highlights the range of η corresponding to a prograde rotation. |
7 Summary and discussion
We performed a detailed kinematic analysis on a large sample of OCs, representative of the full Galactic population, with the aim of constraining their rotation and evolution with time. We made use of Gaia DR3 PMs and LOS velocities obtained by large spectroscopic surveys. We adopted a Bayesian approach based on a discrete fitting technique to compare simple kinematic models with individual velocities, deal with relatively small statistical samples and account for the morphological and kinematic complexities commonly observed in young OCs. Following the results of a recent similar analysis targeting GCs and their multiple populations (Dalessandro et al. 2024), we parametrized the strength of cluster rotation along the TAN velocity component using the parameter αmax, which has the advantage of incorporating, in an efficient and meaningful way, all the main physical ingredients at play in a single value. In addition, for a subsample of 26 clusters with a sufficiently large number of available velocities along the three components, we performed a full 3D rotation analysis.
Our study shows that rotation is a common property of clusters at any age. In fact, about 26% of the systems in our sample (corresponding to 75 clusters) are characterized by significant rotation. This result increases by a factor of about 5 the number of known candidate rotator clusters with the respect to previous analyses (Guilherme-Garcia et al. 2023; Jadhav et al. 2024), and it enables an observational reading of cluster rotation as a function of time. We observe that young clusters (<500 Myr) show a larger range of observed rotation velocities; for some, the rotation values approach their velocity dispersions. The distribution of rotation progressively narrows at later ages. Moreover, 50% − 60% of young systems are observed to be significantly rotating, while this fraction drops to ∼15% for the older ones. The large fraction of rotating systems and the large range of observed rotation values at young ages (<500 Myr) suggest that rotation is very likely imprinted during the very early stages of stellar cluster formation and evolution. In addition, while it is hard to read the distribution of αmax as a function of age in terms of an evolutionary path, the general behavior observed in Fig. 7 is qualitatively compatible with the expectations for the long-term dynamical evolution and survival of initially rotating clusters (e.g., Hong et al. 2013; Tiongco et al. 2017, 2018; Kamann et al. 2018; Bianchini et al. 2018; Sollima et al. 2019; Dalessandro et al. 2024). This interpretation is further strengthened by the observed distribution of αmax as a function of the clusters’ dynamical age and by the comparison with a sample of old GCs.
For the subsample of clusters with a 3D kinematic analysis, we were able to compare the spin and orbital angles of the clusters. We observe that clusters with an orbital period longer than their age (or young dynamical ages) are equally distributed between prograde (η < 90°) and retrograde (η > 90°) values, while systems with larger Age/Porb ratios (or older dynamical ages) are mostly prograde. By means of a set of N-body simulations, we show that this trend is compatible with the expected torque-driven alignment between a cluster’s rotation and orbital motion (Tiongco et al. 2018; Dalessandro et al. 2021a; Tiongco et al. 2022; White et al. 2026). Interestingly, we note that the almost homogeneous distribution of η for young clusters suggests that there is no preferential alignment between the original spin vector and the orbital one. We speculate that this result can have implications on the possible physical mechanisms imprinting rotation in the emerging stellar clusters. First, we note that observational studies of the internal rotation of molecular clouds have found that the relative fraction of clouds with prograde or retrograde rotation depends on the environment and varies in different galaxies: a larger fraction of clouds in the disks of M 51 and M 33 have internal prograde rotation, while retrograde rotation is more common in the molecular clouds located in the spiral arms (Braine et al. 2018; Braine et al. 2020). In the Milky Way, on the other hand, observations have revealed a similar fraction of clouds with prograde and retrograde internal rotation (see, e.g., Phillips 1999), while Liu et al. (2025) found a high fraction of retrograde rotators in the spiral galaxy NGC 5064. Secondly, it is important to note that the hierarchical assembly of star clusters through the dynamical interactions of smaller clumps may efficiently imprint rotation on the final cluster (e.g., Mapelli 2017; Dalessandro et al. 2021b; Livernois et al. 2021; Della Croce et al. 2023; Karam & Sills 2024; Karam et al. 2025) and alter the initial rotational kinematic of the system, resulting in significantly different spin-orbital vector alignment configurations. However, given the relatively small number of clusters and the typical uncertainties, we refrain from drawing any firm conclusions in this respect. These results should be considered rather as a proof of concept. The exquisite data provided by Gaia in synergy with large spectroscopic surveys allow us in principle to study the internal cluster rotation in three dimensions (Sollima et al. 2019; Dalessandro et al. 2024), and additional efforts in this direction should be made to extend the sample for which this analysis is possible, particularly in light of the upcoming Gaia DR4 and the availability of multi-object spectrographs with a large multiplexing power (> 1000), such as WEAVE, 4MOST, and MOONS.
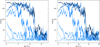 |
Fig. 9 Time evolution of the angle (η) between the internal angular momentum and the orbital angular momentum for the six N-body models described in Sect. 6. |
Acknowledgements
The authors thank the anonymous referee for their careful reading of the manuscript and for their comments that have contributed to improve the presentation of the results. ED and GE acknowledge financial support from the INAF Data analysis Research Grant (PI: E. Dalessandro) of the “Bando Astrofisica Fondamentale 2024”. The research activities described in this paper were carried out with contribution of the Next Generation EU funds within the National Recovery and Resilience Plan (PNRR), Mission 4 -Education and Research, Component 2 - From Research to Business (M4C2), Investment Line 3.1 - Strengthening and creation of Research Infrastructures, Project IR0000034 “STILES - Strengthening the Italian Leadership in ELT and SKA”. EV acknowledge support from the John and A-Lan Reynolds Faculty Research Fund.
References
- Anderson, J., & King, I. R. 2003, AJ, 126, 772 [NASA ADS] [CrossRef] [Google Scholar]
- Ballone, A., Torniamenti, S., Mapelli, M., et al. 2021, MNRAS, 501, 2920 [NASA ADS] [CrossRef] [Google Scholar]
- Bastian, N., & Lardo, C. 2018, ARA&A, 56, 83 [Google Scholar]
- Beccari, G., Boffin, H. M. J., & Jerabkova, T. 2020, MNRAS, 491, 2205 [Google Scholar]
- Bellazzini, M., Bragaglia, A., Carretta, E., et al. 2012, A&A, 538, A18 [NASA ADS] [CrossRef] [EDP Sciences] [Google Scholar]
- Bellini, A., Milone, A. P., Anderson, J., et al. 2017, ApJ, 844, 164 [NASA ADS] [CrossRef] [Google Scholar]
- Bianchini, P., van der Marel, R. P., del Pino, A., et al. 2018, MNRAS, 481, 2125 [Google Scholar]
- Bovy, J. 2015, ApJS, 216, 29 [NASA ADS] [CrossRef] [Google Scholar]
- Braine, J., Rosolowsky, E., Gratier, P., Corbelli, E., & Schuster, K.-F. 2018, A&A, 612, A51 [NASA ADS] [CrossRef] [EDP Sciences] [Google Scholar]
- Braine, J., Hughes, A., Rosolowsky, E., et al. 2020, A&A, 633, A17 [NASA ADS] [CrossRef] [EDP Sciences] [Google Scholar]
- Calura, F., D’Ercole, A., Vesperini, E., Vanzella, E., & Sollima, A. 2019, MNRAS, 489, 3269 [Google Scholar]
- Cantat-Gaudin, T., Jordi, C., Vallenari, A., et al. 2018, A&A, 618, A93 [NASA ADS] [CrossRef] [EDP Sciences] [Google Scholar]
- Cantat-Gaudin, T., Anders, F., Castro-Ginard, A., et al. 2020, A&A, 640, A1 [NASA ADS] [CrossRef] [EDP Sciences] [Google Scholar]
- Chen, Y., Li, H., & Vogelsberger, M. 2021, MNRAS, 502, 6157 [Google Scholar]
- Cordero, M. J., Hénault-Brunet, V., Pilachowski, C. A., et al. 2017, MNRAS, 465, 3515 [NASA ADS] [CrossRef] [Google Scholar]
- Dalessandro, E., Mucciarelli, A., Bellazzini, M., et al. 2018, ApJ, 864, 33 [NASA ADS] [CrossRef] [Google Scholar]
- Dalessandro, E., Raso, S., Kamann, S., et al. 2021a, MNRAS, 506, 813 [Google Scholar]
- Dalessandro, E., Varri, A. L., Tiongco, M., et al. 2021b, ApJ, 909, 90 [Google Scholar]
- Dalessandro, E., Cadelano, M., Della Croce, A., et al. 2024, A&A, 691, A94 [NASA ADS] [CrossRef] [EDP Sciences] [Google Scholar]
- Della Croce, A., Dalessandro, E., Livernois, A., et al. 2023, A&A, 674, A93 [NASA ADS] [CrossRef] [EDP Sciences] [Google Scholar]
- Della Croce, A., Dalessandro, E., Livernois, A., & Vesperini, E. 2024, A&A, 683, A10 [NASA ADS] [CrossRef] [EDP Sciences] [Google Scholar]
- Della Croce, A., Dalessandro, E., Vesperini, E., et al. 2025, A&A, 698, A142 [NASA ADS] [CrossRef] [EDP Sciences] [Google Scholar]
- Djorgovski, S. 1993, in Astronomical Society of the Pacific Conference Series, 50, Structure and Dynamics of Globular Clusters, eds. S. G. Djorgovski, & G. Meylan, 373 [Google Scholar]
- Einsel, C., & Spurzem, R. 1999, MNRAS, 302, 81 [NASA ADS] [CrossRef] [Google Scholar]
- Ernst, A., Glaschke, P., Fiestas, J., Just, A., & Spurzem, R. 2007, MNRAS, 377, 465 [NASA ADS] [CrossRef] [Google Scholar]
- Fabricius, M. H., Noyola, E., Rukdee, S., et al. 2014, ApJ, 787, L26 [NASA ADS] [CrossRef] [Google Scholar]
- Fabricius, C., Luri, X., Arenou, F., et al. 2021, A&A, 649, A5 [NASA ADS] [CrossRef] [EDP Sciences] [Google Scholar]
- Farias, J. P., & Tan, J. C. 2023, MNRAS, 523, 2083 [NASA ADS] [CrossRef] [Google Scholar]
- Ferraro, F. R., Mucciarelli, A., Lanzoni, B., et al. 2018, ApJ, 860, 50 [NASA ADS] [CrossRef] [Google Scholar]
- Foreman-Mackey, D., Hogg, D. W., Lang, D., & Goodman, J. 2013, PASP, 125, 306 [Google Scholar]
- Gaia Collaboration (Vallenari, A., et al.) 2023, A&A, 674, A1 [NASA ADS] [CrossRef] [EDP Sciences] [Google Scholar]
- Gratton, R., Bragaglia, A., Carretta, E., et al. 2019, A&AR, 27 [Google Scholar]
- Guilherme-Garcia, P., Krone-Martins, A., & Moitinho, A. 2023, A&A, 673, A128 [NASA ADS] [CrossRef] [EDP Sciences] [Google Scholar]
- Harris, W. E. 1996, AJ, 112, 1487 [Google Scholar]
- Heggie, D., & Hut, P. 2003, The Gravitational Million-Body Problem: A Multidisciplinary Approach to Star Cluster Dynamics [Google Scholar]
- Hénault-Brunet, V., Evans, C. J., Sana, H., et al. 2012, A&A, 546, A73 [CrossRef] [EDP Sciences] [Google Scholar]
- Hong, J., Kim, E., Lee, H. M., & Spurzem, R. 2013, MNRAS, 430, 2960 [NASA ADS] [CrossRef] [Google Scholar]
- Hunt, E. L., & Reffert, S. 2023, A&A, 673, A114 [NASA ADS] [CrossRef] [EDP Sciences] [Google Scholar]
- Hunt, E. L., & Reffert, S. 2024, A&A, 686, A42 [NASA ADS] [CrossRef] [EDP Sciences] [Google Scholar]
- Jadhav, V. V., Kroupa, P., Wu, W., Pflamm-Altenburg, J., & Thies, I. 2024, A&A, 687, A89 [NASA ADS] [CrossRef] [EDP Sciences] [Google Scholar]
- Jadhav, V. V., Risbud, D., Kroupa, P., & Wu, W. 2025, A&A, 704, A50 [NASA ADS] [CrossRef] [EDP Sciences] [Google Scholar]
- Jerabkova, T., Beccari, G., Boffin, H. M. J., et al. 2019, A&A, 627, A57 [NASA ADS] [CrossRef] [EDP Sciences] [Google Scholar]
- Kamann, S., Husser, T.-O., Dreizler, S., et al. 2018, MNRAS, 473, 5591 [NASA ADS] [CrossRef] [Google Scholar]
- Karam, J., & Sills, A. 2024, ApJ, 967, 86 [Google Scholar]
- Karam, J., Fujii, M. S., & Sills, A. 2025, ApJ, 984, 75 [Google Scholar]
- Kim, E., Einsel, C., Lee, H. M., Spurzem, R., & Lee, M. G. 2002, MNRAS, 334, 310 [NASA ADS] [CrossRef] [Google Scholar]
- Kos, J. 2024, A&A, 691, A28 [NASA ADS] [CrossRef] [EDP Sciences] [Google Scholar]
- Kuhn, M. A., Hillenbrand, L. A., Sills, A., Feigelson, E. D., & Getman, K. V. 2019, ApJ, 870, 32 [CrossRef] [Google Scholar]
- Lahén, N., Naab, T., Johansson, P. H., et al. 2020, ApJ, 904, 71 [CrossRef] [Google Scholar]
- Lahén, N., Naab, T., Rantala, A., & Partmann, C. 2025, MNRAS, 543, 1023 [Google Scholar]
- Lanzoni, B., Ferraro, F. R., Mucciarelli, A., et al. 2018, ApJ, 861, 16 [NASA ADS] [CrossRef] [Google Scholar]
- Lim, B., Hong, J., Yun, H.-S., et al. 2020, ApJ, 899, 121 [CrossRef] [Google Scholar]
- Lindegren, L., Klioner, S. A., Hernández, J., et al. 2021, A&A, 649, A2 [EDP Sciences] [Google Scholar]
- Liu, L., Shu, F., Bureau, M., et al. 2025, MNRAS, 541, 3081 [Google Scholar]
- Livernois, A., Vesperini, E., Tiongco, M., Varri, A. L., & Dalessandro, E. 2021, MNRAS, 506, 5781 [NASA ADS] [CrossRef] [Google Scholar]
- Lynden-Bell, D. 1960, MNRAS, 120, 204 [NASA ADS] [Google Scholar]
- Lynden-Bell, D. 1967, MNRAS, 136, 101 [Google Scholar]
- Mapelli, M. 2017, MNRAS, 467, 3255 [NASA ADS] [CrossRef] [Google Scholar]
- McInnes, L., Healy, J., & Astels, S. 2017, J. Open Source Softw., 2, 205 [NASA ADS] [CrossRef] [Google Scholar]
- Pang, X., Li, Y., Yu, Z., et al. 2021, ApJ, 912, 162 [NASA ADS] [CrossRef] [Google Scholar]
- Pascale, M., Dai, L., Frye, B. L., & Beverage, A. G. 2025, ApJ, 988, L76 [Google Scholar]
- Pascale, R., Calura, F., Vesperini, E., et al. 2025, A&A, 699, A31 [NASA ADS] [CrossRef] [EDP Sciences] [Google Scholar]
- Phillips, J. P. 1999, A&SS, 134, 241 [Google Scholar]
- Plummer, H. C. 1911, MNRAS, 71, 460 [Google Scholar]
- Polak, B., Mac Low, M.-M., Klessen, R. S., et al. 2024, A&A, 690, A94 [NASA ADS] [CrossRef] [EDP Sciences] [Google Scholar]
- Pryor, C., & Meylan, G. 1993, in Astronomical Society of the Pacific Conference Series, 50, Structure and Dynamics of Globular Clusters, eds. S. G. Djorgovski, & G. Meylan, 357 [Google Scholar]
- Risbud, D., Jadhav, V. V., & Kroupa, P. 2025, A&A, 694, A258 [NASA ADS] [CrossRef] [EDP Sciences] [Google Scholar]
- Sharma, I., Jadhav, V. V., & Subramaniam, A. 2025, arXiv e-prints [arXiv:2509.09279] [Google Scholar]
- Sollima, A., Baumgardt, H., & Hilker, M. 2019, MNRAS, 485, 1460 [Google Scholar]
- Swiggum, C., D’Onghia, E., Alves, J., et al. 2021, ApJ, 917, 21 [NASA ADS] [CrossRef] [Google Scholar]
- Tarricq, Y., Soubiran, C., Casamiquela, L., et al. 2021, A&A, 647, A19 [NASA ADS] [CrossRef] [EDP Sciences] [Google Scholar]
- Tarricq, Y., Soubiran, C., Casamiquela, L., et al. 2022, A&A, 659, A59 [NASA ADS] [CrossRef] [EDP Sciences] [Google Scholar]
- Taylor, E. D., Read, J. I., Orkney, M. D. A., et al. 2025, Nature, 645, 327 [Google Scholar]
- Tiongco, M. A., Vesperini, E., & Varri, A. L. 2017, MNRAS, 469, 1, 683 [Google Scholar]
- Tiongco, M. A., Vesperini, E., & Varri, A. L. 2018, MNRAS, 475, L86 [NASA ADS] [CrossRef] [Google Scholar]
- Tiongco, M. A., Vesperini, E., & Varri, A. L. 2022, MNRAS, 512, 1584 [NASA ADS] [CrossRef] [Google Scholar]
- van de Ven, G., van den Bosch, R. C. E., Verolme, E. K., & de Zeeuw, P. T. 2006, A&A, 445, 513 [NASA ADS] [CrossRef] [EDP Sciences] [Google Scholar]
- van Leeuwen, F. 2009, A&A, 497, 209 [CrossRef] [EDP Sciences] [Google Scholar]
- Vasiliev, E. 2019, MNRAS, 489, 623 [Google Scholar]
- Vasiliev, E., & Baumgardt, H. 2021, MNRAS, 505, 5978 [NASA ADS] [CrossRef] [Google Scholar]
- Vesperini, E., Varri, A. L., McMillan, S. L. W., & Zepf, S. E. 2014, MNRAS, 443, L79 [NASA ADS] [CrossRef] [Google Scholar]
- Wang, L., Iwasawa, M., Nitadori, K., & Makino, J. 2020, MNRAS, 497, 536 [NASA ADS] [CrossRef] [Google Scholar]
- White, E. B., Vesperini, E., Dalessandro, E., & Varri, A. L. 2026, A&A, 705, A159 [NASA ADS] [CrossRef] [EDP Sciences] [Google Scholar]
Appendix A Derivation of the internal spin vector in the Galactocentric reference frame
Let us assume that we measured PA (defined such that PA = 0° points north, and increasing eastward, i.e., PA = 90° points east) and i (defined between [0°; 180°], and pointing along the LOS, defined as the line from the observer to the source) for a cluster centered in (a; δ). We first define the spin vector in local tangent plane coordinates,
 (A.1)
(A.1)
and then derive its coordinates in the ICRS reference frame using the rotation matrix
 (A.2)
(A.2)
Therefore,
 (A.3)
(A.3)
Finally, we transform sICRS into the Galactocentric reference frame by rotating the reference frame axes such that they coincide with those of the Galactocentric one (see, e.g., the documentation on the Astropy package5). We did not perform any translation for the Sun position, as we were interested in the relative direction of SGal with the orbital angular momentum.
We refer to the online documentation (https://hdbscan.readthedocs.io/en/latest/index.html) for further details.
To secure an isotropic prior over the solid angle in the MCMC analysis, we adopted a prior on sin i in the range [0, +1].
In addition to the selection described in Sect. 2.
Clusters with no mass estimates do not appear in the right panel of Fig. 7.
All Figures
|
Fig. 1 NGC 869 member properties. Left : spatial distribution in Galactic coordinates. Middle : vector-point diagram. Right : distribution in the color-magnitude diagram. The inset shows the parallax distribution. Gray points are the starting sample of Gaia sources used in the clustering analysis, while blue points are NGC 869 member stars. |
| In the text | |
|
Fig. 2 Velocity dispersion (top) and rotation (bottom) profiles for the OC NGC 869. Blue circles represent the observed values obtained using a maximum-likelihood approach on binned data. The black lines and gray-shaded areas represent the best-fit profiles obtained from the Bayesian analysis on discrete velocities, as described in Sect. 3.1. |
| In the text | |
|
Fig. 3 Top : spatial distribution of members stars of NGC 6871 in Cartesian coordinates. Arrows show the velocity vectors on the plane of the sky; their lengths are proportional to the speed on the plane of the sky, while their colors map the radial component (vRAD) of the velocity. Positive values point outward. Bottom : distribution of members in the vRAD—R diagram. The black line represents the bet-fit value for 〈vrad〉, and the dashed gray area its uncertainties. |
| In the text | |
|
Fig. 4 Distribution of the three velocity components as a function of the position angle for NGC 3532. The black line and the dashed gray area represent the best-fit and relative uncertainties as obtained in Sect. 3.2. |
| In the text | |
|
Fig. 5 a/rmax and Rpeak/rmax distribution for OCs in the sample. Blue circles represent clusters selected as described in Sect. 4.2. |
| In the text | |
|
Fig. 6 2D stellar distribution maps for three selected systems with clear evidence of tidal tails (see Sect. 4.1). |
| In the text | |
|
Fig. 7 Top left : distribution of αmax as a function of cluster age. Blue circles represent systems selected as significant rotators (Sect. 4.2). Bottom left : fraction of significantly rotating systems (Nrot/Ntot) as a function of age. Right : αmax distribution as a function of the clusters’ dynamical age. Stars and triangles are clusters identified as candidate rotators in the literature. Red circles are Galactic GCs from Dalessandro et al. (2024). The outlier GC (with αmax > 1) is NGC 6496. |
| In the text | |
|
Fig. 8 Present-day inclination between the orbital angular momentum and the internal spin vector (see Eq. (5)) as a function of the number of orbits around the Galaxy. Cluster ages are from Cantat-Gaudin et al. (2020), and orbital periods were computed using the axisymmetric potential from Bovy (2015). The gray area highlights the range of η corresponding to a prograde rotation. |
| In the text | |
|
Fig. 9 Time evolution of the angle (η) between the internal angular momentum and the orbital angular momentum for the six N-body models described in Sect. 6. |
| In the text | |
Current usage metrics show cumulative count of Article Views (full-text article views including HTML views, PDF and ePub downloads, according to the available data) and Abstracts Views on Vision4Press platform.
Data correspond to usage on the plateform after 2015. The current usage metrics is available 48-96 hours after online publication and is updated daily on week days.
Initial download of the metrics may take a while.