Open Access
Fig. 4
Download original image
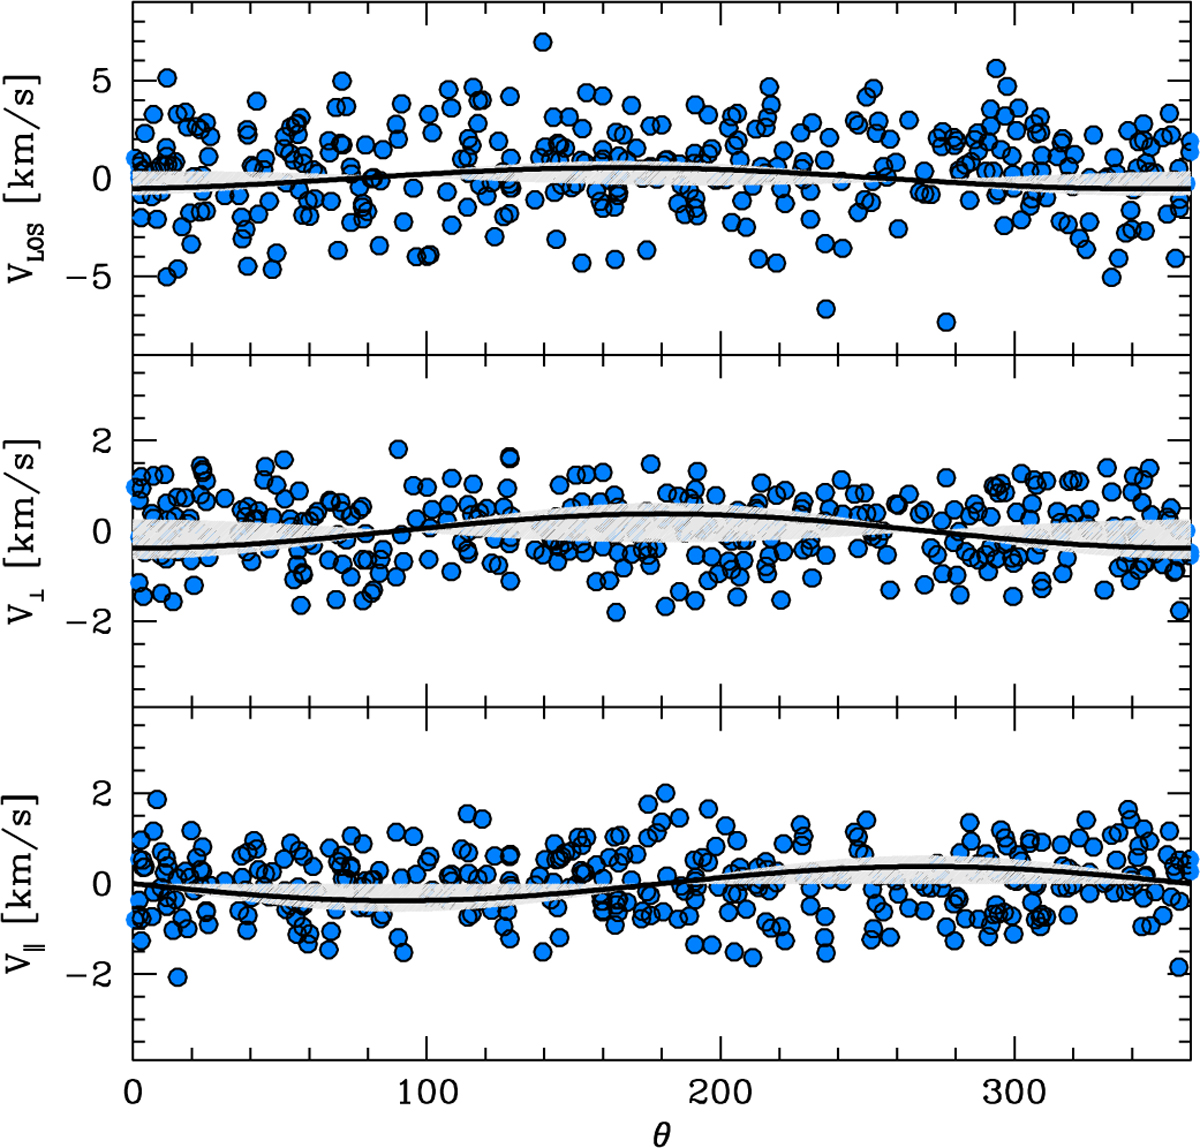
Distribution of the three velocity components as a function of the position angle for NGC 3532. The black line and the dashed gray area represent the best-fit and relative uncertainties as obtained in Sect. 3.2.
Current usage metrics show cumulative count of Article Views (full-text article views including HTML views, PDF and ePub downloads, according to the available data) and Abstracts Views on Vision4Press platform.
Data correspond to usage on the plateform after 2015. The current usage metrics is available 48-96 hours after online publication and is updated daily on week days.
Initial download of the metrics may take a while.