Fig. 7
Download original image
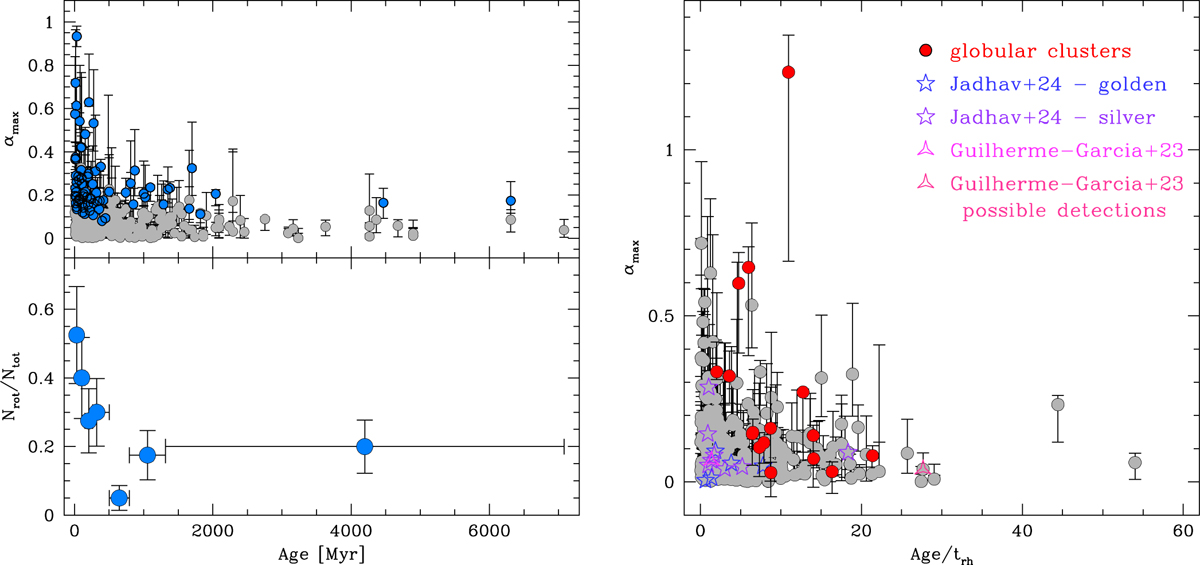
Top left : distribution of αmax as a function of cluster age. Blue circles represent systems selected as significant rotators (Sect. 4.2). Bottom left : fraction of significantly rotating systems (Nrot/Ntot) as a function of age. Right : αmax distribution as a function of the clusters’ dynamical age. Stars and triangles are clusters identified as candidate rotators in the literature. Red circles are Galactic GCs from Dalessandro et al. (2024). The outlier GC (with αmax > 1) is NGC 6496.
Current usage metrics show cumulative count of Article Views (full-text article views including HTML views, PDF and ePub downloads, according to the available data) and Abstracts Views on Vision4Press platform.
Data correspond to usage on the plateform after 2015. The current usage metrics is available 48-96 hours after online publication and is updated daily on week days.
Initial download of the metrics may take a while.