| Issue |
A&A
Volume 698, May 2025
|
|
|---|---|---|
| Article Number | A36 | |
| Number of page(s) | 17 | |
| Section | Interstellar and circumstellar matter | |
| DOI | https://doi.org/10.1051/0004-6361/202554686 | |
| Published online | 29 May 2025 | |
Conformational isomerism of methyl formate: New detections of the higher-energy trans conformer and theoretical insights
1
Centro de Astrobiología (CAB), INTA-CSIC,
Carretera de Ajalvir km 4, Torrejón de Ardoz,
28850
Madrid,
Spain
2
Departamento de Astrofísica Molecular, Instituto de Física Fundamental (IFF-CSIC),
Madrid
28006,
Spain
★ Corresponding author.
Received:
21
March
2025
Accepted:
28
March
2025
Context. In recent astrochemical studies it has become essential to study not only the most stable conformers, but also all the structures within the conformational panorama of the molecule, some of which are potentially detectable in the interstellar medium (ISM). In this context, the isomeric ratio can be used as a powerful tool to distinguish between different formation routes of molecules with increasing levels of complexity.
Aims. While the most stable cis-conformer of methyl formate (CH3OCHO) is ubiquitous in the ISM, there is just one tentative detection of the higher-energy trans form (ΔE = 3000 K) toward the envelope of the star-forming region Sgr B2(N). For this work, our aim was to search for trans-methyl formate in additional sources and to perform new theoretical computations to better understand its conformational isomerism.
Methods. We used an ultradeep molecular line survey of the Galactic Center molecular cloud G+0.693-0.027, carried out with the Yebes 40m and IRAM 30m telescopes, as well as publicly available data from the Large Program ASAI observed toward the prototypical protostellar shock L1157-B1. The observational results are compared with predictions based on new grain-surface theoretical computations, which are sensitive to the stereochemistry of the molecule.
Results. We present the detections of trans-methyl formate in both astronomical regions, providing conclusive observational evidence of its presence in the ISM. Numerous unblended or slightly blended a-type Ka = 0, 1 transitions belonging to the A-substate of trans-methyl formate have been identified in both sources, many of which have been directly observed in radio astronomical data for the first time and remain unmeasured in the laboratory. We derive a molecular column density for trans-methyl formate of N = (8.2 ± 0.4) ×1012 cm−2 and N = (1.6 ± 0.3) ×1012 cm−2, respectively, for each source, yielding a molecular abundance with respect to H2 of ∼6 ×10⁻¹¹ and ∼8 ×10⁻¹⁰, respectively. Therefore, we obtain cis/trans isomeric ratios of ∼72 and ∼34 toward G+0.693 and L1157-B1, respectively, which are about seven and three times higher than that found in the Sgr B2(N) region. The results from our theoretical computations suggest that a stereospecific formation of trans-methyl formate via the CH3O + HCO route on grain surfaces can qualitatively explain the observed cis/trans abundance ratio. Nevertheless, we show that additional stereospecific gas-phase routes could also play a crucial role in maintaining the intricate balance between formation and destruction of trans-MF, ultimately leading to its detection.
Key words: astrochemistry / line: identification / ISM: molecules / ISM: individual objects: G+0.693-0.027 / ISM: individual objects: L1157-B1
© The Authors 2025
 Open Access article, published by EDP Sciences, under the terms of the Creative Commons Attribution License (https://creativecommons.org/licenses/by/4.0), which permits unrestricted use, distribution, and reproduction in any medium, provided the original work is properly cited.
This article is published in open access under the Subscribe to Open model. Subscribe to A&A to support open access publication.
1 Introduction
The study of isomerism in the interstellar medium (ISM) stands as a prolific field in recent astrochemical studies. However, the detection of high-energy isomers in the ISM has historically faced skepticism, due to their expected low abundances compared to their more stable counterparts under the interstellar conditions (Lattelais et al. 2009). Recent findings challenge this principle for various molecular systems, highlighting several families of structural isomers1 (e.g., the C3H2O, C2H4O2, C2H2N2, or C2H5O2N isomeric families; Shingledecker et al. 2019; Mininni et al. 2020; Rivilla et al. 2023; San Andrés et al. 2024).
On the contrary, several stereoisomers2, such as the Z- and E-stereoisomers of C-cyanomethanimine (HNCHCN; San Andrés et al. 2024), the trans and gauche conformers3 of ethanol (C2H5OH; Pearson et al. 1997), the Ga and Aa conformers of n-propanol (n-C3H7OH; Jiménez-Serra et al. 2022), the anti and gauche conformers of ethyl formate (CH3CH2(O)CHO; Rivilla et al. 2017), and also the cis and trans conformers of thioformic acid (HC(O)SH; García de la Concepción et al. 2022) support the idea that relative abundances correlate with molecular stability. Nonetheless, even some conformers, including cis-cis and cis-trans carbonic acid (HOCOOH; Sanz-Novo et al. 2023), the cis and trans conformers of formic acid (HCOOH; García de la Concepción et al. 2022), and methyl formate (HC(O)OCH3; Neill et al. 2012; Faure et al. 2014), show that this correlation is not absolute and that thermodynamic factors alone cannot rationalize the observed abundance ratios (Molpeceres et al. 2022).
Methyl formate (hereafter MF), a molecule that is ubiquitous in the ISM, appears to be a promising testbed to study stereoisomerism in space. The cis conformer (see Fig. 1), often referred to solely as MF, was first detected in emission toward Sgr B2 (Brown et al. 1975). Afterward, this species was detected in a plethora of interstellar environments, including prestellar cores (e.g., Bacmann et al. 2012; Jiménez-Serra et al. 2016; Megías et al. 2023; Scibelli et al. 2024), hot cores (both in the inner and outer galaxy; see, e.g., Belloche et al. 2013; Rivilla et al. 2017; Mininni et al. 2020; Shimonishi et al. 2021), hot corinos (Cazaux et al. 2003; Pineda et al. 2012), molecular clouds (e.g., Requena-Torres et al. 2006; Agúndez et al. 2021), in protoplanetary disks (Lee et al. 2019; Brunken et al. 2022)), and even in extragalactic objects (e.g., Sewiło et al. 2018).
Meanwhile, the trans conformer, with the carbonyl oxygen pointing away from the methyl group (see Fig. 1), is much higher in energy than the cis conformer (about 25 kJ mol−1 or ∼3000 K) and, to date, it has only been detected tentatively toward the Sagittarius B2(N) molecular cloud, based on the identification of absorption features (Neill et al. 2012).
In this context, and motivated by the recent detection of several high-energy stereoisomers toward the Galactic Center (GC) molecular cloud G+0.693-0.027 (hereafter G+0.693; see, e.g., Jiménez-Serra et al. (2022); Sanz-Novo et al. (2023); Rivilla et al. (2023); San Andrés et al. (2024)), we searched for trans-MF, yielding a clear and positive detection in emission. This detection toward this source, which is dominated by large-scale shocks (Requena-Torres et al. 2006; Zeng et al. 2020) that sputter the dust grains and increase the gas-phase molecular abundances, encouraged us to search for this species toward other shocked regions. In particular, we chose the archetypal protostellar shock L1157-B1, which shows a rich chemistry (e.g., Gusdorf et al. 2008; Codella et al. 2015; Lefloch et al. 2012; Busquet et al. 2014; Holdship et al. 2016; Lefloch et al. 2017), also including the presence of trans-MF.
While substantial research has been conducted on the interstellar formation of MF, considering both gas-phase and grainsurface mechanisms (e.g., Horn et al. 2004; Neill et al. 2011; Laas et al. 2011; Cole et al. 2012; Balucani et al. 2015 and Garrod et al. 2006; Garrod 2013; Enrique-Romero et al. 2022), most studies, particularly those focused on grain-surface processes, predominantly focus on the formation of the most stable cis conformer. This has resulted in a lack of understanding regarding the formation of trans-MF and its expected isomeric ratio. Therefore, to fill this gap, the observational results are also compared with predictions based on new grain-surface theoretical computations, which are sensitive to the stereochemistry of the molecule.
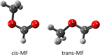 |
Fig. 1 Structures of the lowest-energy conformers of methyl formate (MF), separated by a ΔE = 3000 K (25 kJ mol−1). The carbon atoms are shown in gray, oxygen atoms in red, and hydrogen atoms in white. |
2 Interstellar searches
2.1 Observations
We used an unbiased and ultradeep spectral survey performed toward the GC molecular cloud G+0.693 to search for trans-MF. This source is an intermediate-dense cloud (a few 104 cm−3) with warm kinetic temperatures (about 70–150 K), as described in Zeng et al. (2018) and Colzi et al. (2024). In addition, it is characterized by low dust temperatures (∼20–30 K in the Galactic Center molecular clouds; Rodríguez-Fernández et al. 2000; Etxaluze et al. 2013). Moreover, G+0.693 appears as an astrochemical mine for the discovery of new species in the ISM, with more than 20 first detections over the last few years (see, e.g., Rivilla et al. 2019; Rivilla et al. 2020, 2021b,a, 2022a,b, 2023; Rodríguez-Almeida et al. 2021a,b; Jiménez-Serra et al. 2022; Zeng et al. 2021, 2023; San Andrés et al. 2024; Sanz-Novo et al. 2023, 2024a,b; Sanz-Novo et al. 2025).
We conducted observations in the Q-band (31.075–50.424 GHz) using the Yebes 40 m radio telescope located in Guadalajara (Spain). Additionally, we covered three more frequency windows with high sensitivity using the IRAM 30 m radio telescope in Granada (Spain): 83.2−115.41 GHz, 132.28−140.39 GHz, and 142.00−173.81 GHz. We used the position switching mode, centered at α = 17h47m22s, δ = , −28°21′27′′, with the off position shifted by Δα = −885′′ and Δδ = 290′′. The half-power beam width (HPBW) of the Yebes 40 m telescope ranges from approximately 35′′ to 55′′ at frequencies of 50 GHz and 31 GHz, respectively (Tercero et al. 2021). In contrast, the HPBW of the IRAM 30 m radio telescope varies from ∼14′′ to ∼29′′ across the covered frequency range. Further details on these observations, such as resolution and noise levels of the molecular line survey, are provided in Rivilla et al. (2023) and Sanz-Novo et al. (2023).
We also searched for trans-MF toward L1157-B1, a bright bow shock in the powerful and chemically rich outflow powered by the L1157 low-mass protostar (Bachiller & Pérez Gutiérrez 1997; Bachiller et al. 2001), using the publicly available data from the Large Program ASAI (Astrochemical Surveys At IRAM; Lefloch et al. 2018). These data are based on IRAM 30m observations, using the broadband EMIR receivers connected to fast Fourier transform spectrometers in the 195 kHz spectral resolution mode. In particular, we explored the data covering two spectral windows, 71.7–79.5 GHz and 78.8–118.0 GHz, the latter with a frequency resolution of 390 kHz (which translate to velocities of 1.5 and 1 km s−1, respectively). The source nominal positions are αJ2000 = 20h 39m 10s, δJ2000 = +68° 01′ 10′′. The cloud ambient velocity νLSR = +2.6 km s−1. We refer to Lefloch et al. 2018 for a complete description of the observations and data acquisition. Fluxes are expressed in main beam temperature units (Tmb), as the source does not fill the beam. The beam efficiency, Be f f, and forward efficiency, Fe f f, values are from the IRAM webpage4.
2.2 Conformational panorama of MF and rotational spectroscopy considerations
The conformational panorama of MF exhibits two plausible configurations, the cis conformer (energy minimum), and the trans conformer (located at 24.6 kJ mol−1, or 2980 K higher in energy; Neill et al. 2012, see our Fig. 1). These results were obtained experimentally based on relative intensity measurements of the 10,1–00,0 transitions belonging to the A-symmetry substate of each conformer (Neill et al. 2012). Additionally, both conformers are asymmetric tops exhibiting methyl internal rotation motions due to the presence of a –CH3 group. This motion is less hindered for trans-MF, exhibiting a three-fold (V3) potential barrier (12.955 ± 0.017 cm−1; Neill et al. 2012) that is considerably lower than that obtained for cis-MF (379.4 cm−1; Karakawa et al. 2001). This lower barrier hampers its rotational characterization due to a larger expected A-E splitting. Nevertheless, trans-MF shows a much larger µa dipole moment component (4.2 D; Neill et al. 2012) compared to cis-MF (1.6 D; Curl 1959), a crucial factor that enables its detection both in the laboratory and in space.
Moreover, while extensive spectroscopic data is available in the literature for cis-MF (Ilyushin et al. 2009, and references therein), the rotational spectroscopy of trans-MF is limited to the 6–60 GHz frequency range (Neill et al. 2012). To date, 24 transitions have been measured using several pulsed-jet FTMW spectrometers for the A-symmetry substate, while only 9 (up to 36 GHz) belonging to the E-substate (Neill et al. 2012). Consequently, we exclusively used the available transition frequencies of the A-symmetry lines to perform an effective least-squares fit to a semi-rigid rotor Hamiltonian (Watson’s A-reduced Hamiltonian in Ir representation). The resulting spectroscopic constants are listed in Table A.1. We then extrapolated these results to higher frequencies to include the spectral coverage of the observations we used here, where the brightest transitions of trans-MF are expected (according to the low Tex in both sources), and prepared the corresponding line catalogs. We note that even though we anticipate nonnegligible uncertainties upon reaching the millimeter-wave region, these uncertainties would not have an impact on the analysis, especially for transitions with low values of Ka, as they will likely be notably smaller than the typical line widths of the molecular line emission observed toward G+0.693, but also L1157-B1 (e.g., <100 kHz or 0.2 km s−1 for the 121,12–121,11 transition at 111.347 GHz, and <150 kHz or 0.33 km s−1 for the 150,15–140,14 transition at 136.094 GHz compared to a FWHM of ∼15−20 km s−1 and ∼5 km s−1 for G+0.693 and L1157-B1, respectively; Requena-Torres et al. 2006, 2008; Zeng et al. 2018; Lefloch et al. 2017, 2018). A similar extrapolation approach, though initially applied to a much more limited experimental dataset (i.e., only three Ka = 0 transitions), was used for the detection of HOCS+ (Sanz-Novo et al. 2024a), and has recently been demonstrated to work properly for cold sources (Lattanzi et al. 2024). In particular, we found that the uncertainties in the rest frequencies were a factor of 2 lower than those expected (e.g., discrepancies between the extrapolated and the new frequency uncertainties measured at ∼103.076 GHz of 147 kHz).
2.3 Detection of trans-MF toward G+0.693 and derivation of the cis/trans ratio
We implemented the catalog of trans-MF into the MADCUBA package5 (Martín et al. 2019), and used the Spectral Line Identification and Modeling (SLIM) tool to generate synthetic spectra assuming local thermodynamic equilibrium (LTE) excitation conditions. Although the intermediate H2 volume densities of G+0.693 (of a few times 104 cm−3; Zeng et al. 2018; Colzi et al. 2024) result in a subthermal excitation of the molecular emission (i.e., Tex = 5-–20 K≪ Tkin = 70–140 K; see, e.g., Requena-Torres et al. 2006; Zeng et al. 2018), LTE models, which assume that the population of the energy levels can be described by a single temperature (commonly referred to as excitation temperature, Tex), successfully reproduce the emission for the vast majority of species. As demonstrated by Goldsmith & Langer (1999), they account for the molecular emission due to quasi-thermal excitation, a regime in which LTE is achieved despite Tex remaining significantly lower than Tkin.
In Table 1, we list the most intense unblended or slightly blended transitions of trans-MF (A-symmetry substate) observed toward G+0.693. The rest of the lines, which appear blended with brighter transitions from other species, show predicted intensities that are consistent with the observed spectra considering the contribution from more than 140 species previously identified toward G+0.693. Contrary to its tentative detection toward the envelope of Sgr B2(N), where only three K = 0 transitions with Jup = 1–3 and a single K = 1 transition belonging to the A-substate were observed (Neill et al. 2012), the current survey of G+0.693 allowed us to detect a myriad of aR-branch transitions with Ka=0, 1 and 2, covering from Jup = 4 to Jup = 15. Additionally, weak bR-branch transitions (i.e., 61,5–50,5) were also identified.
To derive the physical parameters of the trans-MF emission, we used the AUTOFIT tool within MADCUBA-SLIM (Martín et al. 2019), which carries out a nonlinear least-squares fitting of the simulated LTE spectra to the observed astronomical data, considering the expected emission from the already identified molecules in the same frequency region. The best-fitting LTE model for trans-MF was achieved after splitting the transitions into the Ka = 0 and Ka > 0 rotational ladders, as has been done for the analysis of other molecules toward this cloud (Zeng et al. 2018; Rodríguez-Almeida et al. 2021a). The fitted line profiles of trans-MF are shown in Fig. 2 (red solid line). As shown in Fig. 2, the LTE model works fine for all transitions with the only exception of the 51,5–41,4 transition at ∼44.797 GHz, which appears to be overestimated. This is likely due to plausible non-LTE effects, which are currently beyond the scope of this work as collisional rate coefficients are not available for this high-energy conformer, leaving LTE analysis as the only viable method to determine its excitation conditions in G+0.693. Given that the number of detected clean lines is very high (with over a dozen unblended or only negligibly blended lines that perfectly fit the observed spectra; see Fig. 2), we are confident about the robust detection of this molecular species. We derived a molecular column density for the Ka=0 lines of N = (8.2 ± 0.4) ×1012 cm−2, a Tex = 14 ± 4 K and a radial velocity of νLSR = 70.6 ± 2.5 km s−1, while the full width at half maximum (FWHM) was fixed in the fit to the values found for cis-MF (FWHM = 21 km s−1; see below). Consequently, we obtained a molecular abundance with respect to H2 of ∼6.1 × 10⁻¹¹, assuming a N(H2) = 1.35×1023 cm−2 from Martín et al. (2008).
Furthermore, it is worth noting that, apart from the lines that fall within the Q-band data, the remaining transitions explored in this work have been spotted for the first time in space using the spectral survey of G+0.693, and still remain undetected in the laboratory. Hence, despite the secure detection reported here, we urge the laboratory spectroscopic community to conduct further high-resolution rotational measurements and to expand the frequency coverage for this high-energy conformer into the millimeter- and submillimeter-wave frequency domains. These data will be key for conducting reliable searches toward cold sources exhibiting very narrow line widths (∼0.5 km−1), such as the prestellar core L1544 or the cold dark cloud TMC-1 (Jiménez-Serra et al. 2016; Cernicharo et al. 2021), and also toward hot corinos or even hot cores (FWHM ∼5 km s−1), especially when using ALMA bands 6 or 7, where higher-energy transitions can be efficiently populated.
Afterward, to derive the cis/trans abundance ratio for MF, we present an analysis of cis-MF toward G+0.693, previously reported by Requena-Torres et al. (2006). In this context, we conducted a supplementary search using the current astronomical dataset, which allowed us to significantly increase the number of observed transitions (see Table A.4). We used the rotational spectroscopic dataset of cis-MF reported in Ilyushin et al. (2009) (entry 60003 of the JPL catalog; Pickett et al. 1998), which includes both the A- and E-substates. For the subsequent LTE analysis of cis-MF and to constrain the excitation conditions, we selected transitions that i) are not blended with the emission from other molecules and ii) span a substantial range of rotational energy levels (Eu ranging from 4.3 to 54.0 K; see Table A.4). In Fig. B.1 we show the result of the best LTE fit derived from AUTOFIT, achieved through a two-step approach, as described in San Andrés et al. (2024). First, we constrained the FWHM using exclusively the highest S/N unblended transitions, obtaining a value of 21 ± 2 km s−1. Then, we performed a second fit that includes all the transitions shown in Fig. B.1, fixing the FWHM. The derived physical parameters of cis-MF are given in Table 2. We obtained a N = (60 ± 3) ×1013 cm−2, which translates into a fractional abundance with respect to H2 of ∼4.5 × 10⁻⁹; a Tex of 13.4 ± 0.8 K, which is consistent with that found for trans-MF; and a νLSR = 68.3 ± 0.8 km s−1. We thus obtain a cis/trans abundance ratio of 72 ± 16 toward G+0.693, a factor of ∼7 larger than that found in the envelope of Sgr B2(N) (Neill et al. 2012; Faure et al. 2014).
Observed transitions of trans-MF (A-symmetry substate) detected toward G+0.693 and L1157-B1 that are unblended or slightly blended.
2.4 Detection of trans-MF toward L1157-B1 and derivation of the cis/trans ratio
In Fig. 3a, we show the nine brightest transitions of trans-MF detected toward the prototypical shock L1157-B1 that are free from contamination from other species (listed in Table 1). In this case, we identified two aR-branch progressions with Ka = 0 and 1, covering from Jup = 9 to Jup = 12 belonging to the A-symmetry substate. We again employed the AUTOFIT tool to perform the corresponding LTE fit using all the above lines. We assumed a source size of 18”, the same as that derived for the strong shock tracer SiO, and as PN and PO (Lefloch et al. 2016). The best-fitting model for trans-MF yields the following physical parameters (see Table 2): N = (1.6 ± 0.3) ×1012 cm−2, Tex = 14 ± 3 K, νLSR = −0.6 ± 0.3 km s−1, and FWHM = 5.2 ± 0.6 km s−1. We obtained a molecular abundance with respect to molecular hydrogen of ∼8 × 10⁻¹⁰, adopting N(H2) = 2×1021 cm−2 from Lefloch et al. (2012, 2017); Di Francesco et al. (2020), which implies that trans-MF is an order of magnitude more abundant in L1157-B1 compared to G+0.693.
We also conducted a complementary stacking analysis, shown in Fig. 3b, where the stacked spectrum was obtained by an intensity and noise-weighted average of the data at the expected frequencies of the transitions of trans-MF. We derived a final integrated S/N value6 of ∼12, which strengthens the detection even further.
Although the detection of the more stable cis-MF toward this source had already been reported in Lefloch et al. (2017), we repeated the analysis for comparison purposes using MADCUBA. A sample list of the brightest transitions of cis-MF are shown in Fig. B.2 and their spectroscopic information is given in Table A.5. The derived physical parameters of the LTE analysis using the AUTOFIT tool are reported in Table 2, along with the data of trans-MF. Overall, our results are consistent with those reported in the previous work (N = (5.4 ± 0.8) × 1013 and Tex = 20.7 ± 1.5; Lefloch et al. 2017), although we derived a slightly lower value for Tex. This may be attributed to the use of a different source size compared to the previous analysis of cis-MF toward this region since, to our knowledge, this value is not explicitly mentioned in Lefloch et al. (2017).
Based on the derived molecular abundance (see Table 2), we obtain a cis/trans MF abundance ratio of 34 ± 4 toward L1157-B1, which is a factor of ∼2 lower than the ratio derived toward G+0.693, and about three times larger than that obtained toward the envelope of Sgr B2(N).
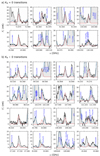 |
Fig. 2 Transitions of trans-MF (A-symmetry substate) identified toward G+0.693 (listed in Table 1) sorted by decreasing peak intensity. The result of the best LTE fit of trans-MF is plotted with a red line and the emission from all the molecules identified to date in our survey of G+0.693 including trans-MF is plotted with a blue line; the observed spectra are shown as gray histograms. |
Derived physical parameters for cis- and trans-MF toward the G+0.693 molecular cloud and L1157-B1.
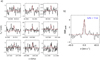 |
Fig. 3 (a) Transitions of trans-MF identified (A-symmetry substate) toward L1157-B1 (listed in Table 1) sorted by increasing frequency. The result of the best LTE fit of trans-MF is plotted with a red line (observed spectra shown as black lines and gray-shaded histograms). (b) Velocity stack of the observations (in gray) with the corresponding stack of the LTE simulation using the best-fit parameters to the individual lines (in red). The RMS of the stacked spectrum is 0.36 mK, implying an integrated signal-to-noise ratio (S/N) of 11.6. |
3 Quantum chemical calculations
The observation of trans-MF toward these regions raises the intriguing question of what the main, and potentially selective, formation pathways of trans-MF in the ISM are. Extensive research has been conducted on the interstellar production of MF, including both gas-phase (e.g., Horn et al. 2004; Neill et al. 2011; Laas et al. 2011; Cole et al. 2012; Balucani et al. 2015) and grain-surface (e.g., Garrod et al. 2006; Garrod 2013; Enrique-Romero et al. 2022) processes. In gas-phase chemistry, MF can be formed through the oxidation of the CH3OCH2 radical, which can be formed by several reactions involving dimethyl ether (CH3OCH3), for example O + CH3OCH2 → HC(O)OCH3 + H.
On grain surfaces, MF is thought to form through the recombination of radicals, produced by UV radiation or cosmic ray-induced photodissociation of simple molecules, through the following reaction (Garrod 2013; Enrique-Romero et al. 2022):

Nevertheless, to the best of our knowledge, these grainsurface studies are limited to the investigation of the most stable cis conformer, and thus lack compelling data regarding the formation of trans-MF and the expected isomeric ratio. Neill et al. (2012) and Cole et al. (2012) provided hints on several gas-phase production mechanisms by which trans-MF could be produced at a nonthermal abundance (i.e., out of thermodynamic equilibrium) in Sgr B2(N). However, no conclusions have been reached that fully rationalize and quantify the presence of trans-MF in the ISM, especially through grain synthesis. In this regard, new grain-surface theoretical studies should provide essential reference data for constraining models of conformer-selective formation pathways. Therefore, we have conducted an accompanying theoretical study, entailing a thorough exploration of the radical-radical reaction (1) on the surface of dust grains, to analyze whether it results in a stereoisomeric excess of either of the two MF conformers.
3.1 Computational protocol
The excess of a certain isomeric form can have several origins (see Sect. 4). The most straightforward is explaining the excess relying on selective formation routes. We tested this hypothesis for MF considering its formation on the surface of dust grains through the radical-radical reaction (1) (Garrod 2013; Enrique-Romero et al. 2022), which is considered to be the most important one for the molecule.
To check whether this route produces an excess of any conformer of MF, we carried sampling calculations of HCO radicals reacting with pre-adsorbed CH3O on amorphous solid water (ASW) clusters. The reason why HCO is considered the mobile radical in the reaction is the higher binding energy (BE) of CH3O over HCO, making the latter likely to diffuse and react. Enrique-Romero et al. (2022) showed that precaution is advised when studying this reaction on ices, due to barriers emerging as a result of the interaction of the adsorbates with ASW, and therefore we follow exactly the same theoretical framework to carry out our simulations. All the calculations in this work were performed with the ORCA 5.0.4 code (Neese 2012; Neese et al. 2020) and our own sampling routines.
The protocol for the setup of the calculations is as follows. We begin extracting the Cartesian coordinates of the 18 H2O ice used in Enrique-Romero et al. (2022)7, and optimizing the structure under ORCA standard convergence criteria. As mentioned above, the theoretical method used in our calculations is exactly the same as in Enrique-Romero et al. (2022) (i.e., BHLYP-D3BJ/6-31+G(d,p)) that was originally benchmarked against high-level multireference calculations8. Once the ice cluster model structure is optimized, we localize different binding sites on the cluster, placing 25 CH3O radicals around the cluster and optimize the initial structure with loose convergence criteria. The reason for using these convergence criteria for the optimization is to reduce the cost associated with the sampling using a sequential optimization approach (vide infra). After this second optimization we extract three binding configurations, sporting electronic binding energies (BE) of ∼4800 K, 2800 K, and 1000 K. We call these sites High, Medium, and Low linked with these BE.
For each of the initial structures mentioned above, we sequentially place 100 HCO molecules in random points around the CH3O molecule, with the center of mass (CDM) of the HCO molecule placed at 3.5 Å + {max |X|, max |Y| , max |Z| }, using a procedure similar to that shown in Molpeceres et al. (2021). max |X| , max |Y| , max |Z| are the absolute values of the maximum Cartesian component of CH3O on the ice. The orientation of HCO is randomized. Once the two molecules are placed, the HCO molecule is projected along the vector connecting the CDM of the two molecules. This ensures a homogeneous distance between the two fragments of ∼3.5 Å. Our routine enforces another constraint where any HCO molecule cannot be at a smaller distance to any water molecules in the cluster of 2.5 Å. In both cases we refer to interfragment distance, meaning that some atoms might be locally closer or farther away. An example of the sampling is shown in Fig. 4. We note that we sample both pure Langmuir-Hinshelwood diffusive chemistry and Eley-Rideal trajectories.
Each of the initial configurations is subsequently optimized starting from an open shell singlet wavefunction. Because running × 300 geometry optimizations (3 binding sites ×100 samples) is a very demanding task for our computational setup, for this analysis we ran the calculations sequentially. In the first place, we carried out all 300 calculations using loose convergence criteria for the optimization. From the results of these calculations, we took the ones that already converged to a reactive result and were considered finished. For the rest, werestarted the calculations, tightening the geometry relaxation convergence criteria and fixing the cluster’s atoms degrees of freedom. We repeated this procedure until tight convergence criteria were imposed. The sequential convergence criteria correspond to Loose, Normal, and Tight in the ORCA 5.0.4 package (see Table A.3; Neese 2012; Neese et al. 2020). The trajectories that did not show appreciable reactivity even under stringent criteria were labeled nonreactive, in a “flavor” similar to that used in Lamberts et al. (2019) or Enrique-Romero et al. (2022). A tiny number (2/300) of trajectories needed to be discarded, due to the break of the open-shell singlet wavefunction during the optimization procedure. These trajectories were simply removed from any posterior analysis.
Once the simulations are concluded we analyze them using statistical approaches. Each outcome is automatically sampled based on three geometrical parameters. The O-H distance is used to probe the formation of CH3OH, the C-O distance in MF is used to probe the formation of any isomer of MF, and the dihedral angle ∠COCO of the participating radicals is used to sample the isomerism of the product. A structure that does not fall into any of the above cases is labeled nonreactive. After considering all the possible outcomes, and because our protocol finds a significant number of nonreactive events, we evaluate our results based on a statistical analysis. Each outcome uncertainty is drawn from a binomial distribution of outcomes, calculated using a Jeffreys interval and a confidence level of 95%. We use the STATSMODELS Python library for the statistical analysis (Seabold & Perktold 2010). Finally, the uncertainties on the ratios for the different outcomes  and Ntrans−MF /Ncis−MF are obtained based on error propagation theory, using as uncertainty for each number the highest of their upper and lower bounds obtained in the binomial analysis mentioned above.
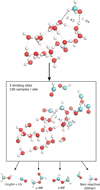 |
Fig. 4 Schematic representation of the sampling of reactive outcomes for the CH3O + HCO reaction on a 18 H2O cluster. Top: placement of the CH3O molecule (depicting the High site; see text). Center: simplified representation of the radicals placed around the CH3O radical. We depict only eight starting geometries, for clarity of visualization, while in reality they are 100 per binding site. Bottom: possible outcomes of the simulations. |
3.2 Quantum chemical results
The results of our sampling are reported in Table 3. An inspection of the table quickly reveals several conclusions regarding the formation of MF, and suggests new avenues to improve our results. It is revealing that nonreactive events tend to dominate the outcomes, with nearly 50% of the outcomes in High and Medium binding sites. This number is reduced for the sampling in Low binding sites, owing to the geometry of the CH3O radical in this site, where the – CH3 moiety is more accessible to the attack of HCO (see Fig. 5). Nevertheless, the amount of nonreactive events is high in all cases. This outcome can be seen as a combination of a physical effect where not all orientations are reactive, as shown in Enrique-Romero et al. (2022); Simons et al. (2020); Molpeceres et al. (2021); Molpeceres et al. (2022), and a nonphysical effect arising from the limited tolerance of the geometry optimizer in static quantum chemical calculations. Improving on the description of branching ratios in radical-radical reactions is in our immediate research plans, through molecular dynamics simulations to palliate the nonphysical effect generated by the optimizer. Nevertheless, our current approach allows us to draw sufficient conclusions for the CH3O+ HCO reaction.
We first note that for the  ratio we observe that the formation of methanol, evincing the occurrence of hydrogen abstraction reactions, generally dominates over addition, except for the Medium binding site where the ratio approaches one. Taking the average of
  9 with an appropriate treatment of error propagation, we arrive at
  , showing slightly preferential formation of CH3OH + CO in our sampling.
Second, we inspect the ratio Ntrans-MF/Ncis-MF„ which is more interesting for the purpose of this article. While the formation of cis-MF greatly dominates in our sampling, we observe that we do find a tiny amount of trans-MF (1/300 trajectories), which improves the statistical robustness of our analysis. Extracting  , we arrive at ∼ 0.013 (or inverting the numerator and denominator ∼75). However, we note that in the last column of Table 3 the uncertainty is higher than the derived value. Our results unambiguously indicate that the CH3O + HCO pathway is stereoselective, which means that the formation of cis-MF is markedly dominant (as shown in Fig. 6 with a thick solid line), although trans-MF is also produced as a rarity, which is the most important result of the theoretical part of our study. The stereospecific formation of a certain isomeric form is in agreement with our previous study for HC(O)SH (Molpeceres et al. 2021), but is at odds with our newest work on C2H4O2 (Del Valle et al. 2024). Overall, it is not possible to rule out a priori which routes are stereospecific on the surface, as they depend on the specific binding mode of the molecule with it. In addition, the fact that trans-MF is barely formed on the surface indicates, approximations of our limiting sampling aside, that the isomeric ratio may not be fully explained relying on the CH3O + HCO → MF formation route alone. Therefore, as described in the following section, further (mostly gas-phase) pathways will be pivotal in fine tuning the derived cis/trans ratio.
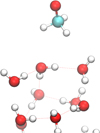 |
Fig. 5 Initial placement of the weak binding site. |
Outcome of the theoretical simulations in different binding sites.
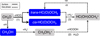 |
Fig. 6 Suggested stereoselective chemical routes for the formation of MF in the ISM discussed in this work. Molecules that have been identified toward the three target sources are depicted in blue. Surface reactions are shown as black solid lines, while gas-phase reactions are depicted with dashed arrows. The thick solid line represents a dominant formation of cis-MF. |
4 Discussion: Whether stereoselective grain reactions can explain the observed isomeric ratio
On the basis of the observed molecular abundances, we derive a cis/trans isomeric ratio of 72 ± 16 and 34 ± 4 toward G+0.693 and L1157-B1, respectively, which can be put together with the previously reported value of ∼7 observed toward the envelope of Sgr B2(N) (Neill et al. 2012). At this point, a question naturally arises of whether there are any common ingredients between the three astronomical sources where trans-MF has been detected. As mentioned in Sect. 2, the chemistry of G+0.693 and L1157B1 is clearly dominated by interstellar shocks. The same applies to the envelope of Sgr B2(N), as supported by the observation of shock-related species such as SiO all over the envelope of the Sgr B2 cloud (Martín-Pintado et al. 1997), and also the tentative detection of FeO or SiN (Walmsley et al. 2002; Schilke et al. 2003). Moreover, these three environments exhibit enhanced cosmic-ray ionization rates (CRIRs) compared to the standard Galactic disk value of ζ =1.3×10⁻¹⁷ s−1 (Padovani et al. 2009), highlighting values above ζ ∼ 10−15 s−1 in the central molecular zone (CMZ) (Goto et al. 2014; Yusef-Zadeh et al. 2024). For instance, ζ ∼ 102–103 times higher than the canonical value is needed to reproduce the observations of recently detected ions toward G+0.693 (i.e., PO+ and HOCS+; Rivilla et al. 2022b; Sanz-Novo et al. 2024a), while slightly lower CRIRs of ∼2–3×10⁻¹⁶ s−1 and ∼4×10⁻¹⁶ s−1 have been constrained for L1157-B1 (Podio et al. 2014; Luo et al. 2024)) and the Sgr B2 envelope (van der Tak et al. 2006)). These high CRIRs, as we show below, may also play a crucial role in the intricate balance of formation and destruction of trans-MF, ultimately enabling its detection.
The results from our theoretical computations on grains suggest a stereoselective formation of trans-MF via the CH3O + HCO route (reaction 1 shown in Fig. 6). We derive a trans/cis ratio comprised between 0.0 and 0.14 (considering the uncertainties in the computations), which is in reasonable agreement with those observed, in the range 0.014–0.1 for the three target sources. Strikingly, our approximated cis/trans theoretical value of ∼75 (after inverting the numerator and denominator) nicely matches the ratio found for G+0.693 of ∼72, which suggests that trans-MF is selectively formed on icy grain surfaces. In this context, it is thought that the energetic conditions of G+0.693 promote nonthermal radical chemistry on the ices that are easily released to the gas phase through shocks. Therefore, the gas in G+0.693, but also that in L1157-B1 and the envelope of Sgr B2(N), serves as an excellent tracer for the chemistry on the ices. We also note that the transient and highly reactive CH3O radical is often challenging to detect in radio astronomical observations. When observed, its abundance is significantly low, even lower than that of MF (Jiménez-Serra et al. 2016), as it can rapidly react to form more complex products. Thus, although CH3O has not yet been detected toward the target regions, we anticipate an efficient production as a result of UV secondary photons induced by cosmic rays interacting with the surface of dust grains, which photodissociate CH3OH.
Although the variability of the isomeric ratio found across the three sources could be directly inherited from the grain chemistry, additional gas-phase events contributing to a selective formation of trans-MF cannot be ruled out a priori. Once trans-MF reaches the gas phase, the large computed barrier for the relaxation process from trans-MF to cis-MF (∼13.8 kcal mol−1 or 6944 K Senent et al. 2005; Neill et al. 2012) is likely to prevent the conformational isomerization from occurring under ISM conditions. Ground-state quantum tunneling effects are also likely greatly diminished, in contrast to other examples occurring through a single H-atom migration (García de la Concepción et al. 2021, 2022), due to the much heavier methyl group. Such hypothetical scenario would result in an exceedingly high cis/trans under thermal equilibrium conditions (e.g., approximately 1013:1 at 100 K), which would mean that the trans conformer should not be detectable in the ISM.
In this scenario, we need to explore the alternative gas-phase processes that have already been proposed to favor the production of trans-MF over cis-MF (Neill et al. 2011, 2012; Cole et al. 2012). One of the most promising pathways is the following ionmolecule reaction 2 (also depicted in Fig. 6) between protonated methanol (CH3OH2+) and formic acid (HCOOH):

This exothermic and barrierless reaction was studied theoretically by Neill et al. (2011) and in the laboratory by Cole et al. (2012), and it was also included in the models of Laas et al. (2011). The route involves two distinct transition state geometries that lead to different conformations of protonated MF, depending on the cis or trans arrangements of the C–O–C–O dihedral angle. Interestingly, the formation of trans-MF proceeds without an activation barrier, while the synthesis of the cis conformer implies a net barrier of 10 kJ mol −1. Thus, reaction 2 appears to be stereoselective and may preferentially yield trans-MF through dissociative recombination. This route only requires that both reactants, HCOOH and CH3OH, are produced on grains, and once desorbed into the gas phase, CH3OH can be protonated by the reaction with H3+ (Fiaux 1976), followed by the formation of trans-MF. HCOOH is abundant in the three studied sources (Winnewisser & Churchwell 1975; Lefloch et a l. 2017; Sanz-Novo et al. 2023), and we expect that CH3OH2+ is also present, given the high abundance of CH3OH, and the aforementioned high CRIRs found in these environments. Thus, this route may significantly contribute to the formation and subsequent detection of trans-MF toward the target regions.
In sharp contrast, an additional acid-catalyzed Fischer esterification reaction between neutral methanol and protonated formic acid (Neill et al. 2011) (i.e., CH3OH + HC(OH)2+ → HC(OH)OCH3+ + H2O) was quickly ruled out. This stems from the formation of both cis- and trans-MF, which involves significant activation barriers (17 kJ mol−1 and 21 kJ mol−1, translated in 2045 K and 2526 K, respectively), and therefore is not viable under the relatively low gas kinetic temperatures of the studied interstellar sources.
Neill et al. (2012) also proposed an alternative mechanism for the conformational isomerization involving an indirect process. In this scenario, MF could first be protonated by a prevalent molecular ion (reaction 3, shown in Fig. 6), such as H3+, and then undergo dissociative recombination. Both of these steps are highly exothermic, according to gas-phase proton affinities (Hunter & Lias 1998), with energy releases that may surpass the isomerization barriers between the neutral cis and trans conformers of MF. Thus, since the barriers for isomerization in the protonated form are estimated to be similar, the highly energetic molecule might undergo isomerization during the relaxation phase of either reaction step. As a result, this process could create a cyclical effect, leading to a nonthermal conformational abundance ratio, which may also significantly contribute to the formation of trans-MF. This route is in essence similar to the recently proposed sequential acid-base mechanism used to explain formic acid (HCOOH) isomerism (García De La Concepción et al. 2023) suggesting that this might be a common mechanism to explain selective isomerism.
The last of the known mechanisms that can be considered to produce an isomeric excess is the interconversion on grain surfaces through a two-step hydrogen interconversion (H-abstraction + hydrogen addition). It is known that this mechanism produces an excess of the most stable conformer of HCOOH (Molpeceres et al. 2022). However, in the case of MF we do not expect this mechanism to play a role since the isomeric form is determined by the C-O-C-O dihedral moiety, so there is no chance to initiate the abstraction and/or addition cycle in the first place.
Additionally, regarding possible stereoselective destruction mechanisms, it is worth noting that if the relative dipole principle (RDP; Shingledecker et al. 2020) holds for this family of conformers, the higher dipole moment of trans-MF (µa = 4.2 D; Neill et al. 2012) will make destruction rates in the gas phase faster than in the case of cis-MF (µa = 1.6 D; Curl 1959), further decreasing the trans/cis ratio. Therefore, this general rule of thumb could also contribute to fine-tuning the final observed isomeric ratio, making the detection of trans-MF even more challenging, should this mechanism prove efficient.
Overall, combining our quantum chemical results with our knowledge of the objects hosting trans-MF, we conclude that stereoselective grain surface routes could qualitatively predict the observations. However, thorough chemical modeling that includes additional gas-phase formation (and destruction) pathways (see, e.g., Cole et al. 2012; Neill et al. 2012; Shingledecker et al. 2020; García De La Concepción et al. 2023) will be pivotal to determine whether the CH3O + HCO → MF reaction alone can produce enough trans-MF to match the observed isomeric ratio, as well as to establish the dominant formation pathway, if one exists.
5 Conclusions
In this study we presented new detections of the high-energy conformer of methyl formate (trans-MF) toward two shocked-dominated regions: G+0.693-0.027 and L1157-B1, providing definite observational evidence of its presence in the ISM. Additionally, aiming to shed light on the conformational isomeric ratio of MF, we compared the derived observational ratios with predictions based on new grain-surface chemistry computations. The main conclusions of this work are the following:
We have conclusively confirmed the interstellar detection of trans-MF, which was previously tentatively observed in the envelope of Sgr B2(N), as reported by Neill et al. (2012), through its identification in two shock-dominated regions: G+0.693 and L1157-B1. In both sources, we have identified numerous unblended aR-branch Ka = 0, 1 transitions belonging to the A-symmetry substate of trans-MF. Many of these lines were observed for the first time directly in the radio astronomical data and still remain unmeasured in the laboratory. We derived a molecular column density for trans-MF of N(G+0.693) = (8.2 ± 0.4) ×1012 cm−2 and N(L1157-B1) = (1.2 ± 0.2) ×1012 cm−2, yielding a molecular abundance with respect to H2 of ∼6 × 10⁻¹¹ and ∼6 × 10⁻¹⁰, respectively, for each source;
Based on the derived abundances, we obtain a cis/trans isomeric ratio of ∼72 and ∼34 toward G+0.693 and L1157-B1, respectively, which are about seven and three times larger than that found in the Sgr B2(N) region and also quite far from the expected thermodynamic ratio (i.e., approximately 1013:1 at 100 K);
Our theoretical results suggest that grain surface pathways can qualitatively explain the observed nonthermal cis/trans abundance ratio, pinpointing to a stereospecific formation of trans-MF via the CH3O + HCO route (reaction 1). Particularly, we found a nice match between the predicted ratio (∼75) and the observed value toward G+0.693 (∼72), but with a great uncertainty. Nevertheless, additional stereospecific gas-phase routes (i.e., reactions 2) and may also play a crucial role in shaping the formation of an excess of trans-MF, ultimately enabling its detection. Thus, detailed modeling of the chemistry of trans-MF will be key to disclosing its primary formation pathway, should it exist;
Future observational efforts may focus on the search for trans-MF toward sources where the most stable cis conformer is very abundant and, ideally, environments dominated by shocks and high CRIRs, which appear as two key players driving the detection of the high-energy trans-MF conformer. However, additional laboratory measurements will be needed first to enable reliable searches if the target source exhibits very narrow line widths (see, e.g., the QUIJOTE line survey of TMC-1, with FWHM= 0.5−0.6 km s−1; Cernicharo et al. 2021);
Finally, we have shown that the exploration of stereoisomerism itself serves as (i) a powerful tool to distinguish between different chemical routes of molecules as molecular complexity increases and (ii) a driving motif for the detection of new species in the ISM. In some cases, the most stable conformers are nearly invisible to radio astronomical observations, whereas higher-energy species exhibit a sizable dipole moment (Sanz-Novo et al. 2023). Consequently, it will be crucial to characterize in detail the spectral features and formation mechanisms not only of the most stable conformers, but also of all the structures that are present in the conformational panorama of the molecule, some of which are potentially detectable in the ISM.
Acknowledgements
We are grateful to the IRAM 30 m and Yebes 40 m telescopes staff for their help during the different observing runs, highlighting project 21A014 (PI: Rivilla), project 018-19 (PI: Rivilla) and project 123-22 (PI: Jiménez-Serra). The 40 m radio telescope at Yebes Observatory is operated by the Spanish Geographic Institute (IGN, Ministerio de Transportes, Movilidad y Agenda Urbana). IRAM is supported by INSU/CNRS (France), MPG (Germany) and IGN (Spain). We are grateful for the dataset of the ASAI IRAM-30m Large Program (https://www.iram-institute.org/EN/content-page-344-7-158-240-344-0.html) provided in Zenodo within the framework of ACO (AstroChemical Origins): (H2020 MSCA ITN, GA:811312), and for making it available to the community. M. S.-N. acknowledges a Juan de la Cierva Postdoctoral Fellow proyect JDC2022-048934-I, funded by the Spanish Ministry of Science, Innovation and Universities/State Agency of Research MICIU/AEI/10.13039/501100011033 and by the European Union “NextGenerationEU”/PRTR”. V. M. R. acknowledges support from project number RYC2020-029387-I funded by MCIN/AEI/10.13039/501100011033 and by “ESF, Investing in your future”, from the Consejo Superior de Investigaciones Científicas (CSIC) and the Centro de Astrobiología (CAB) through the project 20225AT015 (Proyectos intramurales especiales del CSIC), and from the grant CNS2023-144464 funded by MICIU/AEI/10.13039/501100011033 and by “European Union NextGenerationEU/PRTR”. I. J.-S., V.M.R. and M. S.-N, acknowledge funding from grant No. PID2022-136814NB-I00 funded by MICIU/AEI/10.13039/501100011033 and by ERDF, UE. I.J.-S. also acknowledges support by ERC grant OPENS, GA No. 101125858, funded by the European Union. Views and opinions expressed are however those of the author(s) only and do not necessarily reflect those of the European Union or the European Research Council Executive Agency. Neither the European Union nor the granting authority can be held responsible for them. G.M acknowledges the support of the grant RYC2022-035442-I funded by MICIU/AEI/10.13039/501100011033 and ESF+. G.M. also received support from project 20245AT016 (Proyectos Intramurales CSIC). We acknowledge the computational resources provided by bwHPC and the German Research Foundation (DFG) through grant no INST 40/575-1 FUGG (JUSTUS 2 cluster), the DRAGO computer cluster managed by SGAI-CSIC, and the Galician Supercomputing Center (CESGA). The supercomputer FinisTerrae III and its permanent data storage system have been funded by the Spanish Ministry of Science and Innovation, the Galician Government and the European Regional Development Fund (ERDF).
Appendix A Complementary tables
In Table A.1 we report the experimental constants for the ground state of trans-MF (A-species) obtained from a separated effective fit to a semi-rigid rotor Hamiltonian (A-Reduction, Ir-Representation), while in Table A.2 we provide the corresponding rotational (Qr) partition function, needed to obtain reliable line intensities. We used SPCAT (Pickett 1991) to compute the values of Qr by direct summation of the ground state energy levels up to J = 79 as in Carvajal et al. 2019 for the cis conformer. These values are provided for the conventional temperatures as implemented in the Cologne Database for Molecular Spectroscopy (CDMS; Müller et al. 2005; Endres et al. 2016) and JPL database (Pickett et al. 1998), and agree well with the values of Qr = 4.67 Tex1.5 used in Neill et al. (2012) for the A species. In addition, since the excitation temperature of the molecules in G+0.693 are low (Tex = 5 − 20 K), we have not used in this case the vibrational contribution of the partition function (Qν). We then prepared a new catalog for the A-symmetry substate of trans-MF in the common JPL SPFIT/SPCAT format, which was used to carry out the interstellar search. Table A.3 provides the numerical values for the different ORCA convergence criteria used in this work. Finally, the list of observed transitions for cis-MF detected toward G+0.693 and L1157-B1 are given in Tables A.5 and A.4.
Experimental spectroscopic parameters for the A-symmetry substate of trans-MF (A-Reduction, Ir-Representation).
Rotational (Qr) partition function of the A-symmetry substate of trans-MF.
ORCA convergence criteria used in this work.
Appendix B Complementary figures
In Figs. B.1 and B.2 we present the fitted line profiles of cis-MF toward G+0.693 and L1157-B1, respectively. We used the same color code for the line profiles of Fig. 2 (i.e., fitted line profiles of cis-MF in red and the expected molecular emission from all the molecules detected to date toward G+0.693 in blue).
Sample list of the observed transitions of cis-MF detected toward G+0.693.
Observed transitions of cis-MF detected toward L1157-B1.
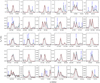 |
Fig. B.1 Selected transitions of cis-MF identified toward G+0.693 (listed in Table A.4 sorted by decreasing peak intensity. The result of the best LTE fit of cis-MF is plotted with a red line and the blue line depicts the emission from all the molecules identified to date in our survey of G+0.693 (observed spectra shown as black lines and gray-shaded histograms). |
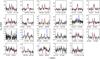 |
Fig. B.2 Selected transitions of cis-MF identified toward L1157-B1 (listed in Table A.5) sorted by decreasing peak intensity. The result of the best LTE fit of cis-MF is plotted with a red line and the blue line depicts the emission from the molecules identified toward L1157-B1 that appear in the vicinity of the lines belonging to cis-MF (observed spectra shown as black lines and gray-shaded histograms). |
References
- Agúndez, M., Marcelino, N., Tercero, B., et al. 2021, A&A, 649, L4 [NASA ADS] [CrossRef] [EDP Sciences] [Google Scholar]
- Bachiller, R., & Pérez Gutiérrez, M. 1997, ApJ, 487, L93 [Google Scholar]
- Bachiller, R., Pérez Gutiérrez, M., Kumar, M. S. N., & Tafalla, M. 2001, A&A, 372, 899 [NASA ADS] [CrossRef] [EDP Sciences] [Google Scholar]
- Bacmann, A., Taquet, V., Faure, A., Kahane, C., & Ceccarelli, C. 2012, A&A, 541, L12 [NASA ADS] [CrossRef] [EDP Sciences] [Google Scholar]
- Balucani, N., Ceccarelli, C., & Taquet, V. 2015, MNRAS, 449, L16 [Google Scholar]
- Belloche, A., Müller, H. S. P., Menten, K. M., Schilke, P., & Comito, C. 2013, A&A, 559, A47 [NASA ADS] [CrossRef] [EDP Sciences] [Google Scholar]
- Brown, R. D., Crofts, J. G., Gardner, F. F., et al. 1975, ApJ, 197, L29 [NASA ADS] [CrossRef] [Google Scholar]
- Brunken, N. G. C., Booth, A. S., Leemker, M., et al. 2022, A&A, 659, A29 [NASA ADS] [CrossRef] [EDP Sciences] [Google Scholar]
- Busquet, G., Lefloch, B., Benedettini, M., et al. 2014, A&A, 561, A120 [NASA ADS] [CrossRef] [EDP Sciences] [Google Scholar]
- Carvajal, M., Favre, C., Kleiner, I., et al. 2019, A&A, 627, A65 [NASA ADS] [CrossRef] [EDP Sciences] [Google Scholar]
- Cazaux, S., Tielens, A. G. G. M., Ceccarelli, C., et al. 2003, ApJ, 593, L51 [CrossRef] [Google Scholar]
- Cernicharo, J., Agúndez, M., Cabezas, C., et al. 2021, A&A, 656, L21 [NASA ADS] [CrossRef] [EDP Sciences] [Google Scholar]
- Codella, C., Fontani, F., Ceccarelli, C., et al. 2015, MNRAS, 449, L11 [CrossRef] [Google Scholar]
- Cole, C. A., Wehres, N., Yang, Z., et al. 2012, ApJ, 754, L5 [NASA ADS] [CrossRef] [Google Scholar]
- Colzi, L., Martín-Pintado, J., Zeng, S., et al. 2024, A&A, 690, A121 [NASA ADS] [CrossRef] [EDP Sciences] [Google Scholar]
- Curl, R. F. J. 1959, J. Chem. Phys., 30, 1529 [Google Scholar]
- Del Valle, J. C., Redondo, P., Kästner, J., & Molpeceres, G. 2024, ApJ, 974, 129 [Google Scholar]
- Di Francesco, J., Keown, J., Fallscheer, C., et al. 2020, ApJ, 904, 172 [NASA ADS] [CrossRef] [Google Scholar]
- Endres, C. P., Schlemmer, S., Schilke, P., Stutzki, J., & Müller, H. S. P. 2016, J. Mol. Spectrosc., 327, 95 [NASA ADS] [CrossRef] [Google Scholar]
- Enrique-Romero, J., Rimola, A., Ceccarelli, C., et al. 2022, ApJS, 259, 39 [NASA ADS] [CrossRef] [Google Scholar]
- Etxaluze, M., Goicoechea, J. R., Cernicharo, J., et al. 2013, A&A, 556, A137 [NASA ADS] [CrossRef] [EDP Sciences] [Google Scholar]
- Faure, A., Remijan, A. J., Szalewicz, K., & Wiesenfeld, L. 2014, ApJ, 783, 72 [CrossRef] [Google Scholar]
- Fiaux, A. 1976, Int. J. Mass Spectrom. Ion Processes, 20, 223 [Google Scholar]
- García de la Concepción, J., Jiménez-Serra, I., Carlos Corchado, J., Rivilla, V. M., & Martín-Pintado, J. 2021, ApJ, 912, L6 [CrossRef] [Google Scholar]
- García de la Concepción, J., Colzi, L., Jiménez-Serra, I., et al. 2022, A&A, 658, A150 [NASA ADS] [CrossRef] [EDP Sciences] [Google Scholar]
- García De La Concepción, J., Jiménez-Serra, I., Corchado, J. C., et al. 2023, A&A, 675, A109 [Google Scholar]
- Garrod, R., Hee Park, I., Caselli, P., & Herbst, E. 2006, Faraday Discuss., 133, 51 [Google Scholar]
- Garrod, R. T. 2013, ApJ, 765, 60 [Google Scholar]
- Goldsmith, P. F., & Langer, W. D. 1999, ApJ, 517, 209 [Google Scholar]
- Goto, M., Geballe, T. R., Indriolo, N., et al. 2014, ApJ, 786, 96 [CrossRef] [Google Scholar]
- Gusdorf, A., Pineau des Forêts, G., Cabrit, S., & Flower, D. R. 2008, A&A, 490, 695 [NASA ADS] [CrossRef] [EDP Sciences] [Google Scholar]
- Holdship, J., Viti, S., Jimenez-Serra, I., et al. 2016, MNRAS, 463, 802 [NASA ADS] [CrossRef] [Google Scholar]
- Horn, A., Møllendal, H., Sekiguchi, O., et al. 2004, ApJ, 611, 605 [Google Scholar]
- Hunter, E. P. L., & Lias, S. G. 1998, J. Phys. Chem. Ref. Data, 27, 413 [Google Scholar]
- Ilyushin, V., Kryvda, A., & Alekseev, E. 2009, J. Mol. Spectrosc., 255, 32 [Google Scholar]
- Jiménez-Serra, I., Vasyunin, A. I., Caselli, P., et al. 2016, ApJ, 830, L6 [Google Scholar]
- Jiménez-Serra, I., Rodríguez-Almeida, L. F., Martín-Pintado, J., et al. 2022, A&A, 663, A181 [NASA ADS] [CrossRef] [EDP Sciences] [Google Scholar]
- Jiménez-Serra, I., Megías, A., Salaris, J., et al. 2025, A&A, 695, A247 [NASA ADS] [CrossRef] [EDP Sciences] [Google Scholar]
- Karakawa, Y., Oka, K., Odashima, H., Takagi, K., & Tsunekawa, S. 2001, J. Mol. Spectrosc., 210, 196 [Google Scholar]
- Laas, J. C., Garrod, R. T., Herbst, E., & Widicus Weaver, S. L. 2011, ApJ, 728, 71 [Google Scholar]
- Lamberts, T., Markmeyer, M. N., Kolb, F. J., & Kästner, J. 2019, ACS Earth Space Chem., 3, 958 [Google Scholar]
- Lattanzi, V., Sanz-Novo, M., Rivilla, V. M., et al. 2024, A&A, 689, A260 [NASA ADS] [CrossRef] [EDP Sciences] [Google Scholar]
- Lattelais, M., Pauzat, F., Ellinger, Y., & Ceccarelli, C. 2009, ApJ, 696, L133 [Google Scholar]
- Lee, J.-E., Lee, S., Baek, G., et al. 2019, Nat. Astron., 3, 314 [Google Scholar]
- Lefloch, B., Cabrit, S., Busquet, G., et al. 2012, ApJ, 757, L25 [Google Scholar]
- Lefloch, B., Vastel, C., Viti, S., et al. 2016, MNRAS, 462, 3937 [CrossRef] [Google Scholar]
- Lefloch, B., Ceccarelli, C., Codella, C., et al. 2017, MNRAS, 469, L73 [Google Scholar]
- Lefloch, B., Bachiller, R., Ceccarelli, C., et al. 2018, MNRAS, 477, 4792 [Google Scholar]
- Luo, G., Bisbas, T. G., Padovani, M., & Gaches, B. A. L. 2024, A&A, 690, A293 [NASA ADS] [CrossRef] [EDP Sciences] [Google Scholar]
- Martín, S., Requena-Torres, M. A., Martín-Pintado, J., & Mauersberger, R. 2008, ApJ, 678, 245 [CrossRef] [Google Scholar]
- Martín, S., Martín-Pintado, J., Blanco-Sánchez, C., et al. 2019, A&A, 631, A159 [Google Scholar]
- Martín-Pintado, J., de Vicente, P., Fuente, A., & Planesas, P. 1997, ApJ, 482, L45 [NASA ADS] [CrossRef] [Google Scholar]
- Megías, A., Jiménez-Serra, I., Martín-Pintado, J., et al. 2023, MNRAS, 519, 1601 [Google Scholar]
- Mininni, C., Beltrán, M. T., Rivilla, V. M., et al. 2020, A&A, 644, A84 [NASA ADS] [CrossRef] [EDP Sciences] [Google Scholar]
- Molpeceres, G., García de la Concepción, J., & Jiménez-Serra, I. 2021, ApJ, 923, 159 [NASA ADS] [CrossRef] [Google Scholar]
- Molpeceres, G., Jiménez-Serra, I., Oba, Y., et al. 2022, A&A, 663, A41 [NASA ADS] [CrossRef] [EDP Sciences] [Google Scholar]
- Müller, H. S. P., Schlöder, F., Stutzki, J., & Winnewisser, G. 2005, J. Mol. Struct., 742, 215 [CrossRef] [Google Scholar]
- Neese, F. 2012, WIREs Computat. Mol. Sci„ 2, 73 [Google Scholar]
- Neese, F., Wennmohs, F., Becker, U., & Riplinger, C. 2020, J. Chem. Phys., 152, 224108 [Google Scholar]
- Neill, J. L., Steber, A. L., Muckle, M. T., et al. 2011, J. Phys. Chem. A, 115, 6472 [NASA ADS] [CrossRef] [Google Scholar]
- Neill, J. L., Muckle, M. T., Zaleski, D. P., et al. 2012, ApJ, 755, 153 [Google Scholar]
- Padovani, M., Galli, D., & Glassgold, A. E. 2009, A&A, 501, 619 [NASA ADS] [CrossRef] [EDP Sciences] [Google Scholar]
- Pearson, J. C., Sastry, K. V. L. N., Herbst, E., & De Lucia, F. C. 1997, ApJ, 480, 420 [NASA ADS] [CrossRef] [Google Scholar]
- Pickett, H. M. 1991, J. Mol. Spectrosc., 148, 371 [NASA ADS] [CrossRef] [Google Scholar]
- Pickett, H. M., Poynter, R. L., Cohen, E. A., et al. 1998, JQSRT, 60, 883 [NASA ADS] [CrossRef] [Google Scholar]
- Pineda, J. E., Maury, A. J., Fuller, G. A., et al. 2012, A&A, 544, L7 [NASA ADS] [CrossRef] [EDP Sciences] [Google Scholar]
- Podio, L., Lefloch, B., Ceccarelli, C., Codella, C., & Bachiller, R. 2014, A&A, 565, A64 [NASA ADS] [CrossRef] [EDP Sciences] [Google Scholar]
- Requena-Torres, M. A., Martín-Pintado, J., Rodríguez-Franco, A., et al. 2006, A&A, 455, 971 [NASA ADS] [CrossRef] [EDP Sciences] [Google Scholar]
- Requena-Torres, M. A., Martín-Pintado, J., Martín, S., & Morris, M. R. 2008, ApJ, 672, 352 [Google Scholar]
- Rivilla, V. M., Beltrán, M. T., Martín-Pintado, J., et al. 2017, A&A, 599, A26 [NASA ADS] [CrossRef] [EDP Sciences] [Google Scholar]
- Rivilla, V. M., Martín-Pintado, J., Jiménez-Serra, I., et al. 2019, MNRAS, 483, L114 [NASA ADS] [CrossRef] [Google Scholar]
- Rivilla, V. M., Martín-Pintado, J., Jiménez-Serra, I., et al. 2020, ApJ, 899, L28 [Google Scholar]
- Rivilla, V. M., Jiménez-Serra, I., García de la Concepción, J., et al. 2021a, MNRAS, 506, L79 [NASA ADS] [CrossRef] [Google Scholar]
- Rivilla, V. M., Jiménez-Serra, I., Martín-Pintado, J., et al. 2021b, PNAS, 118, 2101314118 [Google Scholar]
- Rivilla, V. M., Colzi, L., Jiménez-Serra, I., et al. 2022a, ApJ, 929, L11 [NASA ADS] [CrossRef] [Google Scholar]
- Rivilla, V. M., García De La Concepción, J., Jiménez-Serra, I., et al. 2022b, Front. Astron. Space Sci., 9, 829288 [Google Scholar]
- Rivilla, V. M., Sanz-Novo, M., Jiménez-Serra, I., et al. 2023, ApJ, 953, L20 [NASA ADS] [CrossRef] [Google Scholar]
- Rodríguez-Fernández, N. J., Martín-Pintado, J., de Vicente, P., et al. 2000, A&A, 356, 695 [NASA ADS] [Google Scholar]
- Rodríguez-Almeida, L. F., Jiménez-Serra, I., Rivilla, V. M., et al. 2021a, ApJ, 912, L11 [Google Scholar]
- Rodríguez-Almeida, L. F., Rivilla, V. M., Jiménez-Serra, I., et al. 2021b, A&A, 654, L1 [CrossRef] [EDP Sciences] [Google Scholar]
- San Andrés, D., Rivilla, V. M., Colzi, L., et al. 2024, ApJ, 967, 39 [CrossRef] [Google Scholar]
- Sanz-Novo, M., Rivilla, V. M., Jiménez-Serra, I., et al. 2023, ApJ, 954, 3 [NASA ADS] [CrossRef] [Google Scholar]
- Sanz-Novo, M., Rivilla, V. M., Jiménez-Serra, I., et al. 2024a, ApJ, 965, 149 [Google Scholar]
- Sanz-Novo, M., Rivilla, V. M., Müller, H. S. P., et al. 2024b, ApJ, 965, L26 [Google Scholar]
- Sanz-Novo, M., Rivilla, V. M., Endres, C. P., et al. 2025, ApJ, 980, L37 [Google Scholar]
- Schilke, P., Leurini, S., Menten, K. M., & Alcolea, J. 2003, A&A, 412, L15 [NASA ADS] [CrossRef] [EDP Sciences] [Google Scholar]
- Scibelli, S., Shirley, Y., Megías, A., & Jiménez-Serra, I. 2024, MNRAS, 533, 4104 [Google Scholar]
- Seabold, S., & Perktold, J. 2010, in 9th Python in Science Conference [Google Scholar]
- Senent, M. L., Villa, M., Meléndez, F. J., & Domínguez-Gómez, R. 2005, ApJ, 627, 567 [Google Scholar]
- Sewiło, M., Indebetouw, R., Charnley, S. B., et al. 2018, ApJ, 853, L19 [CrossRef] [Google Scholar]
- Shimonishi, T., Izumi, N., Furuya, K., & Yasui, C. 2021, ApJ, 922, 206 [NASA ADS] [CrossRef] [Google Scholar]
- Shingledecker, C. N., Álvarez-Barcia, S., Korn, V. H., & Kästner, J. 2019, ApJ, 878, 80 [Google Scholar]
- Shingledecker, C., Molpeceres, G., Rivilla, V., Majumdar, L., & Kästner, J. 2020, ApJ, 897, 158 [NASA ADS] [CrossRef] [Google Scholar]
- Simons, M. A., Lamberts, T., & Cuppen, H. M. 2020, A&A, 634, A52 [NASA ADS] [CrossRef] [EDP Sciences] [Google Scholar]
- Tercero, F., López-Pérez, J. A., Gallego, J. D., et al. 2021, A&A, 645, A37 [EDP Sciences] [Google Scholar]
- van der Tak, F. F. S., Belloche, A., Schilke, P., et al. 2006, A&A, 454, L99 [NASA ADS] [CrossRef] [EDP Sciences] [Google Scholar]
- Walmsley, C. M., Bachiller, R., Pineau des Forêts, G., & Schilke, P. 2002, ApJ, 566, L109 [Google Scholar]
- Watanabe, N., & Kouchi, A. 2002, ApJ, 571, L173 [Google Scholar]
- Winnewisser, G., & Churchwell, E. 1975, ApJ, 200, L33 [Google Scholar]
- Yusef-Zadeh, F., Wardle, M., Arendt, R., et al. 2024, MNRAS, 527, 1275 [Google Scholar]
- Zeng, S., Jiménez-Serra, I., Rivilla, V. M., et al. 2018, MNRAS, 478, 2962 [Google Scholar]
- Zeng, S., Zhang, Q., Jiménez-Serra, I., et al. 2020, MNRAS, 497, 4896 [NASA ADS] [CrossRef] [Google Scholar]
- Zeng, S., Jiménez-Serra, I., Rivilla, V. M., et al. 2021, ApJ, 920, L27 [NASA ADS] [CrossRef] [Google Scholar]
- Zeng, S., Rivilla, V. M., Jiménez-Serra, I., et al. 2023, MNRAS, 523, 1448 [NASA ADS] [CrossRef] [Google Scholar]
Madrid Data Cube Analysis on ImageJ is software developed at the Center of Astrobiology (CAB) in Madrid; http://cab.inta-csic.es/madcuba/; version from 2024 June 15.


BHLYP-D3BJ/6-31+G(d,p) in this work and Enrique-Romero et al. (2022) is slightly different because of the different standards of the codes employed. For example ORCA uses resolution-of-identity techniques as default that depend on auxiliary basis sets. Deviations are expected on the order of µEh, ca. 1×10⁻³ kcal mol−1, in the evaluation of electronic energies.
All Tables
Observed transitions of trans-MF (A-symmetry substate) detected toward G+0.693 and L1157-B1 that are unblended or slightly blended.
Derived physical parameters for cis- and trans-MF toward the G+0.693 molecular cloud and L1157-B1.
Experimental spectroscopic parameters for the A-symmetry substate of trans-MF (A-Reduction, Ir-Representation).
All Figures
|
Fig. 1 Structures of the lowest-energy conformers of methyl formate (MF), separated by a ΔE = 3000 K (25 kJ mol−1). The carbon atoms are shown in gray, oxygen atoms in red, and hydrogen atoms in white. |
| In the text | |
|
Fig. 2 Transitions of trans-MF (A-symmetry substate) identified toward G+0.693 (listed in Table 1) sorted by decreasing peak intensity. The result of the best LTE fit of trans-MF is plotted with a red line and the emission from all the molecules identified to date in our survey of G+0.693 including trans-MF is plotted with a blue line; the observed spectra are shown as gray histograms. |
| In the text | |
|
Fig. 3 (a) Transitions of trans-MF identified (A-symmetry substate) toward L1157-B1 (listed in Table 1) sorted by increasing frequency. The result of the best LTE fit of trans-MF is plotted with a red line (observed spectra shown as black lines and gray-shaded histograms). (b) Velocity stack of the observations (in gray) with the corresponding stack of the LTE simulation using the best-fit parameters to the individual lines (in red). The RMS of the stacked spectrum is 0.36 mK, implying an integrated signal-to-noise ratio (S/N) of 11.6. |
| In the text | |
|
Fig. 4 Schematic representation of the sampling of reactive outcomes for the CH3O + HCO reaction on a 18 H2O cluster. Top: placement of the CH3O molecule (depicting the High site; see text). Center: simplified representation of the radicals placed around the CH3O radical. We depict only eight starting geometries, for clarity of visualization, while in reality they are 100 per binding site. Bottom: possible outcomes of the simulations. |
| In the text | |
|
Fig. 5 Initial placement of the weak binding site. |
| In the text | |
|
Fig. 6 Suggested stereoselective chemical routes for the formation of MF in the ISM discussed in this work. Molecules that have been identified toward the three target sources are depicted in blue. Surface reactions are shown as black solid lines, while gas-phase reactions are depicted with dashed arrows. The thick solid line represents a dominant formation of cis-MF. |
| In the text | |
|
Fig. B.1 Selected transitions of cis-MF identified toward G+0.693 (listed in Table A.4 sorted by decreasing peak intensity. The result of the best LTE fit of cis-MF is plotted with a red line and the blue line depicts the emission from all the molecules identified to date in our survey of G+0.693 (observed spectra shown as black lines and gray-shaded histograms). |
| In the text | |
|
Fig. B.2 Selected transitions of cis-MF identified toward L1157-B1 (listed in Table A.5) sorted by decreasing peak intensity. The result of the best LTE fit of cis-MF is plotted with a red line and the blue line depicts the emission from the molecules identified toward L1157-B1 that appear in the vicinity of the lines belonging to cis-MF (observed spectra shown as black lines and gray-shaded histograms). |
| In the text | |
Current usage metrics show cumulative count of Article Views (full-text article views including HTML views, PDF and ePub downloads, according to the available data) and Abstracts Views on Vision4Press platform.
Data correspond to usage on the plateform after 2015. The current usage metrics is available 48-96 hours after online publication and is updated daily on week days.
Initial download of the metrics may take a while.