Fig. 2
Download original image
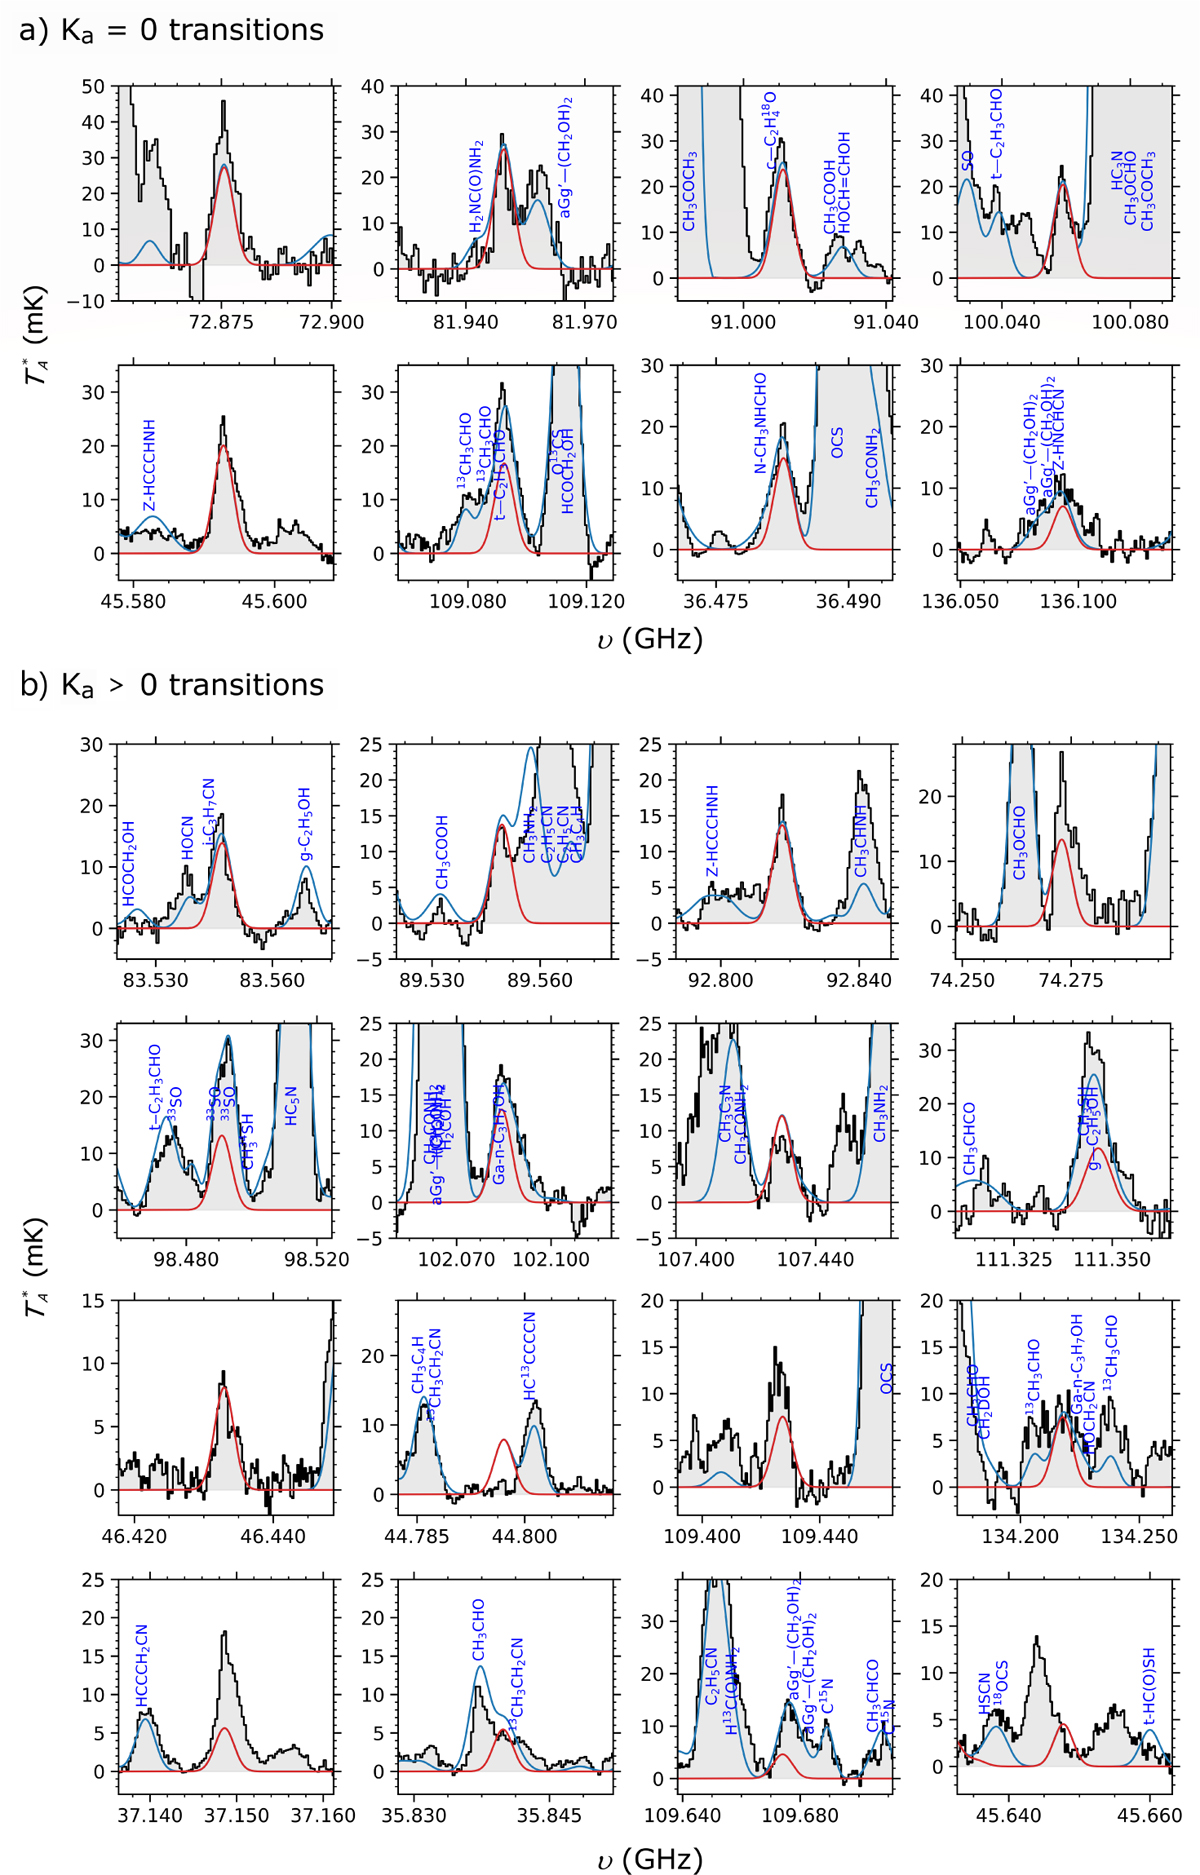
Transitions of trans-MF (A-symmetry substate) identified toward G+0.693 (listed in Table 1) sorted by decreasing peak intensity. The result of the best LTE fit of trans-MF is plotted with a red line and the emission from all the molecules identified to date in our survey of G+0.693 including trans-MF is plotted with a blue line; the observed spectra are shown as gray histograms.
Current usage metrics show cumulative count of Article Views (full-text article views including HTML views, PDF and ePub downloads, according to the available data) and Abstracts Views on Vision4Press platform.
Data correspond to usage on the plateform after 2015. The current usage metrics is available 48-96 hours after online publication and is updated daily on week days.
Initial download of the metrics may take a while.