Fig. 3
Download original image
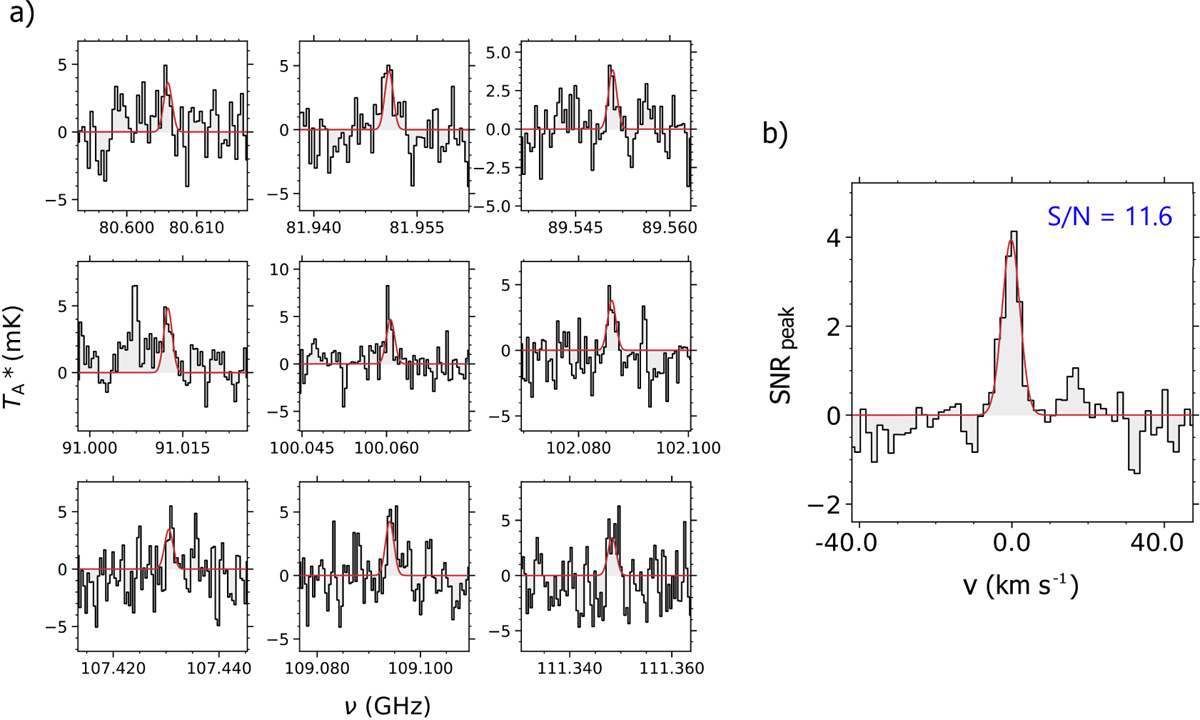
(a) Transitions of trans-MF identified (A-symmetry substate) toward L1157-B1 (listed in Table 1) sorted by increasing frequency. The result of the best LTE fit of trans-MF is plotted with a red line (observed spectra shown as black lines and gray-shaded histograms). (b) Velocity stack of the observations (in gray) with the corresponding stack of the LTE simulation using the best-fit parameters to the individual lines (in red). The RMS of the stacked spectrum is 0.36 mK, implying an integrated signal-to-noise ratio (S/N) of 11.6.
Current usage metrics show cumulative count of Article Views (full-text article views including HTML views, PDF and ePub downloads, according to the available data) and Abstracts Views on Vision4Press platform.
Data correspond to usage on the plateform after 2015. The current usage metrics is available 48-96 hours after online publication and is updated daily on week days.
Initial download of the metrics may take a while.